Housing density: 3,036 houses/condos per square mile
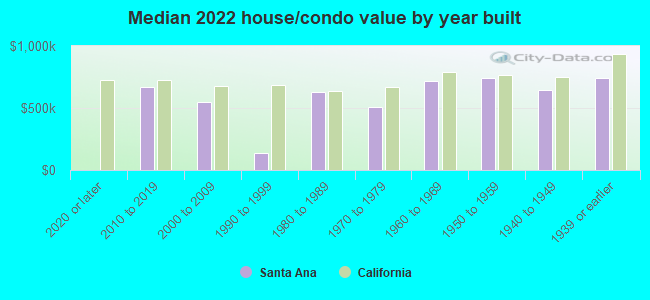
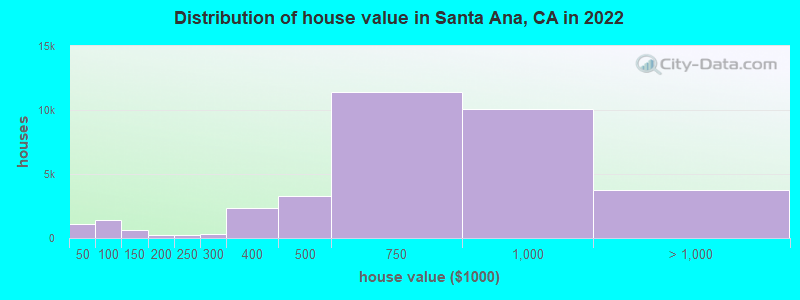
Median price asked for vacant for-sale houses and condos in 2022: $661,437.
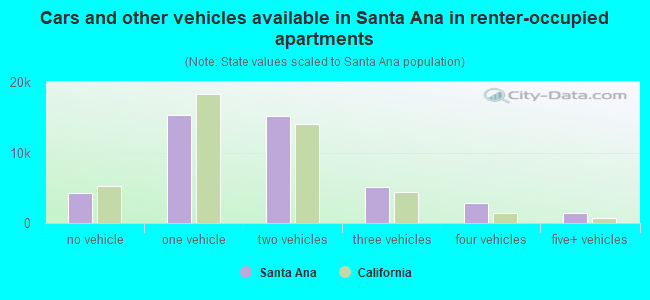
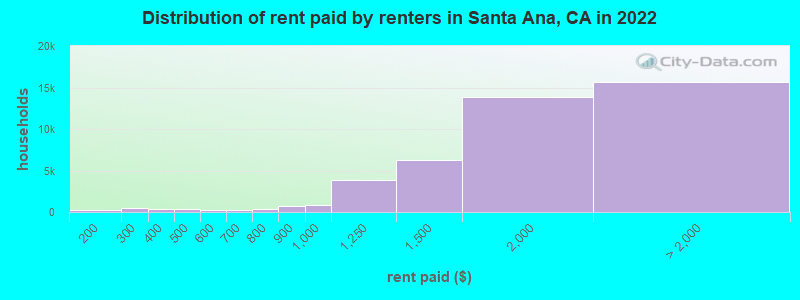
Median contract rent in 2022: $1,800 (lower quartile is $1,383, upper quartile is over $2,000)
Median rent asked for vacant for-rent units in 2022: $2,939
Median gross rent in Santa Ana, CA in 2022: $1,885
Housing units in Santa Ana with a mortgage: 22,541 (725 second mortgage, 0 home equity loan, 642 both second mortgage and home equity loan) Houses without a mortgage: 193
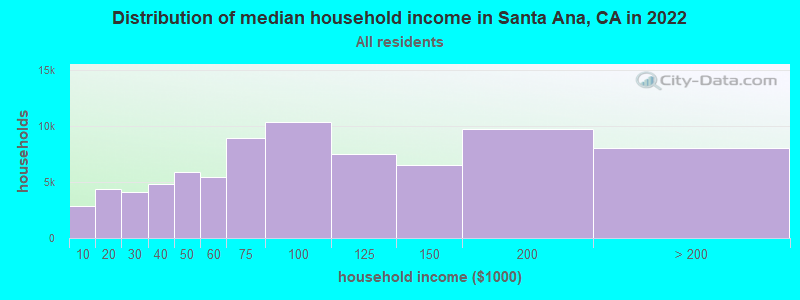
Median household income for houses/condos with a mortgage: $112,404
Median household income for apartments without a mortgage: $103,120
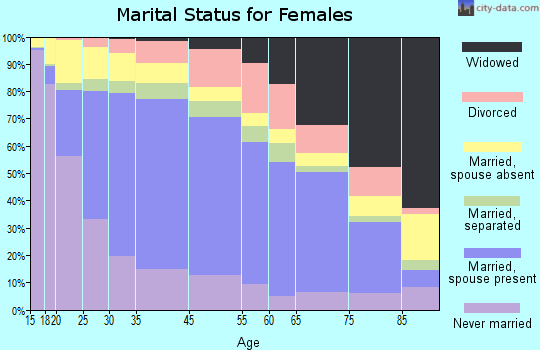
35,178 married couples with children.
17,049 single-parent households (4,918 men, 12,131 women).
22.9% of residents of Santa Ana speak English at home.
65.7% of residents speak Spanish at home (61% speak English very well, 17% speak English well, 14% speak English not well, 8% don't speak English at all).
1.1% of residents speak other Indo-European language at home (77% speak English very well, 11% speak English well, 8% speak English not well, 5% don't speak English at all).
10.0% of residents speak Asian or Pacific Island language at home (40% speak English very well, 26% speak English well, 26% speak English not well, 8% don't speak English at all).
0.4% of residents speak other language at home (65% speak English very well, 16% speak English well, 13% speak English not well, 6% don't speak English at all).
Foreign born population: 123,133 (40.0%)
(44.2% of them are naturalized citizens)
Percentage of workers working in this county: 92.7% Number of people working at home: 11,347 (7.5% of all workers)
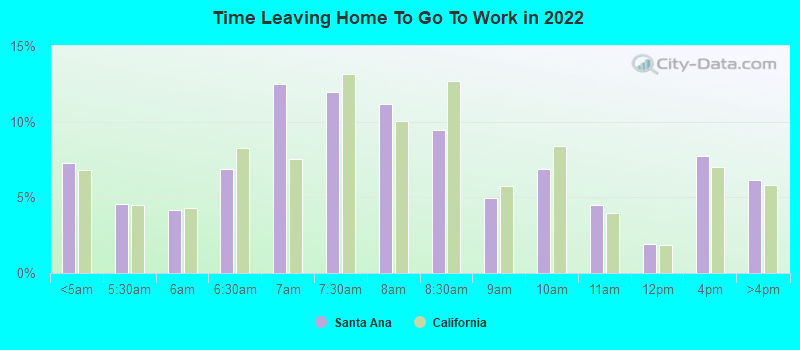
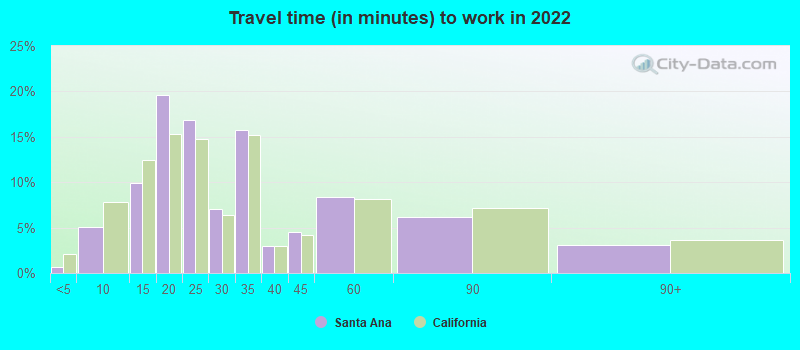
Travel time to work (commute)
Less than 5 minutes: 1,739
5 to 9 minutes: 5,670
10 to 14 minutes: 12,467
15 to 19 minutes: 34,041
20 to 24 minutes: 34,076
25 to 29 minutes: 11,189
30 to 34 minutes: 19,860
35 to 39 minutes: 2,224
40 to 44 minutes: 4,440
45 to 59 minutes: 5,815
60 to 89 minutes: 6,525
90 or more minutes: 2,156
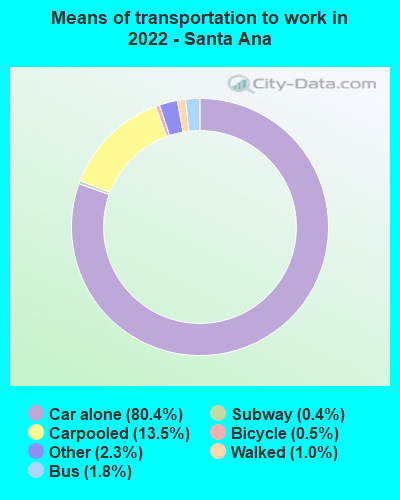
Means of transportation to work:
Drove a car alone: 111,864 (74.4%)
Carpooled: 18,768 (12.5%)
Bus: 2,553 (1.7%)
Subway or elevated rail: 83 (0.1%)
Long-distance train or commuter rail: 592 (0.4%)
Taxi: 3,134 (2.1%)
Bicycle: 709 (0.5%)
Walked: 1,383 (0.9%)
Worked at home: 11,347 (7.5%)
Unemployment by race in 2022
Unemployment rate for White non-Hispanic residents
1.6%Males
4.2%Females
Unemployment rate for Black residents
19.5%Males
2.2%Females
Unemployment rate for American Indian and Alaska Native residents
5.6%Males
3.8%Females
Unemployment rate for Asian residents
7.7%Males
3.7%Females
Unemployment rate for other race residents
4.4%Males
4.0%Females
Unemployment rate for two or more race residents
4.2%Males
9.0%Females
Unemployment rate for Hispanic or Latino residents
4.1%Males
5.0%Females
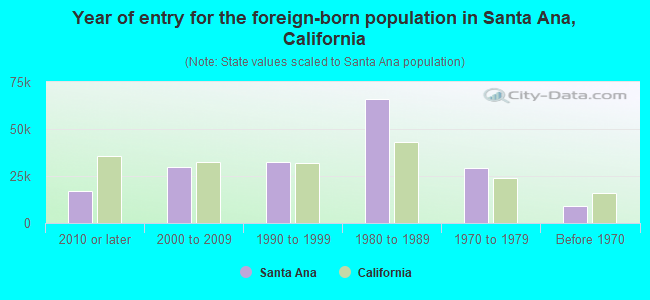
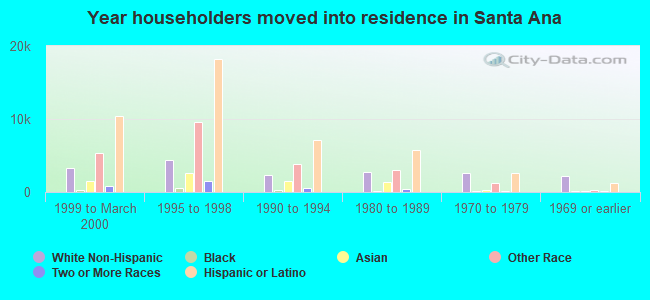
Year of entry for the foreign-born population in Santa Ana, California
17,0192010 or later
29,6572000 to 2009
32,2171990 to 1999
65,9881980 to 1989
29,1461970 to 1979
9,027Before 1970
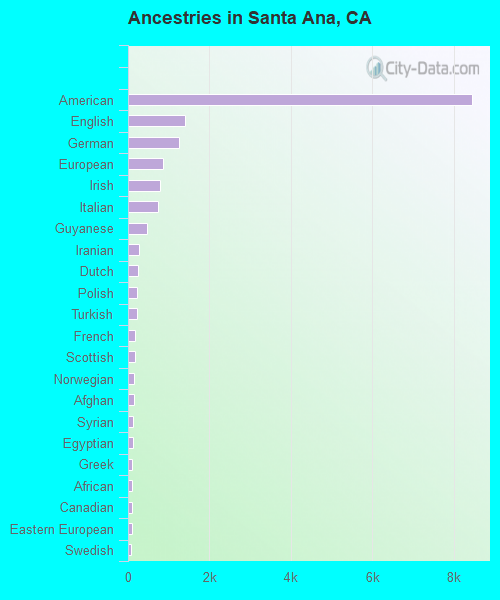
First ancestries reported:
American: 8,450 (4.4%)
English: 1,408 (0.7%)
German: 1,244 (0.7%)
European: 849 (0.4%)
Irish: 794 (0.4%)
Italian: 736 (0.4%)
Guyanese: 465 (0.2%)
Iranian: 276 (0.1%)
Dutch: 257 (0.1%)
Polish: 220 (0.1%)
Turkish: 213 (0.1%)
French: 176 (0.09%)
Scottish: 162 (0.09%)
Norwegian: 145 (0.08%)
Afghan: 140 (0.07%)
Syrian: 132 (0.07%)
Egyptian: 116 (0.06%)
Greek: 100 (0.05%)
African: 97 (0.05%)
Canadian: 88 (0.05%)
Eastern European: 87 (0.05%)
Swedish: 77 (0.04%)
Ethiopian: 75 (0.04%)
Scandinavian: 72 (0.04%)
Lithuanian: 71 (0.04%)
Russian: 55 (0.03%)
Hungarian: 53 (0.03%)
British: 51 (0.03%)
Ukrainian: 51 (0.03%)
Lebanese: 47 (0.02%)
Welsh: 45 (0.02%)
French Canadian: 39 (0.02%)
Nigerian: 39 (0.02%)
Scotch-Irish: 33 (0.02%)
Croatian: 31 (0.02%)
Arab: 28 (0.01%)
Finnish: 27 (0.01%)
Swiss: 27 (0.01%)
Australian: 25 (0.01%)
Moroccan: 25 (0.01%)
Serbian: 23 (0.01%)
South African: 21 (0.01%)
Barbadian: 20 (0.01%)
Northern European: 15 (0.01%)
Romanian: 14 (0.01%)
Danish: 14 (0.01%)
Yugoslavian: 11 (0.01%)
Czech: 10 (0.01%)
Most common places of birth for foreign-born residents (%):
Mexico
Santa Ana:
69.6% (90,141)
California:
37.2% (3,881,193)
Vietnam
Santa Ana:
13.3% (17,181)
California:
4.9% (512,335)
El Salvador
Santa Ana:
2.9% (3,727)
California:
4.2% (440,287)
Guatemala
Santa Ana:
2.3% (2,988)
California:
2.8% (290,436)
Philippines
Santa Ana:
1.7% (2,156)
California:
7.8% (818,297)
Place of birth for U.S.-born residents:
This state: 166,910
Other state: 13,793
Northeast: 3,855
Midwest: 3,457
South: 3,377
West: 3,104
91.8% of Santa Ana residents lived in the same house 1 years ago. Out of people who lived in different houses, 40.8% lived in this county. Out of people who lived in different counties, 82.0% lived in California.
Santa Ana:
91.8%
State average:
88.9%
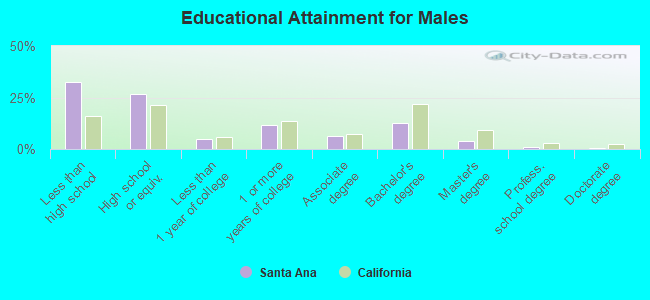
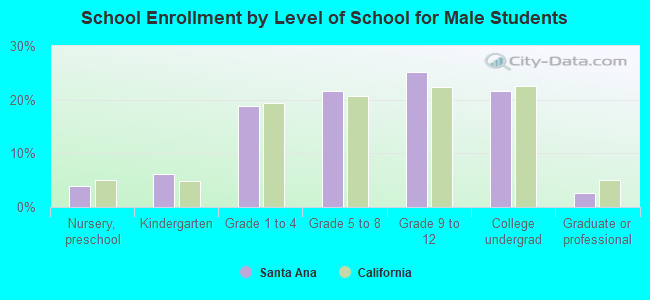
Education attainment for males 25 years and older:
No schooling: 7,271
Nursery to 4th grade: 3,526
5th and 6th grade: 5,288
7th and 8th grade: 3,041
9th grade: 2,398
10th grade: 3,333
11th grade: 2,015
12th grade, no diploma: 6,054
High school graduate (or equivalency): 26,979
Less than 1 year of college: 5,021
Some college more than 1 year, no degree: 11,739
Associate degree: 6,267
Bachelor's degree: 12,555
Master's degree: 4,087
Professional school degree: 948
Doctorate degree: 540
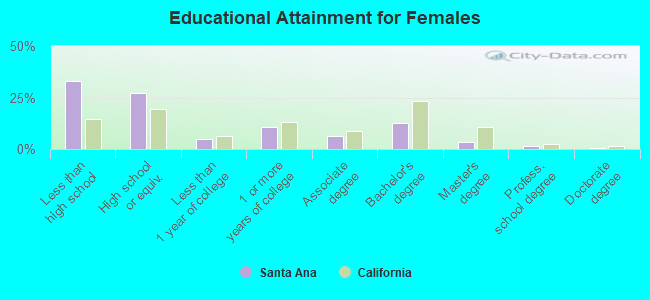
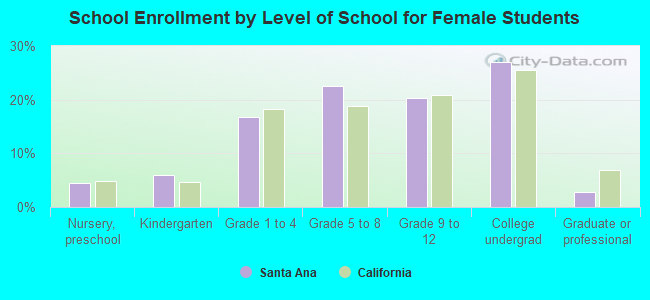
Education attainment for females 25 years and older:
No schooling: 7,748
Nursery to 4th grade: 3,837
5th and 6th grade: 6,714
7th and 8th grade: 2,256
9th grade: 3,060
10th grade: 2,644
11th grade: 1,003
12th grade, no diploma: 5,028
High school graduate (or equivalency): 26,392
Less than 1 year of college: 4,735
Some college more than 1 year, no degree: 10,385
Associate degree: 6,293
Bachelor's degree: 12,141
Master's degree: 3,407
Professional school degree: 1,198
Doctorate degree: 434
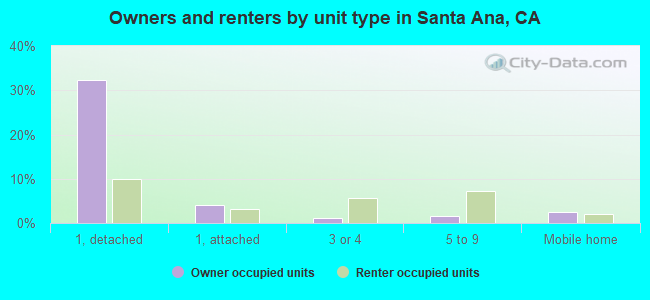
Housing units in structures:
One, detached: 34,745
One, attached: 6,404
Two: 3,596
3 or 4: 5,909
5 to 9: 7,168
10 to 19: 6,573
20 to 49: 5,067
50 or more: 9,129
Mobile homes: 3,754
Boats, RVs, vans, etc.: 50
Median worth of mobile homes: $117,200
Housing units lacking complete plumbing facilities in 2022: 1.1%
Housing units lacking complete kitchen facilities in 2022: 3.2%
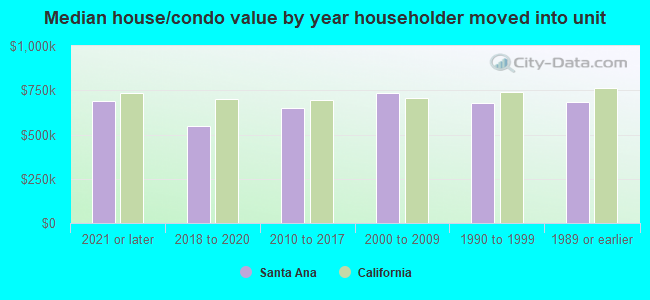
House/condo owner moved in on average 17 years ago