Sanibel, FL (Florida) Houses and Residents
| Sanibel: | $1,049,166 |
| Florida: | $354,100 |
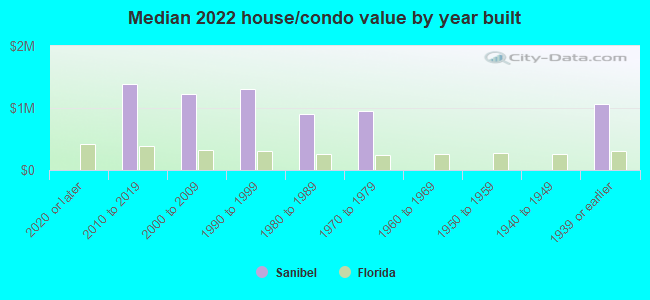
Mean price in 2022:
Detached houses: $1,242,090
Here: $1,242,090 State: $500,941 Townhouses or other attached units: $844,254
Here: $844,254 State: $370,869 In 2-unit structures: $716,344
Here: $716,344 State: $423,188 In 3-to-4-unit structures: $944,231
Here: $944,231 State: $309,944 In 5-or-more-unit structures: $1,049,422
Here: $1,049,422 State: $447,145 Mobile homes: $214,208
Here: $214,208 State: $113,202
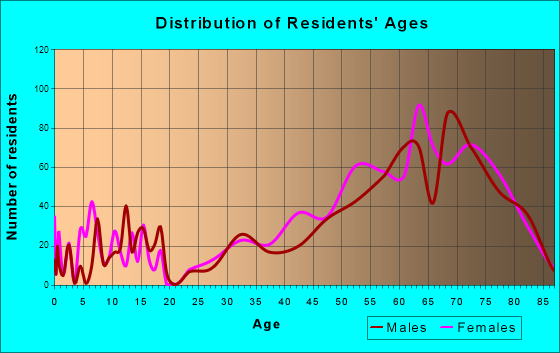
Total population: 7,056 (Urban population: 3,929, Rural population: 2,113 (all nonfarm))
Houses: 8,922 (3,675 occupied: 3,413 owner occupied, 390 renter occupied)
| % of renters here: | 10% |
| State: | 33% |
Housing density: 519 houses/condos per square mile
Median price asked for vacant for-sale houses and condos in 2022: $1,835,692.
Median contract rent in 2022: $906
Median rent asked for vacant for-rent units in 2022: $3,924
Median gross rent in Sanibel, FL in 2022: $1,108
Housing units in Sanibel with a mortgage: 1,469 (168 second mortgage, 79 home equity loan, 103 both second mortgage and home equity loan)
Houses without a mortgage: 15
Median household income for houses/condos with a mortgage: $122,516
Median household income for apartments without a mortgage: $134,083
Median monthly housing costs: $2,192
Compare current foreclosures near Sanibel, FL:
| Photo | Address | Area | Beds / Baths | Price | Details |
|---|---|---|---|---|---|

|
#1
SW 40th Ter
Cape Coral, FL 33914
|
1,975 sq. feet
|
2 baths 3 beds |
$509,600
|
show details |

|
#2
Greendale Pl
Cape Coral, FL 33991
|
1,509 sq. feet
|
2 baths 3 beds |
$380,000
|
show details |

|
#3
NE 9th Ct
Cape Coral, FL 33909
|
2,196 sq. feet
|
2 baths 4 beds |
show details | |

|
#4
SE 15th Ter
Cape Coral, FL 33990
|
1,710 sq. feet
|
2 baths 3 beds |
show details | |

|
#5
SE 26th Ter
Cape Coral, FL 33904
|
1,625 sq. feet
|
2 baths 3 beds |
show details | |

|
#6
SE 16th St
Cape Coral, FL 33990
|
1,462 sq. feet
|
2 baths 3 beds |
show details | |

|
#7
Wilshire Dr
Fort Myers, FL 33919
|
1,527 sq. feet
|
2 baths 3 beds |
show details | |

|
#8
Whiskey Creek Dr Apt 704
Fort Myers, FL 33919
|
1,132 sq. feet
|
2 baths 2 beds |
show details | |

|
#9
SE 17th St
Cape Coral, FL 33990
|
1,472 sq. feet
|
2 baths 3 beds |
show details | |

|
#10
SW 3rd St
Cape Coral, FL 33991
|
1,422 sq. feet
|
2 baths 3 beds |
show details |
| Photo | Address | Area | Beds / Baths | Price | Details |
|---|---|---|---|---|---|

|
#11
SE 8th Pl
Cape Coral, FL 33990
|
1,216 sq. feet
|
2 baths 3 beds |
show details | |

|
#12
Pine Valley Dr Apt 207
Fort Myers, FL 33907
|
700 sq. feet
|
1 baths 1 beds |
show details | |

|
#13
SW 7th Ave
Cape Coral, FL 33991
|
1,712 sq. feet
|
2 baths 4 beds |
show details | |

|
#14
SE 15th Ave
Cape Coral, FL 33990
|
1,554 sq. feet
|
2 baths 3 beds |
show details | |

|
#15
Ceitus Pkwy
Cape Coral, FL 33991
|
2,869 sq. feet
|
4 baths 4 beds |
show details | |

|
#16
Chablis Ln
Fort Myers, FL 33919
|
2,343 sq. feet
|
3 baths 3 beds |
show details | |

|
#17
Grove Ave
Bokeelia, FL 33922
|
1,192 sq. feet
|
2 baths 3 beds |
show details | |

|
#18
SW 3rd Ter
Cape Coral, FL 33991
|
2,253 sq. feet
|
3 baths 4 beds |
show details | |

|
#19
SW 4th Ln
Cape Coral, FL 33991
|
2,016 sq. feet
|
2 baths 3 beds |
show details | |

|
#20
SW Santa Barbara Pl
Cape Coral, FL 33991
|
2,277 sq. feet
|
2 baths 3 beds |
show details |
| Photo | Address | Area | Beds / Baths | Price | Details |
|---|---|---|---|---|---|

|
#21
SW 1st St
Cape Coral, FL 33991
|
1,754 sq. feet
|
2 baths 4 beds |
show details | |

|
#22
Park Meadows Dr Apt 1
Fort Myers, FL 33907
|
1,722 sq. feet
|
2 baths 3 beds |
show details | |

|
#23
Andover St
Fort Myers, FL 33907
|
1,376 sq. feet
|
2 baths 2 beds |
show details | |

|
#24
Beacon St
Fort Myers, FL 33907
|
1,547 sq. feet
|
2 baths 3 beds |
show details | |

|
#25
SE 5th Ave
Cape Coral, FL 33990
|
1,852 sq. feet
|
2 baths 3 beds |
show details | |

|
#26
Fuchsia Rd
Fort Myers, FL 33967
|
1,688 sq. feet
|
2 baths 3 beds |
show details | |

|
#27
SE 19th Ln
Cape Coral, FL 33990
|
1,506 sq. feet
|
2 baths 3 beds |
show details | |

|
#28
SE 23rd St
Cape Coral, FL 33990
|
1,212 sq. feet
|
2 baths 3 beds |
show details | |

|
#29
Owlclover St
Fort Myers, FL 33919
|
1,457 sq. feet
|
2 baths 3 beds |
show details | |

|
#30
Lennex Ln
Fort Myers, FL 33919
|
888 sq. feet
|
2 baths 2 beds |
show details |
| Photo | Address | Area | Beds / Baths | Price | Details |
|---|---|---|---|---|---|

|
#31
SE 29th Ter
Cape Coral, FL 33904
|
2,464 sq. feet
|
2 baths 3 beds |
show details | |

|
#32
SE 25th Ter
Cape Coral, FL 33904
|
1,363 sq. feet
|
2 baths 3 beds |
show details | |

|
#33
Bethany Ct N
Fort Myers, FL 33919
|
1,510 sq. feet
|
2 baths 3 beds |
show details | |

|
#34
SW 15th Ter
Cape Coral, FL 33991
|
1,663 sq. feet
|
2 baths 4 beds |
show details | |

|
#35
SE 29th St
Cape Coral, FL 33904
|
1,162 sq. feet
|
2 baths 3 beds |
show details | |

|
#36
SE 8th Ave
Cape Coral, FL 33904
|
1,922 sq. feet
|
2 baths 3 beds |
show details | |

|
#37
Candlewood Dr
Fort Myers, FL 33919
|
1,544 sq. feet
|
2 baths 3 beds |
show details | |

|
#38
Colby Dr Apt 2205
Fort Myers, FL 33919
|
1,092 sq. feet
|
2 baths 2 beds |
show details | |

|
#39
SE 17th Pl
Cape Coral, FL 33904
|
1,733 sq. feet
|
2 baths 4 beds |
show details | |

|
#40
Astarias Cir
Fort Myers, FL 33919
|
1,903 sq. feet
|
2 baths 3 beds |
show details |
| Photo | Address | Area | Beds / Baths | Price | Details |
|---|---|---|---|---|---|

|
#41
SE 21st Ter
Cape Coral, FL 33990
|
2,123 sq. feet
|
2 baths 4 beds |
show details | |

|
#42
N Flossmoor Rd
Fort Myers, FL 33919
|
1,409 sq. feet
|
2 baths 3 beds |
show details | |

|
#43
SE 8th Pl
Cape Coral, FL 33990
|
1,212 sq. feet
|
2 baths 3 beds |
show details | |

|
#44
Reflection Lakes Dr
Fort Myers, FL 33907
|
2,770 sq. feet
|
3 baths 4 beds |
show details | |

|
#45
SW 14th St
Cape Coral, FL 33991
|
1,719 sq. feet
|
2 baths 3 beds |
show details | |

|
#46
SW 10th Pl
Cape Coral, FL 33991
|
2,251 sq. feet
|
2 baths 3 beds |
show details | |

|
#47
SE 23rd Ter
Cape Coral, FL 33990
|
1,351 sq. feet
|
2 baths 3 beds |
show details | |

|
#48
Penner Ln Apt 6
Fort Myers, FL 33907
|
1,440 sq. feet
|
2 baths 3 beds |
show details | |

|
#49
NW 3rd St
Cape Coral, FL 33993
|
1,670 sq. feet
|
2 baths 3 beds |
show details | |

|
Check over 1 million property listings on Foreclosure.com!
|
browse all offers | |||

Latest news about housing in Sanibel, FL collected exclusively by city-data.com from local newspapers, TV, and radio stations

 | Annual Rentals on Sanibel/Captiva? (1 reply) |
| Visiting Sanibel, How Crowded Is It Right Now (COVID-preocupied) (2 replies) |
| Homes going up or Down in Price? (1403 replies) |
| Concerns buying homes north of Pine Island Rd (51 replies) |
| Cape Coral: Sell your houses and leave (290 replies) |
| Jobs/Economic Profile of Sanibel's Residents (6 replies) |
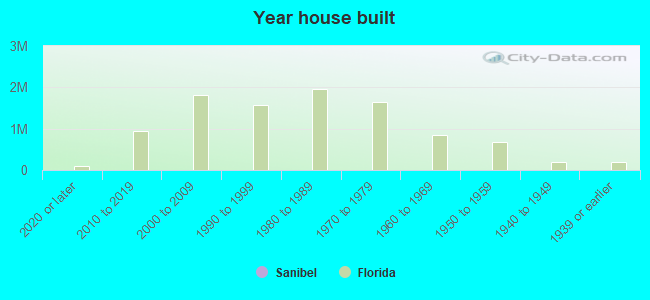
Median year apartment built: 1987
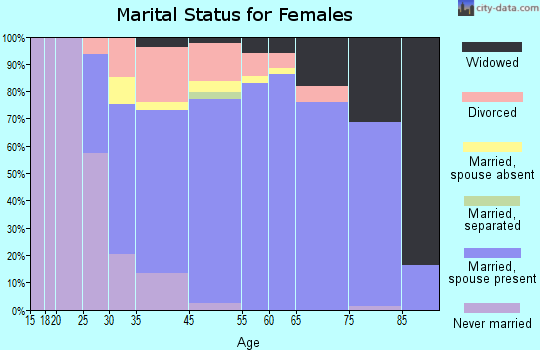
Household type by relationship:
Households: 6,831- Male householders: 1,846 (383 living alone), Female householders: 1,868 (740 living alone)
2,330 spouses (2,311 opposite-sex spouses), 63 unmarried partners, (63 opposite-sex unmarried partners), 387 children (346 natural, 24 adopted, 15 stepchildren), 47 grandchildren, 62 brothers or sisters, 67 parents, 0 foster children, 74 other relatives, 60 non-relatives
- In group quarters: 22
Size of family households: 2,384 2-persons, 214 3-persons, 54 4-persons.
Size of nonfamily households: 1,092 1-person, 82 2-persons.
58 married couples with children.
60 single-parent households (11 men, 49 women).
94.5% of residents of Sanibel speak English at home.
0.9% of residents speak Spanish at home (100% speak English very well).
2.9% of residents speak other Indo-European language at home (70% speak English very well, 25% speak English well, 5% speak English not well).
0.4% of residents speak Asian or Pacific Island language at home (100% speak English well).
0.4% of residents speak other language at home (100% speak English very well).
Foreign born population: 384 (5.6%)
(66.9% of them are naturalized citizens)
| Here: | 5.7 |
| State: | 5.9 |
| Here: | 4.6 |
| State: | 4.2 |
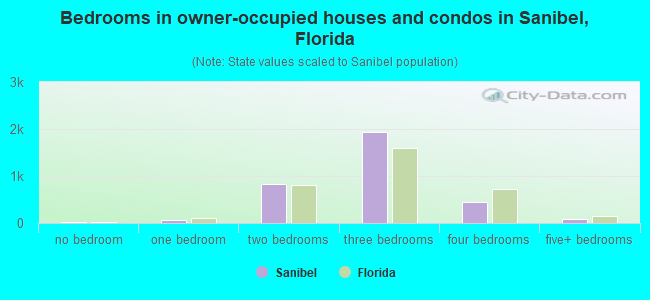
- Bedrooms in owner-occupied houses and condos in Sanibel, Florida
- 16no bedroom
- 731 bedroom
- 8372 bedrooms
- 1,9463 bedrooms
- 4534 bedrooms
- 885+ bedrooms
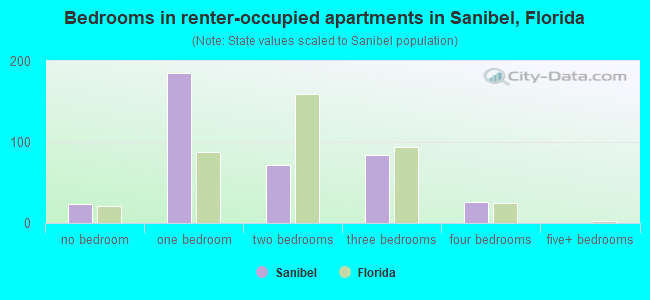
- Bedrooms in renter-occupied apartments in Sanibel, Florida
- 23no bedroom
- 1851 bedroom
- 722 bedrooms
- 843 bedrooms
- 264 bedrooms
- 05+ bedrooms
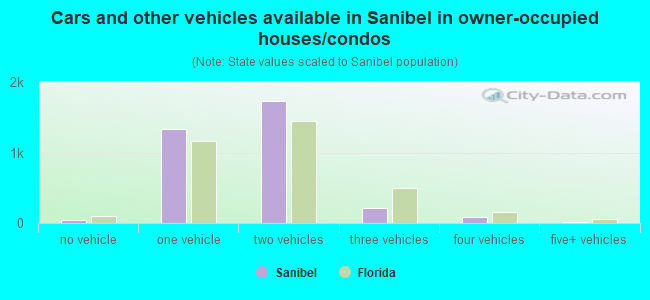
- Cars and other vehicles available in Sanibel in owner-occupied houses/condos
- 37no vehicle
- 1,3381 vehicle
- 1,7342 vehicles
- 2123 vehicles
- 814 vehicles
- 125+ vehicles
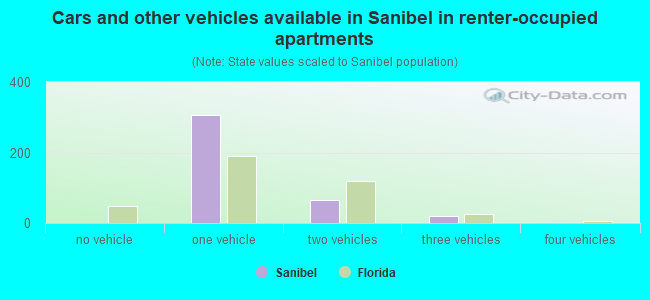
- Cars and other vehicles available in Sanibel in renter-occupied apartments
- 0no vehicle
- 3051 vehicle
- 662 vehicles
- 193 vehicles
- 04 vehicles
- 05+ vehicles
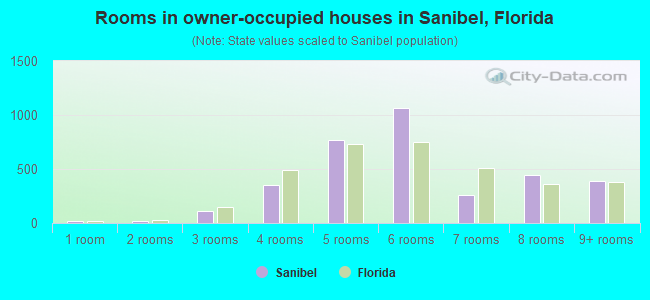
- Rooms in owner-occupied houses in Sanibel, Florida
- 161 room
- 162 rooms
- 1093 rooms
- 3514 rooms
- 7655 rooms
- 1,0626 rooms
- 2637 rooms
- 4418 rooms
- 3909+ rooms
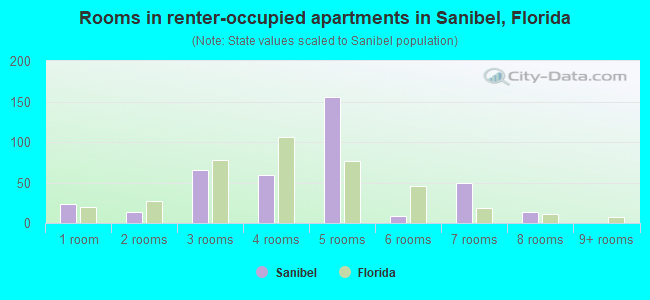
- Rooms in renter-occupied apartments in Sanibel, Florida
- 231 room
- 142 rooms
- 663 rooms
- 594 rooms
- 1555 rooms
- 96 rooms
- 507 rooms
- 148 rooms
- 09+ rooms
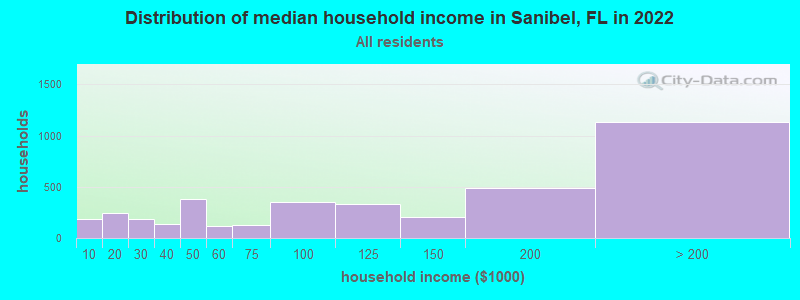
Sanibel, FL household income distribution

- 189Less than $10,000
- 246$10,000 to $19,999
- 183$20,000 to $29,999
- 139$30,000 to $39,999
- 383$40,000 to $49,999
- 114$50,000 to $59,999
- 124$60,000 to $74,999
- 354$75,000 to $99,999
- 333$100,000 to $124,999
- 207$125,000 to $149,999
- 485$150,000 to $199,999
- 1,132$200,000 or more
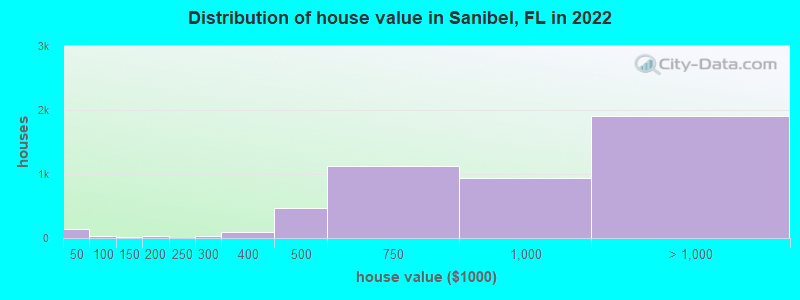
Home value of owner - occupied houses in 2022 in Sanibel, FL
-
- 96Less than $10,000
- 32$10,000 to $14,999
- 3$15,000 to $19,999
- 12$25,000 to $29,999
- 7$50,000 to $59,999
- 11$60,000 to $69,999
- 14$80,000 to $89,999
- 11$100,000 to $124,999
- 3$125,000 to $149,999
- 12$150,000 to $174,999
- 16$175,000 to $199,999
- 34$250,000 to $299,999
- 91$300,000 to $399,999
- 463$400,000 to $499,999
- 1,125$500,000 to $749,999
- 932$750,000 to $999,999
- 1,080$1,000,000 to $1,499,999
- 177$1,500,000 to $1,999,999
- 648$2,000,000 or more
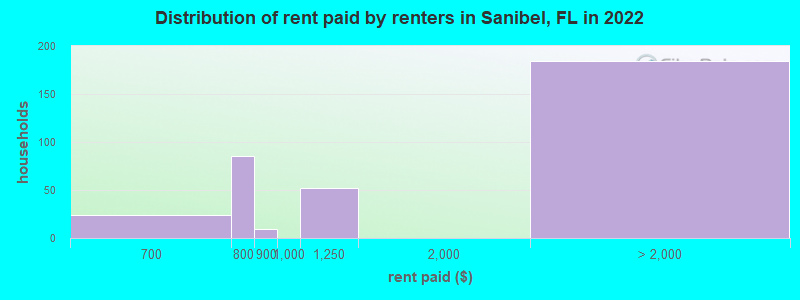
Rent paid by renters in 2022 in Sanibel, FL
-
- 17$600 to $649
- 5$650 to $699
- 73$700 to $749
- 11$750 to $799
- 9$800 to $899
- 51$1,000 to $1,249
- 36$2,500 to $2,999
- 82$3,500 or more
- 64No cash rent
Percentage of workers working in this county: 89.7%
Number of people working at home: 886 (42.4% of all workers)
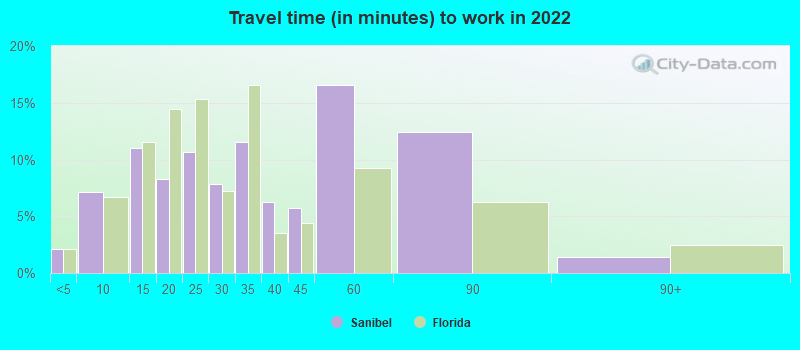
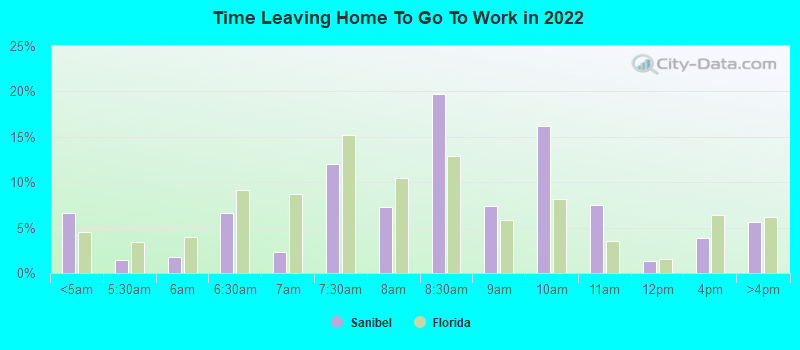
Travel time to work (commute)
- Less than 5 minutes: 76
- 5 to 9 minutes: 326
- 10 to 14 minutes: 249
- 15 to 19 minutes: 215
- 20 to 24 minutes: 124
- 25 to 29 minutes: 39
- 30 to 34 minutes: 61
- 35 to 39 minutes: 33
- 40 to 44 minutes: 21
- 45 to 59 minutes: 100
- 60 to 89 minutes: 82
- 90 or more minutes: 0
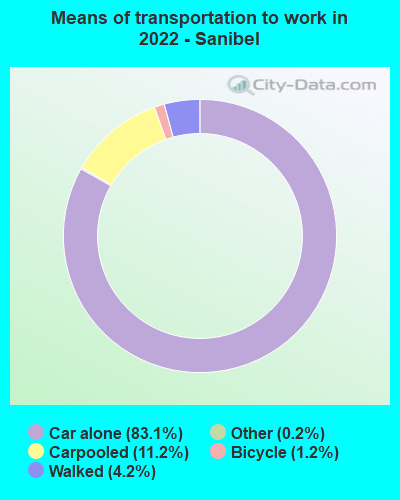
Means of transportation to work:
- Drove a car alone: 3,692 (68.4%)
- Carpooled: 606 (11.2%)
- Bus: 5 (0.1%)
- Taxi: 6 (0.1%)
- Bicycle: 32 (0.6%)
- Walked: 200 (3.7%)
- Worked at home: 886 (16.4%)
- Unemployment by race in 2022
- Unemployment rate for White non-Hispanic residents
- 3.6%Males
- 3.1%Females
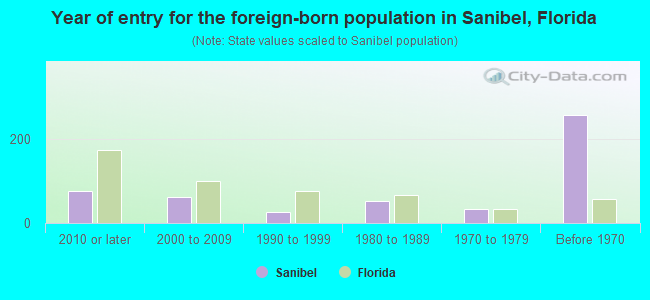
- Year of entry for the foreign-born population in Sanibel, Florida
- 762010 or later
- 622000 to 2009
- 271990 to 1999
- 531980 to 1989
- 341970 to 1979
- 256Before 1970
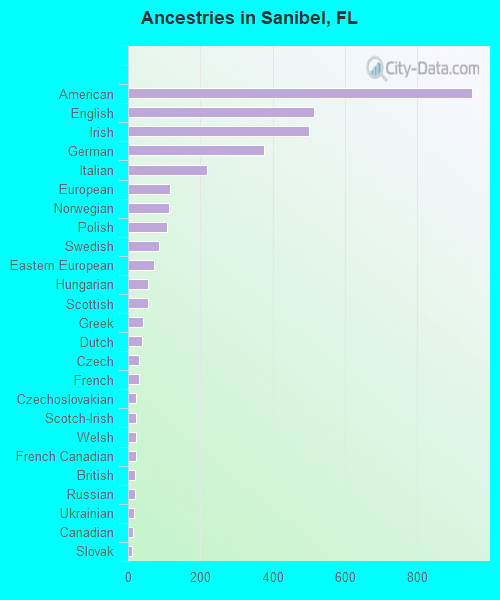
First ancestries reported:
- American: 951 (26.1%)
- English: 514 (14.1%)
- Irish: 501 (13.7%)
- German: 375 (10.3%)
- Italian: 218 (6.0%)
- European: 117 (3.2%)
- Norwegian: 114 (3.1%)
- Polish: 107 (2.9%)
- Swedish: 85 (2.3%)
- Eastern European: 71 (1.9%)
- Hungarian: 56 (1.5%)
- Scottish: 54 (1.5%)
- Greek: 41 (1.1%)
- Dutch: 38 (1.0%)
- Czech: 31 (0.9%)
- French: 31 (0.9%)
- Czechoslovakian: 23 (0.6%)
- Scotch-Irish: 23 (0.6%)
- Welsh: 22 (0.6%)
- French Canadian: 21 (0.6%)
- British: 20 (0.5%)
- Russian: 18 (0.5%)
- Ukrainian: 16 (0.4%)
- Canadian: 15 (0.4%)
- Slovak: 12 (0.3%)
- Austrian: 10 (0.3%)
- Lithuanian: 10 (0.3%)
- Swiss: 10 (0.3%)
- Lebanese: 8 (0.2%)
- Danish: 7 (0.2%)
- Scandinavian: 7 (0.2%)
Most common places of birth for foreign-born residents (%):
| Sanibel: | 15.1% (53) |
| Florida: | 2.4% (109,132) |
| Sanibel: | 12.0% (42) |
| Florida: | 0.7% (34,227) |
| Sanibel: | 11.4% (40) |
| Florida: | 1.2% (54,272) |
| Sanibel: | 11.4% (40) |
| Florida: | 0.4% (20,008) |
| Sanibel: | 8.9% (31) |
| Florida: | 0.5% (21,886) |
| Sanibel: | 7.4% (26) |
| Florida: | 6.5% (298,669) |
| Sanibel: | 6.0% (21) |
| Florida: | 1.2% (56,071) |
| Sanibel: | 5.7% (20) |
| Florida: | 0.8% (37,723) |
| Sanibel: | 5.1% (18) |
| Florida: | 2.1% (94,349) |
| Sanibel: | 4.0% (14) |
| Florida: | 0.1% (3,349) |
| Sanibel: | 3.7% (13) |
| Florida: | 0.0% (2,136) |
| Sanibel: | 2.6% (9) |
| Florida: | 3.0% (137,727) |
| Sanibel: | 2.0% (7) |
| Florida: | 0.2% (8,352) |
| Sanibel: | 1.7% (6) |
| Florida: | 0.1% (2,649) |
Place of birth for U.S.-born residents:
- This state: 323
- Other state: 5,940
- Northeast: 1,974
- Midwest: 2,791
- South: 989
- West: 180
88.7% of Sanibel residents lived in the same house 1 years ago.
Out of people who lived in different houses, 16.0% lived in this county.
Out of people who lived in different counties, 14.7% lived in Florida.
| Sanibel: | 88.7% |
| State average: | 86.3% |
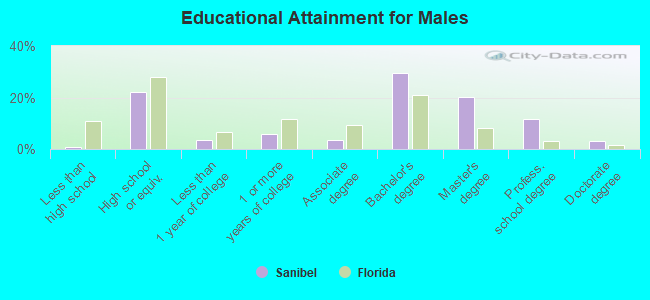
Education attainment for males 25 years and older:
- No schooling: 0
- Nursery to 4th grade: 0
- 5th and 6th grade: 0
- 7th and 8th grade: 0
- 9th grade: 0
- 10th grade: 0
- 11th grade: 28
- 12th grade, no diploma: 0
- High school graduate (or equivalency): 711
- Less than 1 year of college: 109
- Some college more than 1 year, no degree: 188
- Associate degree: 109
- Bachelor's degree: 940
- Master's degree: 647
- Professional school degree: 372
- Doctorate degree: 95
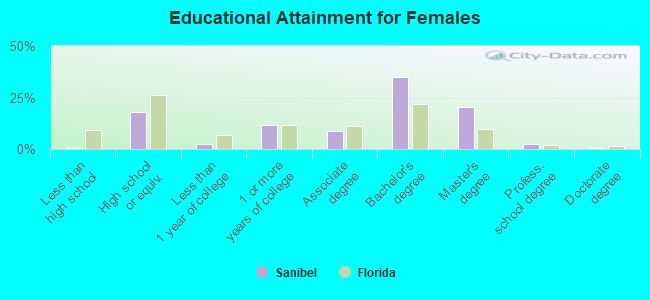
Education attainment for females 25 years and older:
- No schooling: 0
- Nursery to 4th grade: 0
- 5th and 6th grade: 0
- 7th and 8th grade: 0
- 9th grade: 0
- 10th grade: 0
- 11th grade: 0
- 12th grade, no diploma: 12
- High school graduate (or equivalency): 628
- Less than 1 year of college: 83
- Some college more than 1 year, no degree: 403
- Associate degree: 307
- Bachelor's degree: 1,220
- Master's degree: 715
- Professional school degree: 78
- Doctorate degree: 22
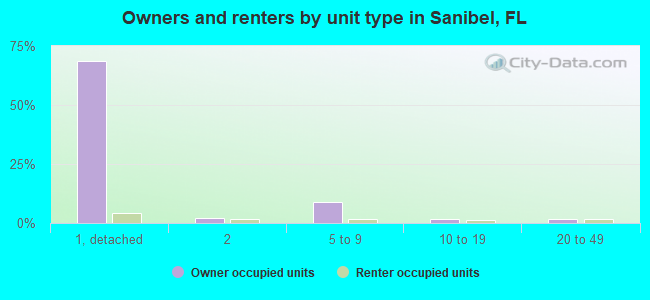
Housing units in structures:
- One, detached: 4,574
- One, attached: 249
- Two: 107
- 3 or 4: 129
- 5 to 9: 509
- 10 to 19: 1,305
- 20 to 49: 1,353
- 50 or more: 425
- Mobile homes: 267
Housing units lacking complete kitchen facilities in 2022: 0.5%
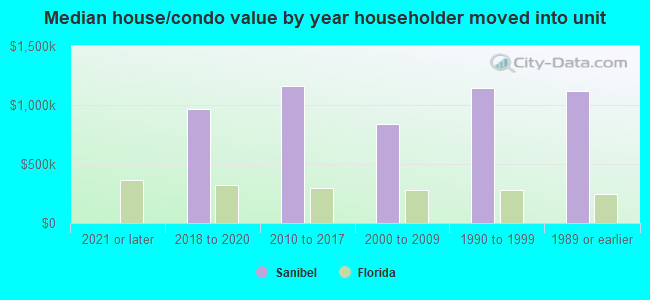
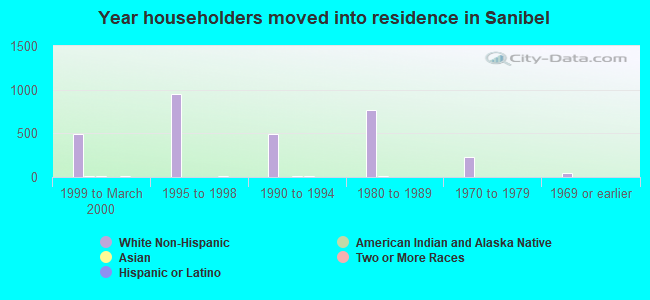
House/condo owner moved in on average 11 years ago
Renter moved in on average 7 years ago
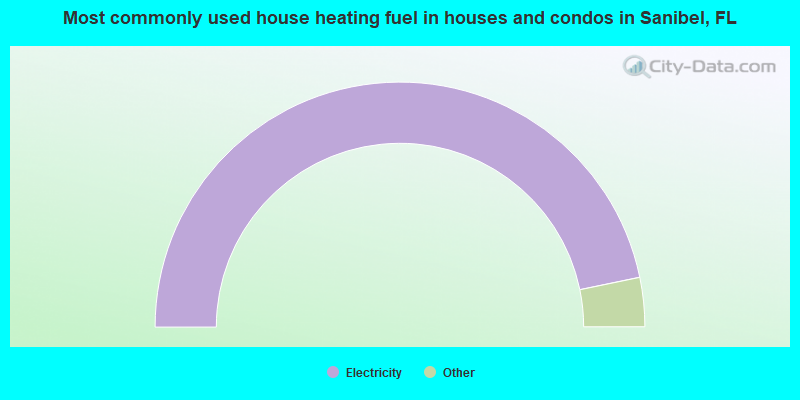
- 93.5%Electricity
- 2.5%Utility gas
- 2.1%Bottled, tank, or LP gas
- 1.9%No fuel used
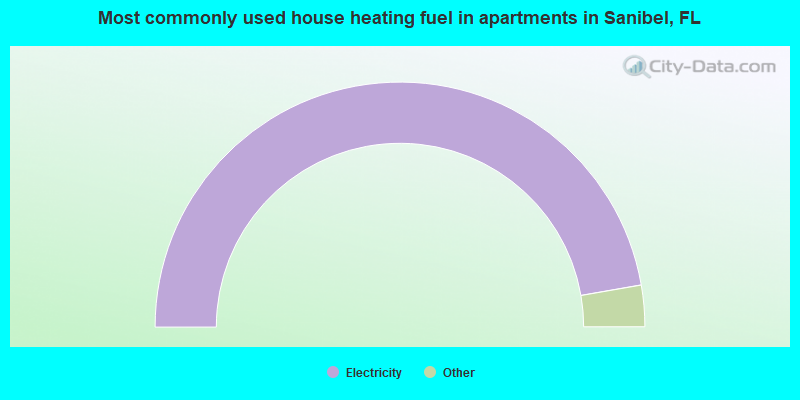
- 94.7%Electricity
- 2.8%Utility gas
- 2.5%Bottled, tank, or LP gas
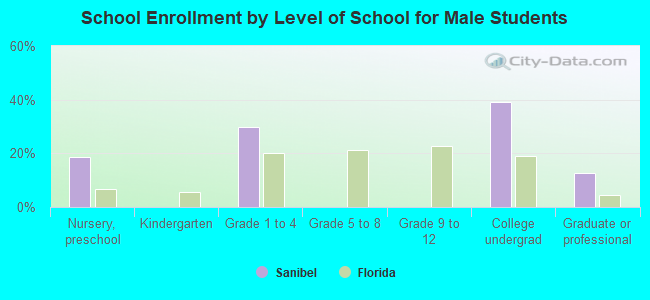
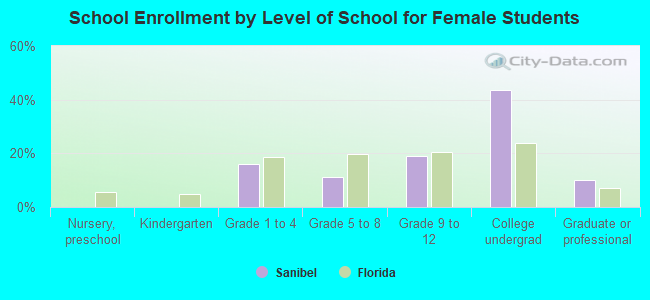
Private vs. public school enrollment:
| Here: | 33.8% |
| Florida: | 15.8% |
| Here: | 0.0% |
| Florida: | 12.9% |
| Here: | 53.5% |
| Florida: | 23.6% |