Housing density: 903 houses/condos per square mile
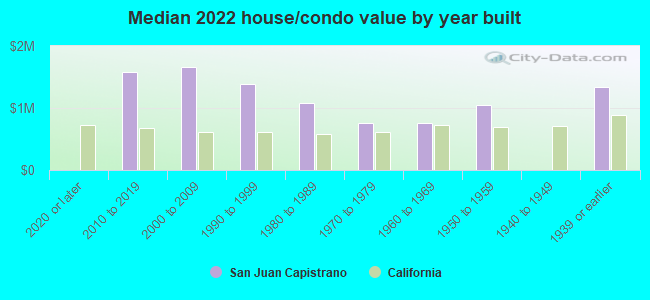
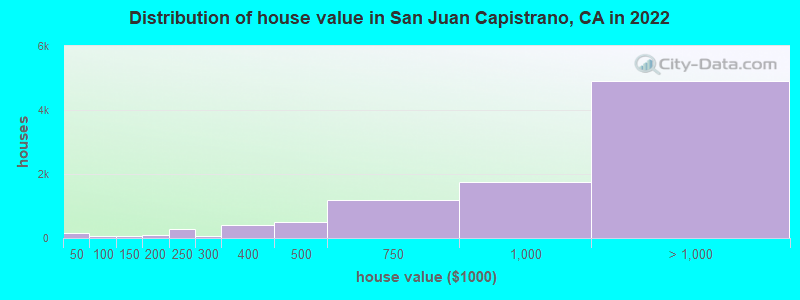
Median price asked for vacant for-sale houses and condos in 2022: $649,070.
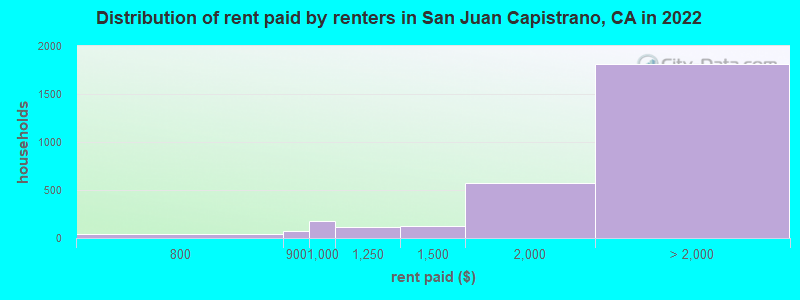
Median contract rent in 2022: over $2,000 (lower quartile is $1,672, upper quartile is over $2,000)
Median rent asked for vacant for-rent units in 2022: $1,570
Median gross rent in San Juan Capistrano, CA in 2022: over $2,000
Housing units in San Juan Capistrano with a mortgage: 5,729 (800 second mortgage, 13 home equity loan, 699 both second mortgage and home equity loan) Houses without a mortgage: 142
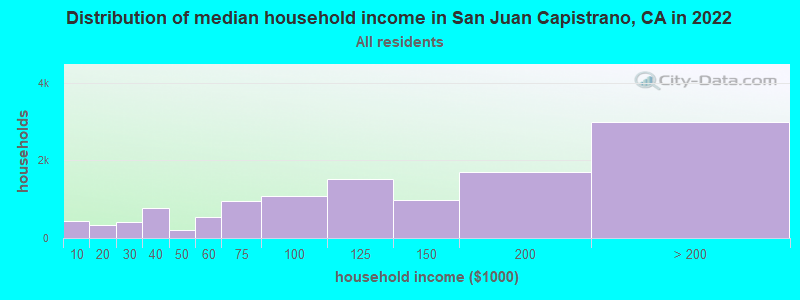
Median household income for houses/condos with a mortgage: $154,726
Median household income for apartments without a mortgage: $109,101
Median monthly housing costs: $2,276
Compare current foreclosures near San Juan Capistrano, CA:
5,708 married couples with children.
584 single-parent households (141 men, 443 women).
62.8% of residents of San Juan Capistrano speak English at home.
32.3% of residents speak Spanish at home (58% speak English very well, 21% speak English well, 15% speak English not well, 7% don't speak English at all).
2.2% of residents speak other Indo-European language at home (75% speak English very well, 20% speak English well, 5% speak English not well).
1.6% of residents speak Asian or Pacific Island language at home (79% speak English very well, 11% speak English well, 7% speak English not well, 3% don't speak English at all).
0.3% of residents speak other language at home (100% speak English very well).
Foreign born population: 7,632 (21.9%)
(51.5% of them are naturalized citizens)
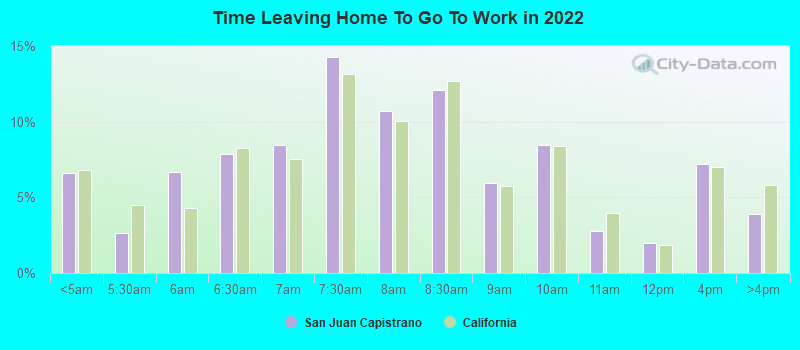
Percentage of workers working in this county: 90.9% Number of people working at home: 2,804 (16.3% of all workers)
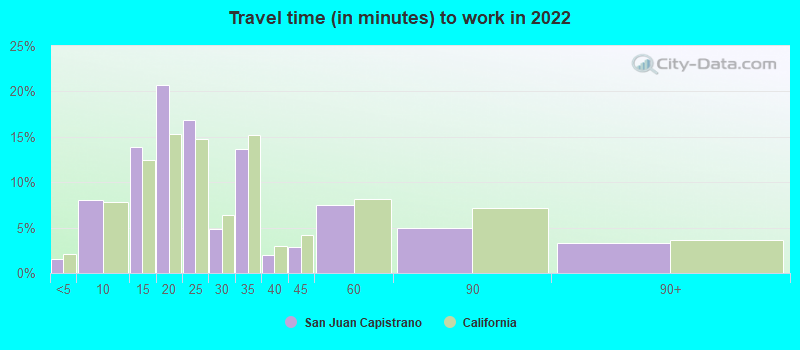
Travel time to work (commute)
Less than 5 minutes: 408
5 to 9 minutes: 1,244
10 to 14 minutes: 1,919
15 to 19 minutes: 2,466
20 to 24 minutes: 2,221
25 to 29 minutes: 1,105
30 to 34 minutes: 1,693
35 to 39 minutes: 153
40 to 44 minutes: 462
45 to 59 minutes: 1,095
60 to 89 minutes: 949
90 or more minutes: 588
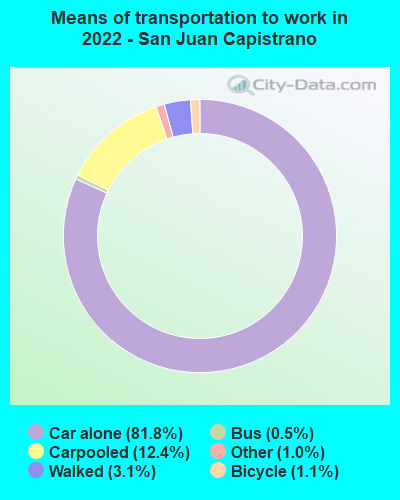
Means of transportation to work:
Drove a car alone: 11,471 (67.5%)
Carpooled: 1,893 (11.1%)
Bus: 64 (0.4%)
Long-distance train or commuter rail: 10 (0.1%)
Taxi: 164 (1.0%)
Bicycle: 162 (1.0%)
Walked: 434 (2.6%)
Worked at home: 2,804 (16.5%)
Unemployment by race in 2022
Unemployment rate for White non-Hispanic residents
3.8%Males
4.3%Females
Unemployment rate for Black residents
1.9%Males
Unemployment rate for American Indian and Alaska Native residents
17.8%Males
Unemployment rate for Asian residents
2.2%Females
Unemployment rate for other race residents
4.7%Females
Unemployment rate for two or more race residents
1.4%Males
1.8%Females
Unemployment rate for Hispanic or Latino residents
0.9%Males
4.6%Females
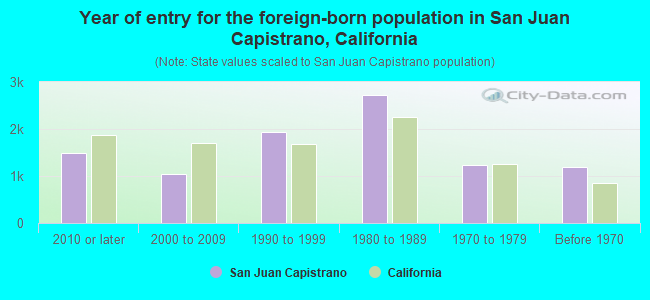
Year of entry for the foreign-born population in San Juan Capistrano, California
1,5002010 or later
1,0522000 to 2009
1,9371990 to 1999
2,7131980 to 1989
1,2321970 to 1979
1,189Before 1970
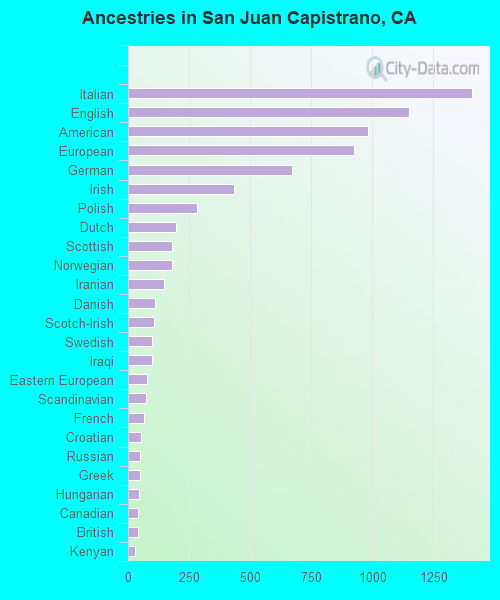
First ancestries reported:
Italian: 1,409 (7.5%)
English: 1,152 (6.1%)
American: 982 (5.2%)
European: 927 (4.9%)
German: 673 (3.6%)
Irish: 435 (2.3%)
Polish: 281 (1.5%)
Dutch: 195 (1.0%)
Scottish: 182 (1.0%)
Norwegian: 182 (1.0%)
Iranian: 146 (0.8%)
Danish: 110 (0.6%)
Scotch-Irish: 105 (0.6%)
Swedish: 100 (0.5%)
Iraqi: 98 (0.5%)
Eastern European: 77 (0.4%)
Scandinavian: 73 (0.4%)
French: 65 (0.3%)
Croatian: 53 (0.3%)
Russian: 50 (0.3%)
Greek: 48 (0.3%)
Hungarian: 44 (0.2%)
Canadian: 42 (0.2%)
British: 40 (0.2%)
Kenyan: 28 (0.1%)
Belgian: 24 (0.1%)
Ukrainian: 24 (0.1%)
Czechoslovakian: 22 (0.1%)
Brazilian: 16 (0.09%)
Jordanian: 13 (0.07%)
French Canadian: 13 (0.07%)
Syrian: 13 (0.07%)
Lithuanian: 11 (0.06%)
Portuguese: 11 (0.06%)
Romanian: 10 (0.05%)
Basque: 10 (0.05%)
Ghanaian: 10 (0.05%)
Northern European: 8 (0.04%)
Czech: 5 (0.03%)
Lebanese: 4 (0.02%)
Most common places of birth for foreign-born residents (%):
Mexico
San Juan Capistrano:
66.6% (5,080)
California:
37.2% (3,881,193)
Canada
San Juan Capistrano:
3.2% (245)
California:
1.2% (127,477)
Philippines
San Juan Capistrano:
2.0% (156)
California:
7.8% (818,297)
Brazil
San Juan Capistrano:
1.9% (143)
California:
0.5% (53,222)
China, excluding Hong Kong and Taiwan
San Juan Capistrano:
1.8% (139)
California:
6.6% (684,672)
Place of birth for U.S.-born residents:
This state: 20,447
Other state: 6,256
Northeast: 2,097
Midwest: 2,030
South: 1,155
West: 975
89.0% of San Juan Capistrano residents lived in the same house 1 years ago. Out of people who lived in different houses, 44.0% lived in this county. Out of people who lived in different counties, 71.3% lived in California.
San Juan Capistrano:
89.0%
State average:
88.9%
Education attainment for males 25 years and older:
No schooling: 1,030
Nursery to 4th grade: 187
5th and 6th grade: 371
7th and 8th grade: 223
9th grade: 106
10th grade: 11
11th grade: 77
12th grade, no diploma: 317
High school graduate (or equivalency): 2,080
Less than 1 year of college: 948
Some college more than 1 year, no degree: 1,169
Associate degree: 820
Bachelor's degree: 2,778
Master's degree: 1,148
Professional school degree: 491
Doctorate degree: 484
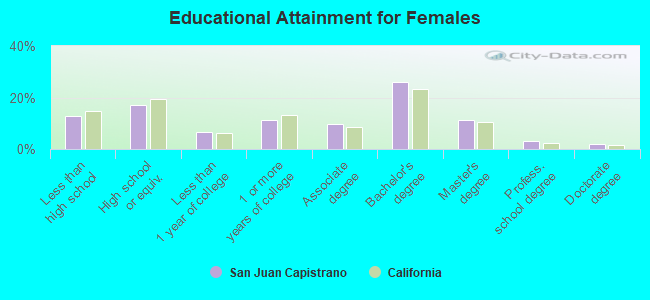
Education attainment for females 25 years and older:
No schooling: 354
Nursery to 4th grade: 197
5th and 6th grade: 258
7th and 8th grade: 238
9th grade: 64
10th grade: 79
11th grade: 69
12th grade, no diploma: 297
High school graduate (or equivalency): 2,104
Less than 1 year of college: 805
Some college more than 1 year, no degree: 1,393
Associate degree: 1,175
Bachelor's degree: 3,203
Master's degree: 1,392
Professional school degree: 397
Doctorate degree: 253
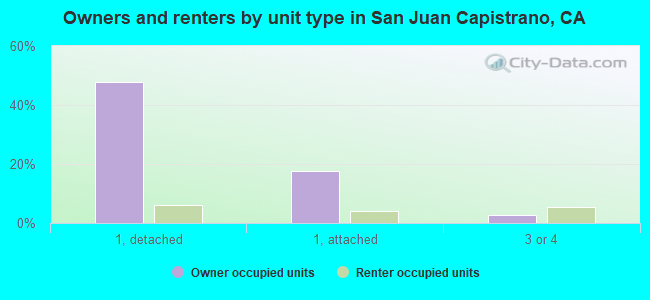
Housing units in structures:
One, detached: 7,305
One, attached: 2,663
Two: 129
3 or 4: 707
5 to 9: 133
10 to 19: 105
20 to 49: 115
50 or more: 463
Mobile homes: 1,199
Median worth of mobile homes: $423,042
Housing units lacking complete kitchen facilities in 2022: 1.9%
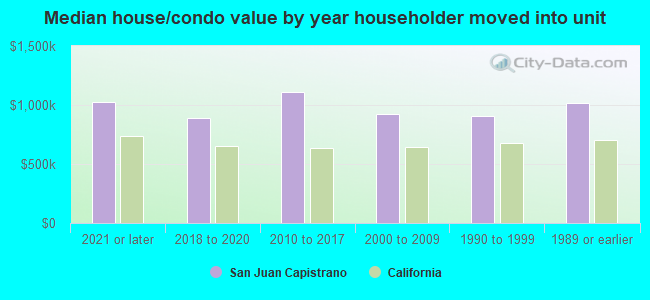
House/condo owner moved in on average 11 years ago