Housing density: 1,973 houses/condos per square mile
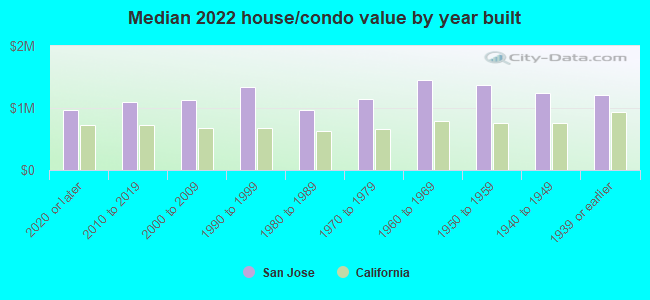
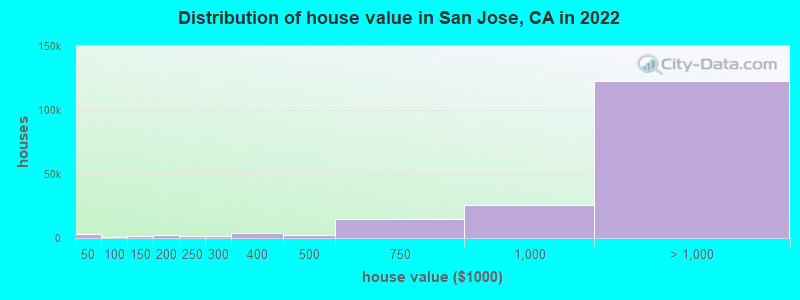
Median price asked for vacant for-sale houses and condos in 2022: $1,018,866.
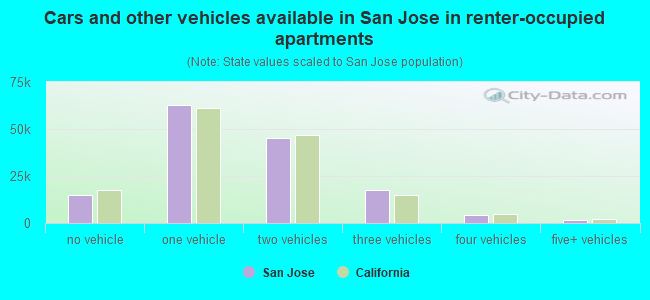
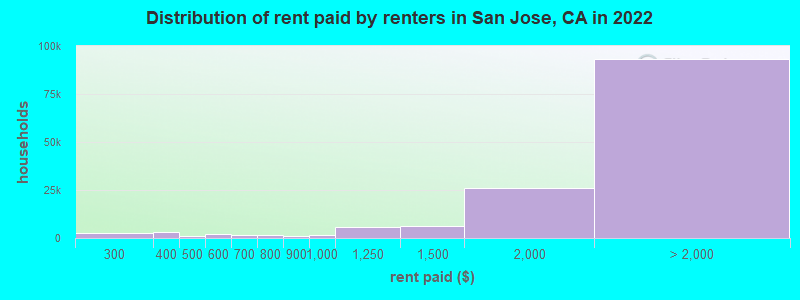
Median contract rent in 2022: over $2,000 (lower quartile is $1,653, upper quartile is over $2,000)
Median rent asked for vacant for-rent units in 2022: $3,233
Median gross rent in San Jose, CA in 2022: over $2,000
Housing units in San Jose with a mortgage: 121,392 (13,339 second mortgage, 265 home equity loan, 11,101 both second mortgage and home equity loan) Houses without a mortgage: 2,314
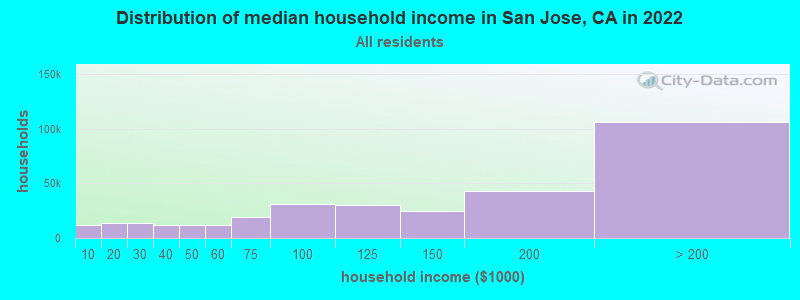
Median household income for houses/condos with a mortgage: $206,740
Median household income for apartments without a mortgage: $119,972
132,659 married couples with children.
41,090 single-parent households (14,218 men, 26,872 women).
41.4% of residents of San Jose speak English at home.
21.8% of residents speak Spanish at home (58% speak English very well, 18% speak English well, 18% speak English not well, 6% don't speak English at all).
8.3% of residents speak other Indo-European language at home (78% speak English very well, 15% speak English well, 6% speak English not well, 1% don't speak English at all).
26.7% of residents speak Asian or Pacific Island language at home (54% speak English very well, 25% speak English well, 17% speak English not well, 4% don't speak English at all).
1.9% of residents speak other language at home (69% speak English very well, 22% speak English well, 5% speak English not well, 3% don't speak English at all).
Foreign born population: 405,716 (41.8%)
(54.9% of them are naturalized citizens)
Percentage of workers working in this county: 89.7% Number of people working at home: 103,141 (20.5% of all workers)
Travel time to work (commute)
Less than 5 minutes: 2,922
5 to 9 minutes: 21,413
10 to 14 minutes: 42,579
15 to 19 minutes: 68,464
20 to 24 minutes: 74,864
25 to 29 minutes: 33,170
30 to 34 minutes: 71,377
35 to 39 minutes: 12,979
40 to 44 minutes: 15,224
45 to 59 minutes: 30,042
60 to 89 minutes: 20,270
90 or more minutes: 7,673
Means of transportation to work:
Drove a car alone: 269,287 (61.2%)
Carpooled: 43,348 (9.8%)
Bus: 5,103 (1.2%)
Subway or elevated rail: 438 (0.1%)
Long-distance train or commuter rail: 982 (0.2%)
Light rail, streetcar or trolley: 1,094 (0.2%)
Taxi: 6,257 (1.4%)
Bicycle: 2,682 (0.6%)
Walked: 8,027 (1.8%)
Worked at home: 103,141 (23.4%)
Unemployment by race in 2022
Unemployment rate for White non-Hispanic residents
3.5%Males
3.6%Females
Unemployment rate for Black residents
3.3%Males
4.3%Females
Unemployment rate for American Indian and Alaska Native residents
9.6%Males
4.7%Females
Unemployment rate for Asian residents
2.8%Males
3.0%Females
Unemployment rate for other race residents
4.7%Males
5.6%Females
Unemployment rate for two or more race residents
2.8%Males
3.6%Females
Unemployment rate for Hispanic or Latino residents
3.9%Males
5.4%Females
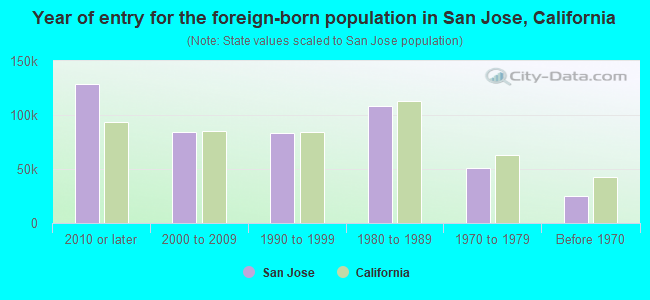
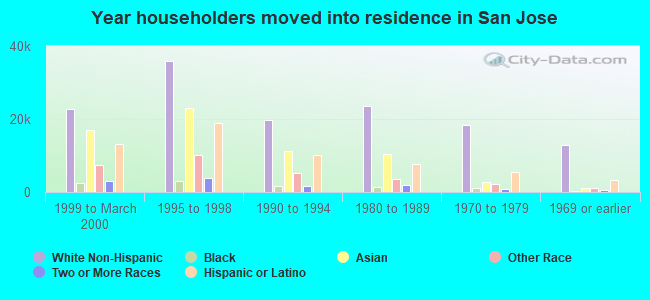
Year of entry for the foreign-born population in San Jose, California
128,4562010 or later
84,4212000 to 2009
83,7521990 to 1999
107,8781980 to 1989
51,3631970 to 1979
25,178Before 1970
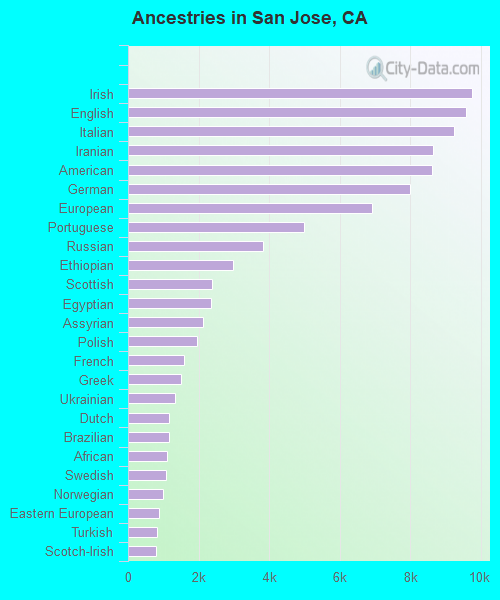
First ancestries reported:
Irish: 9,753 (1.5%)
English: 9,598 (1.5%)
Italian: 9,259 (1.5%)
Iranian: 8,662 (1.4%)
American: 8,628 (1.4%)
German: 7,987 (1.3%)
European: 6,916 (1.1%)
Portuguese: 4,983 (0.8%)
Russian: 3,843 (0.6%)
Ethiopian: 2,973 (0.5%)
Scottish: 2,373 (0.4%)
Egyptian: 2,356 (0.4%)
Assyrian: 2,117 (0.3%)
Polish: 1,948 (0.3%)
French: 1,581 (0.2%)
Greek: 1,512 (0.2%)
Ukrainian: 1,337 (0.2%)
Dutch: 1,157 (0.2%)
Brazilian: 1,149 (0.2%)
African: 1,100 (0.2%)
Swedish: 1,088 (0.2%)
Norwegian: 1,006 (0.2%)
Eastern European: 868 (0.1%)
Turkish: 822 (0.1%)
Scotch-Irish: 806 (0.1%)
Israeli: 764 (0.1%)
Croatian: 701 (0.1%)
Yugoslavian: 697 (0.1%)
Palestinian: 651 (0.1%)
British: 641 (0.1%)
Danish: 617 (0.10%)
Northern European: 547 (0.09%)
French Canadian: 504 (0.08%)
Lebanese: 483 (0.08%)
Afghan: 474 (0.07%)
Armenian: 469 (0.07%)
Hungarian: 440 (0.07%)
Romanian: 427 (0.07%)
Ghanaian: 333 (0.05%)
Jordanian: 329 (0.05%)
Swiss: 319 (0.05%)
Lithuanian: 314 (0.05%)
Nigerian: 307 (0.05%)
Arab: 301 (0.05%)
Welsh: 300 (0.05%)
Canadian: 300 (0.05%)
Scandinavian: 296 (0.05%)
Sierra Leonean: 289 (0.05%)
Serbian: 232 (0.04%)
Iraqi: 218 (0.03%)
Bulgarian: 201 (0.03%)
Kenyan: 192 (0.03%)
Czech: 175 (0.03%)
Finnish: 161 (0.03%)
Basque: 160 (0.03%)
Slavic: 136 (0.02%)
Haitian: 132 (0.02%)
South African: 122 (0.02%)
Australian: 105 (0.02%)
Latvian: 105 (0.02%)
Austrian: 101 (0.02%)
Maltese: 91 (0.01%)
Moroccan: 89 (0.01%)
Slovak: 84 (0.01%)
Czechoslovakian: 80 (0.01%)
Jamaican: 77 (0.01%)
Guyanese: 75 (0.01%)
Belgian: 69 (0.01%)
Somali: 66 (0.01%)
Syrian: 60 (0.01%)
Trinidadian and Tobagonian: 56 (0.01%)
Icelander: 49 (0.01%)
Estonian: 47 (0.01%)
Luxembourger: 32 (0.01%)
Most common places of birth for foreign-born residents (%):
Mexico
San Jose:
21.0% (86,251)
California:
37.2% (3,881,193)
Vietnam
San Jose:
18.3% (75,228)
California:
4.9% (512,335)
India
San Jose:
13.8% (56,969)
California:
5.2% (539,184)
China, excluding Hong Kong and Taiwan
San Jose:
9.0% (36,942)
California:
6.6% (684,672)
Philippines
San Jose:
7.9% (32,694)
California:
7.8% (818,297)
Taiwan
San Jose:
3.5% (14,302)
California:
1.7% (176,274)
Iran
San Jose:
2.6% (10,597)
California:
2.0% (206,004)
Korea
San Jose:
2.6% (10,523)
California:
3.0% (315,248)
Place of birth for U.S.-born residents:
This state: 447,550
Other state: 101,375
Northeast: 28,272
Midwest: 24,661
South: 25,324
West: 23,118
87.2% of San Jose residents lived in the same house 1 years ago. Out of people who lived in different houses, 39.4% lived in this county. Out of people who lived in different counties, 63.7% lived in California.
San Jose:
87.2%
State average:
88.9%
Education attainment for males 25 years and older:
No schooling: 13,693
Nursery to 4th grade: 3,037
5th and 6th grade: 6,611
7th and 8th grade: 3,471
9th grade: 3,728
10th grade: 2,141
11th grade: 4,011
12th grade, no diploma: 10,334
High school graduate (or equivalency): 55,931
Less than 1 year of college: 16,347
Some college more than 1 year, no degree: 35,310
Associate degree: 22,723
Bachelor's degree: 91,261
Master's degree: 55,969
Professional school degree: 7,208
Doctorate degree: 15,426
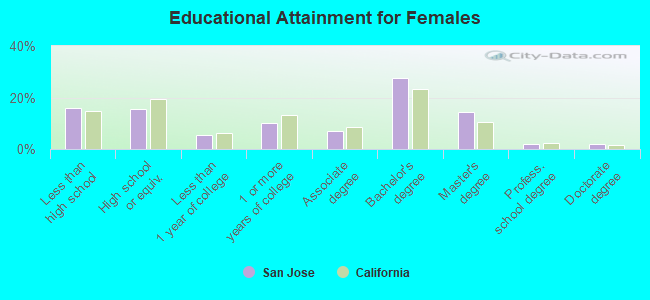
Education attainment for females 25 years and older:
No schooling: 16,450
Nursery to 4th grade: 3,842
5th and 6th grade: 9,237
7th and 8th grade: 4,779
9th grade: 4,504
10th grade: 1,564
11th grade: 3,700
12th grade, no diploma: 9,235
High school graduate (or equivalency): 51,908
Less than 1 year of college: 17,632
Some college more than 1 year, no degree: 33,930
Associate degree: 23,750
Bachelor's degree: 93,045
Master's degree: 48,766
Professional school degree: 6,965
Doctorate degree: 6,823
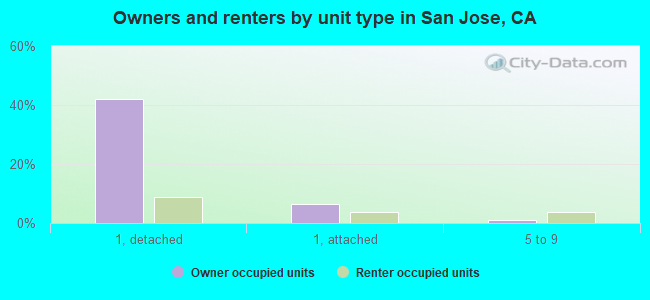
Housing units in structures:
One, detached: 173,160
One, attached: 35,207
Two: 4,576
3 or 4: 19,776
5 to 9: 16,704
10 to 19: 14,989
20 to 49: 17,530
50 or more: 51,637
Mobile homes: 11,064
Boats, RVs, vans, etc.: 352
Median worth of mobile homes: $237,300
Housing units lacking complete plumbing facilities in 2022: 0.2%
Housing units lacking complete kitchen facilities in 2022: 0.8%
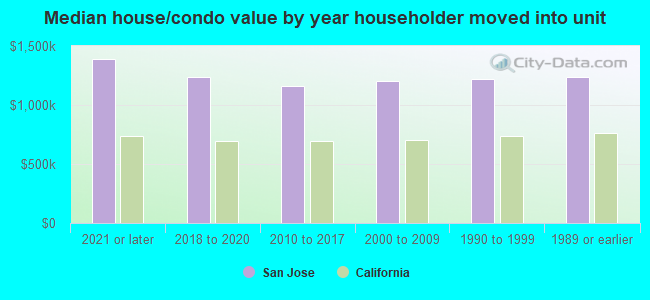
House/condo owner moved in on average 14 years ago