San Gorgonio Pass, CA (California) Houses and Residents
| San Gorgonio Pass: | $400,711 |
| California: | $715,900 |
Total population: 70,591 (Urban population: 46,114, Rural population: 7,419 (32 farm, 7,387 nonfarm))
Houses: 21,837 (19,874 occupied: 14,305 owner occupied, 5,569 renter occupied)
| % of renters here: | 28% |
| State: | 44% |
Housing density: 85 houses/condos per square mile
Median price asked for vacant for-sale houses and condos in 2022 in this county: $550,307.
Median contract rent in 2022: $1,208 (lower quartile is $851, upper quartile is $1,575)
Median rent asked for vacant for-rent units in 2022: $1,038
Median gross rent in San Gorgonio Pass, CA in 2022: $1,439
Housing units in San Gorgonio Pass with a mortgage: 7,120 (1,019 second mortgage, 353 home equity loan, 10 both second mortgage and home equity loan)
Houses without a mortgage: 3,383
Compare current foreclosures near San Gorgonio Pass, CA:
| Photo | Address | Area | Beds / Baths | Price | Details |
|---|---|---|---|---|---|

|
#1
W Jacinto View Rd Apt H
Banning, CA 92220
|
780 sq. feet
|
1 baths 2 beds |
show details | |

|
#2
S La Salle St
Redlands, CA 92374
|
4,335 sq. feet
|
4 baths 5 beds |
show details | |

|
#3
Avenue H # H
Yucaipa, CA 92399
|
1,485 sq. feet
|
2 baths 4 beds |
show details | |

|
#4
Sussex Rd
San Jacinto, CA 92583
|
2,177 sq. feet
|
2 baths 3 beds |
show details | |

|
#5
Brutus Way
Beaumont, CA 92223
|
3,396 sq. feet
|
2 baths 4 beds |
show details | |

|
#6
Tourmaline Ave
Mentone, CA 92359
|
572 sq. feet
|
1 baths 1 beds |
show details | |

|
#7
Coral Ave
Hemet, CA 92543
|
1,034 sq. feet
|
2 baths 2 beds |
show details | |

|
#8
Marilyn Ln
Redlands, CA 92373
|
2,500 sq. feet
|
2 baths 5 beds |
show details | |

|
#9
Groveland St
Beaumont, CA 92223
|
- sq. feet
|
3 baths 4 beds |
show details | |

|
#10
Stovall Way
Yucaipa, CA 92399
|
2,061 sq. feet
|
3 baths 4 beds |
show details |
| Photo | Address | Area | Beds / Baths | Price | Details |
|---|---|---|---|---|---|

|
#11
Duncan Dr
Moreno Valley, CA 92555
|
3,570 sq. feet
|
3 baths 6 beds |
show details | |

|
#12
Felisa Ct
Redlands, CA 92373
|
2,240 sq. feet
|
2 baths 4 beds |
show details | |

|
#13
La Costa Alta Dr
Moreno Valley, CA 92555
|
4,817 sq. feet
|
4 baths 6 beds |
show details | |

|
#14
Ramada Ln
Yucaipa, CA 92399
|
2,661 sq. feet
|
2 baths 5 beds |
show details | |

|
#15
Brookside Ln
Beaumont, CA 92223
|
2,494 sq. feet
|
2 baths 4 beds |
show details | |

|
#16
The Willows Rd
San Jacinto, CA 92583
|
1,354 sq. feet
|
2 baths 4 beds |
show details | |

|
#17
Lomas St
Hemet, CA 92544
|
2,176 sq. feet
|
4 baths 4 beds |
show details | |

|
#18
Windsong Ln
San Jacinto, CA 92582
|
1,662 sq. feet
|
2 baths 4 beds |
show details | |

|
#19
Oradon Way
Hemet, CA 92545
|
883 sq. feet
|
2 baths 2 beds |
show details | |

|
#20
Titus Ct
San Jacinto, CA 92583
|
1,814 sq. feet
|
3 baths 4 beds |
show details |
| Photo | Address | Area | Beds / Baths | Price | Details |
|---|---|---|---|---|---|

|
#21
Long St
Hemet, CA 92543
|
1,464 sq. feet
|
2 baths 2 beds |
show details | |

|
#22
W Westmont Ave
Hemet, CA 92543
|
1,218 sq. feet
|
2 baths 2 beds |
show details | |

|
#23
Plymouth Rock
Beaumont, CA 92223
|
2,243 sq. feet
|
2 baths 3 beds |
show details | |

|
#24
Juniper Flats Rd
Nuevo, CA 92567
|
2,555 sq. feet
|
2 baths 3 beds |
show details | |

|
#25
Snyder Ln
Homeland, CA 92548
|
1,680 sq. feet
|
2 baths 2 beds |
show details | |

|
#26
Brentwood Way
Hemet, CA 92545
|
2,040 sq. feet
|
3 baths 3 beds |
show details | |

|
#27
W Hoffer St
Banning, CA 92220
|
1,470 sq. feet
|
2 baths 3 beds |
show details | |

|
#28
Camino De Oro
San Jacinto, CA 92583
|
1,332 sq. feet
|
2 baths 2 beds |
show details | |

|
#29
E Acacia Ave
Hemet, CA 92543
|
988 sq. feet
|
1 baths 4 beds |
show details | |

|
#30
Shasta St
Yucaipa, CA 92399
|
1,182 sq. feet
|
1 baths 2 beds |
show details |
| Photo | Address | Area | Beds / Baths | Price | Details |
|---|---|---|---|---|---|

|
#31
Manzanillo St
Cabazon, CA 92230
|
1,963 sq. feet
|
2 baths 3 beds |
show details | |

|
#32
Lotus Ave
Yucaipa, CA 92399
|
2,668 sq. feet
|
3 baths 4 beds |
show details | |

|
#33
Cloudstone Ln
Hemet, CA 92545
|
2,462 sq. feet
|
3 baths 5 beds |
show details | |

|
#34
Lincoln Ave
Hemet, CA 92544
|
550 sq. feet
|
1 baths 2 beds |
show details | |

|
#35
Avenue N
Redlands, CA 92373
|
1,313 sq. feet
|
2 baths 3 beds |
show details | |

|
#36
Shadow Ln
Hemet, CA 92544
|
1,985 sq. feet
|
2 baths 3 beds |
show details | |

|
#37
Cortez Dr
Hemet, CA 92545
|
1,166 sq. feet
|
2 baths 2 beds |
show details | |

|
#38
Brewster Dr
Moreno Valley, CA 92555
|
1,940 sq. feet
|
3 baths 4 beds |
show details | |

|
#39
State Highway 74, Spc 14
Hemet, CA 92544
|
960 sq. feet
|
2 baths 2 beds |
show details | |

|
#40
W Oakland Ave Spc 104
Hemet, CA 92543
|
1,344 sq. feet
|
2 baths 3 beds |
show details |
| Photo | Address | Area | Beds / Baths | Price | Details |
|---|---|---|---|---|---|

|
#41
Carnegie Ave
Hemet, CA 92544
|
1,975 sq. feet
|
2 baths 3 beds |
show details | |

|
#42
Syracuse Ct
Hemet, CA 92544
|
1,797 sq. feet
|
2 baths 4 beds |
show details | |

|
#43
Juniper Flats Rd
Nuevo, CA 92567
|
2,555 sq. feet
|
4 baths 3 beds |
show details | |

|
#44
E Mayberry Ave
Hemet, CA 92543
|
1,276 sq. feet
|
2 baths 2 beds |
show details | |

|
#45
Tennessee St
Yucaipa, CA 92399
|
2,019 sq. feet
|
2 baths 3 beds |
show details | |

|
#46
Boyer Ave
Hemet, CA 92544
|
1,027 sq. feet
|
1 baths 2 beds |
show details | |

|
#47
Griffith Way
Hemet, CA 92543
|
912 sq. feet
|
1 baths 3 beds |
show details | |

|
#48
Griffith Way
Hemet, CA 92543
|
1,002 sq. feet
|
1 baths 3 beds |
show details | |

|
#49
Maryvale Ln
Hemet, CA 92544
|
1,037 sq. feet
|
1 baths 2 beds |
show details | |

|
Check over 1 million property listings on Foreclosure.com!
|
browse all offers | |||

Household type by relationship:
Households: 2,153,812- In family households: 1,916,707 (357,691 male householders, 152,550 female householders)
376,381 spouses, 728,028 children (675,451 natural, 15,499 adopted, 37,078 stepchildren), 69,455 grandchildren, 34,232 brothers or sisters, 33,896 parents, foster children, 57,727 other relatives, 76,462 non-relatives
- In nonfamily households: 237,105 (84,686 male householders (58,397 living alone)), 91,333 female householders (74,097 living alone)), 61,086 nonrelatives
- In group quarters: 35,829 (20,862 institutionalized population)
308,692 married couples with children.
98,911 single-parent households (26,262 men, 72,649 women).
77.2% of residents of San Gorgonio Pass speak English at home.
18.2% of residents speak Spanish at home (55% speak English very well, 21% speak English well, 16% speak English not well, 8% don't speak English at all).
1.8% of residents speak other Indo-European language at home (64% speak English very well, 29% speak English well, 6% speak English not well, 2% don't speak English at all).
2.2% of residents speak Asian or Pacific Island language at home (61% speak English very well, 21% speak English well, 9% speak English not well, 9% don't speak English at all).
0.6% of residents speak other language at home (72% speak English very well, 24% speak English well, 5% speak English not well).
Foreign born population: 12,699 (14.8%)
(66.4% of them are naturalized citizens)
| Here: | 6.1 |
| State: | 6.0 |
| Here: | 5.7 |
| State: | 3.9 |

- Bedrooms in owner-occupied houses and condos in San Gorgonio Pass, California
- 196no bedroom
- 1,1311 bedroom
- 6,3582 bedrooms
- 5,1223 bedrooms
- 1,2614 bedrooms
- 2375+ bedrooms

- Bedrooms in renter-occupied apartments in San Gorgonio Pass, California
- 402no bedroom
- 1,5041 bedroom
- 2,4172 bedrooms
- 9963 bedrooms
- 2314 bedrooms
- 195+ bedrooms

- Cars and other vehicles available in San Gorgonio Pass in owner-occupied houses/condos
- 663no vehicle
- 5,7651 vehicle
- 5,3622 vehicles
- 1,6493 vehicles
- 6204 vehicles
- 2465+ vehicles

- Cars and other vehicles available in San Gorgonio Pass in renter-occupied apartments
- 824no vehicle
- 2,6531 vehicle
- 1,5832 vehicles
- 3813 vehicles
- 1094 vehicles
- 195+ vehicles

- Rooms in owner-occupied houses in San Gorgonio Pass, California
- 751 room
- 3872 rooms
- 1,0743 rooms
- 2,4194 rooms
- 4,4605 rooms
- 3,1286 rooms
- 1,7277 rooms
- 6228 rooms
- 4139+ rooms

- Rooms in renter-occupied apartments in San Gorgonio Pass, California
- 3061 room
- 6422 rooms
- 1,1503 rooms
- 1,4904 rooms
- 1,0285 rooms
- 5956 rooms
- 2277 rooms
- 838 rooms
- 489+ rooms


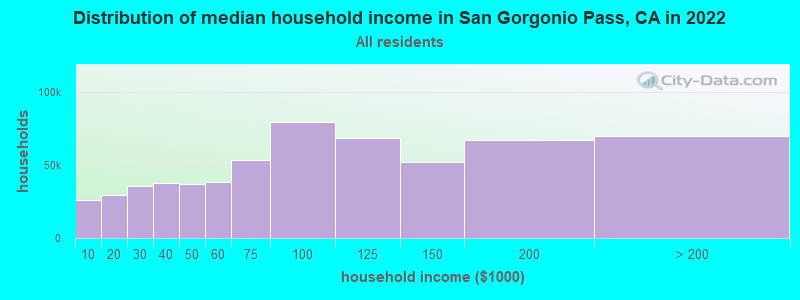
San Gorgonio Pass, CA household income distribution

- 26,056Less than $10,000
- 29,467$10,000 to $19,999
- 35,565$20,000 to $29,999
- 37,790$30,000 to $39,999
- 37,323$40,000 to $49,999
- 38,382$50,000 to $59,999
- 53,743$60,000 to $74,999
- 79,529$75,000 to $99,999
- 68,441$100,000 to $124,999
- 52,347$125,000 to $149,999
- 66,881$150,000 to $199,999
- 69,985$200,000 or more
Percentage of workers working in this county: 75.8%
Number of people working at home: 4,033 (11.7% of all workers)
Travel time to work (commute)
- Less than 5 minutes: 733
- 5 to 9 minutes: 2,620
- 10 to 14 minutes: 3,098
- 15 to 19 minutes: 2,286
- 20 to 24 minutes: 1,558
- 25 to 29 minutes: 842
- 30 to 34 minutes: 2,052
- 35 to 39 minutes: 505
- 40 to 44 minutes: 711
- 45 to 59 minutes: 1,538
- 60 to 89 minutes: 850
- 90 or more minutes: 844
Means of transportation to work:
- Drove a car alone: 13,619 (74.8%)
- Carpooled: 3,058 (16.8%)
- Bus or trolley bus: 169 (0.9%)
- Railroad: 35 (0.2%)
- Motorcycle: 15 (0.1%)
- Bicycle: 46 (0.3%)
- Walked: 465 (2.6%)
- Other means: 230 (1.3%)
- Worked at home: 571 (3.1%)


- Year of entry for the foreign-born population in San Gorgonio Pass, California
- 1,1241995 to March 2000
- 9891990 to 1994
- 1,2011985 to 1989
- 7551980 to 1984
- 8291975 to 1979
- 3901970 to 1974
- 2781965 to 1969
- 1,293Before 1965
Most common places of birth for foreign-born residents (%):
| San Gorgonio Pass: | 58.0% (3,980) |
| California: | 44.3% (3,928,701) |
| San Gorgonio Pass: | 5.6% (381) |
| California: | 0.8% (68,306) |
| San Gorgonio Pass: | 4.9% (335) |
| California: | 1.5% (133,090) |
| San Gorgonio Pass: | 3.9% (266) |
| California: | 1.1% (98,160) |
| San Gorgonio Pass: | 3.1% (212) |
| California: | 1.6% (141,181) |
| San Gorgonio Pass: | 2.3% (157) |
| California: | 0.7% (64,411) |
| San Gorgonio Pass: | 1.9% (127) |
| California: | 7.5% (664,935) |
| San Gorgonio Pass: | 1.6% (113) |
| California: | 0.3% (24,350) |
| San Gorgonio Pass: | 1.5% (103) |
| California: | 0.2% (16,885) |
Place of birth for U.S.-born residents:
- This state: 29,786
- Other state: 16,618
- Northeast: 2,729
- Midwest: 7,015
- South: 4,436
- West: 2,438
51% of San Gorgonio Pass residents lived in the same house 5 years ago.
Out of people who lived in different houses, 58% lived in this county.
Out of people who lived in different counties, 82% lived in California.
Education attainment for males 25 years and older:
- No schooling: 305
- Nursery to 4th grade: 152
- 5th and 6th grade: 400
- 7th and 8th grade: 539
- 9th grade: 399
- 10th grade: 605
- 11th grade: 555
- 12th grade, no diploma: 1,060
- High school graduate (or equivalency): 4,414
- Less than 1 year of college: 1,351
- Some college more than 1 year, no degree: 2,897
- Associate degree: 1,033
- Bachelor's degree: 1,304
- Master's degree: 702
- Professional school degree: 213
- Doctorate degree: 139

Education attainment for females 25 years and older:
- No schooling: 225
- Nursery to 4th grade: 103
- 5th and 6th grade: 485
- 7th and 8th grade: 531
- 9th grade: 541
- 10th grade: 733
- 11th grade: 673
- 12th grade, no diploma: 1,111
- High school graduate (or equivalency): 6,118
- Less than 1 year of college: 1,937
- Some college more than 1 year, no degree: 3,165
- Associate degree: 1,169
- Bachelor's degree: 1,105
- Master's degree: 609
- Professional school degree: 186
- Doctorate degree: 38


Housing units in structures:
- One, detached: 14,271
- One, attached: 1,048
- Two: 321
- 3 or 4: 539
- 5 to 9: 624
- 10 to 19: 209
- 20 to 49: 299
- 50 or more: 260
- Mobile homes: 4,195
- Boats, RVs, vans, etc.: 71
Median worth of mobile homes: $89,153
Housing units lacking complete kitchen facilities: 1.8%

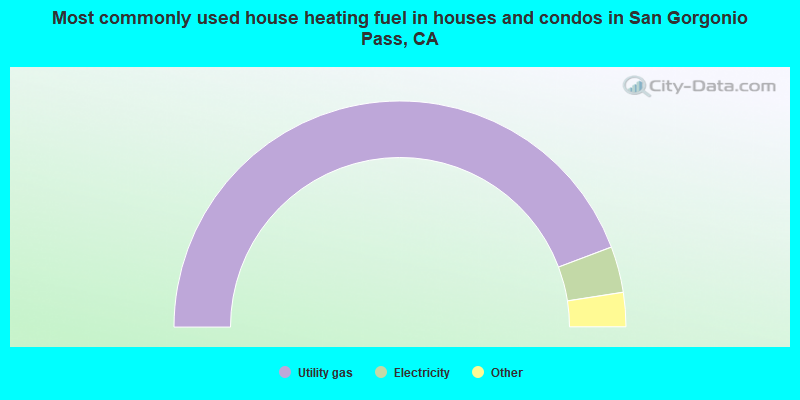
- 88.5%Utility gas
- 6.6%Electricity
- 2.7%Bottled, tank, or LP gas
- 1.7%Wood
- 0.3%Solar energy
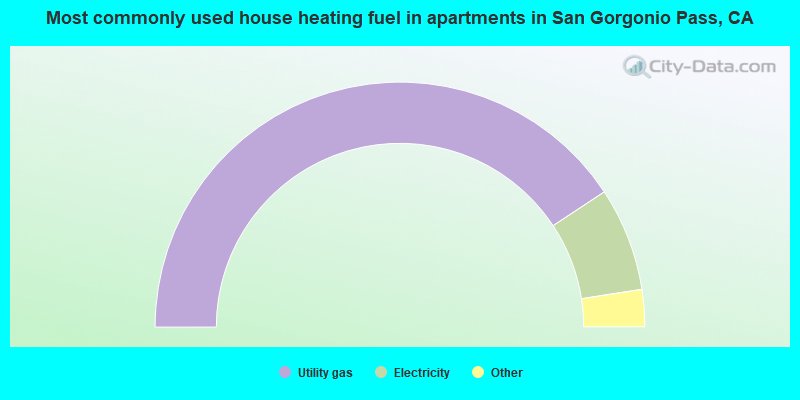
- 81.4%Utility gas
- 13.7%Electricity
- 3.2%Bottled, tank, or LP gas
- 0.6%No fuel used
- 0.6%Other fuel
- 0.3%Wood
- 0.1%Fuel oil, kerosene, etc.
Private vs. public school enrollment:
| Here: | 8.3% |
| California: | 9.9% |
| Here: | 5.8% |
| California: | 7.8% |
| Here: | 12.9% |
| California: | 15.4% |


