Housing density: 3,282 houses/condos per square mile
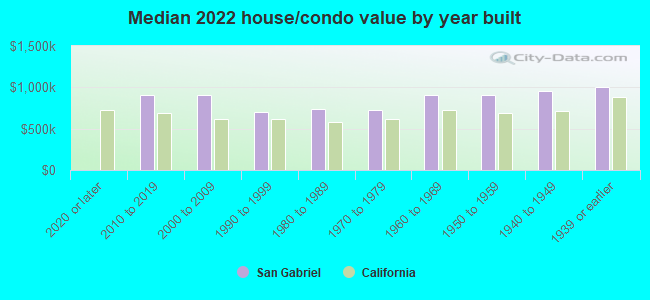
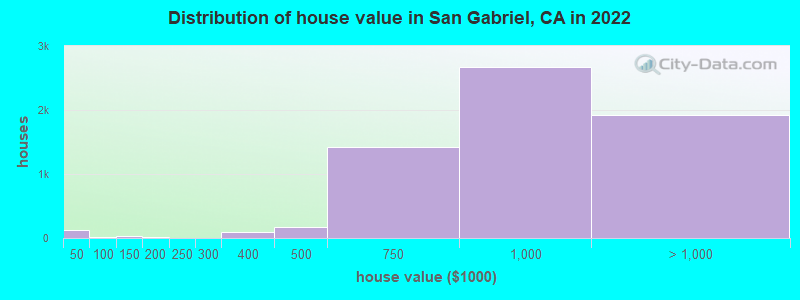
Median price asked for vacant for-sale houses and condos in 2022: $1,010,233.
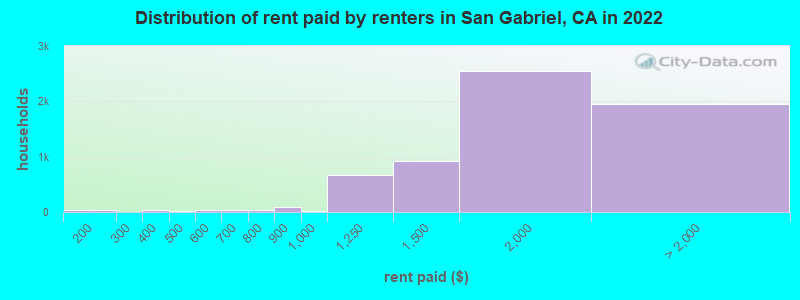
Median contract rent in 2022: $1,714 (lower quartile is $1,370, upper quartile is over $2,000)
Median rent asked for vacant for-rent units in 2022: $2,266
Median gross rent in San Gabriel, CA in 2022: $1,795
Housing units in San Gabriel with a mortgage: 3,558 (346 second mortgage, 4 home equity loan, 326 both second mortgage and home equity loan) Houses without a mortgage: 70
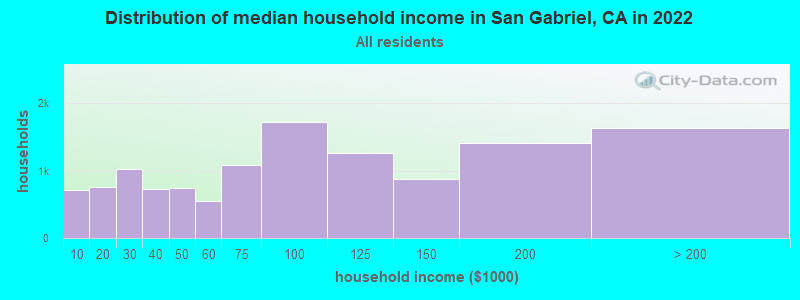
Median household income for houses/condos with a mortgage: $123,040
Median household income for apartments without a mortgage: $74,094
4,052 married couples with children.
1,221 single-parent households (419 men, 802 women).
29.0% of residents of San Gabriel speak English at home.
15.8% of residents speak Spanish at home (67% speak English very well, 16% speak English well, 10% speak English not well, 7% don't speak English at all).
1.5% of residents speak other Indo-European language at home (89% speak English very well, 8% speak English well, 3% speak English not well).
52.5% of residents speak Asian or Pacific Island language at home (32% speak English very well, 25% speak English well, 27% speak English not well, 17% don't speak English at all).
0.7% of residents speak other language at home (99% speak English very well, 1% speak English well).
Foreign born population: 20,569 (53.6%)
(62.7% of them are naturalized citizens)
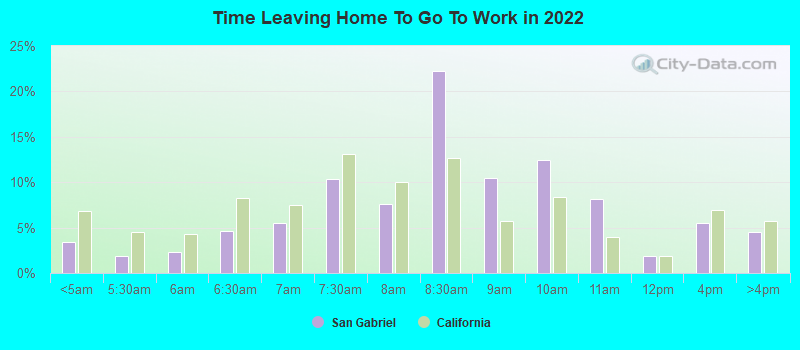
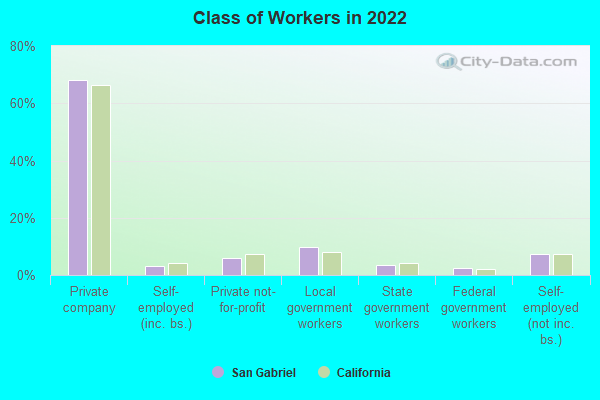
Percentage of workers working in this county: 93.9% Number of people working at home: 2,667 (14.1% of all workers)
Travel time to work (commute)
Less than 5 minutes: 27
5 to 9 minutes: 1,065
10 to 14 minutes: 2,243
15 to 19 minutes: 2,225
20 to 24 minutes: 2,233
25 to 29 minutes: 973
30 to 34 minutes: 3,145
35 to 39 minutes: 461
40 to 44 minutes: 714
45 to 59 minutes: 1,512
60 to 89 minutes: 1,060
90 or more minutes: 463
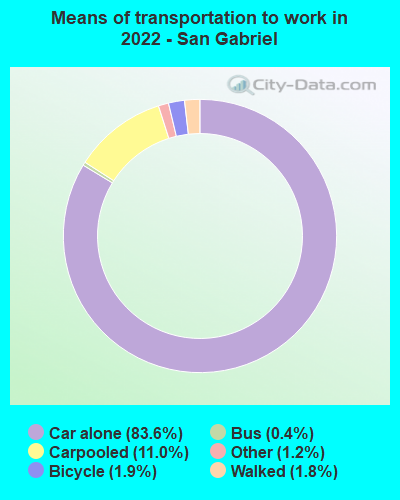
Means of transportation to work:
Drove a car alone: 10,866 (68.9%)
Carpooled: 1,585 (10.1%)
Bus: 47 (0.3%)
Taxi: 169 (1.1%)
Bicycle: 258 (1.6%)
Walked: 254 (1.6%)
Worked at home: 2,667 (16.9%)
Unemployment by race in 2022
Unemployment rate for White non-Hispanic residents
1.7%Males
8.6%Females
Unemployment rate for American Indian and Alaska Native residents
5.7%Females
Unemployment rate for Asian residents
7.2%Males
4.2%Females
Unemployment rate for other race residents
1.6%Males
2.4%Females
Unemployment rate for two or more race residents
9.3%Males
2.2%Females
Unemployment rate for Hispanic or Latino residents
7.1%Males
2.2%Females
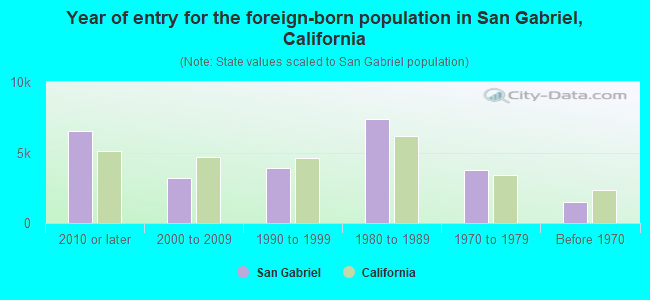
Year of entry for the foreign-born population in San Gabriel, California
6,5522010 or later
3,2012000 to 2009
3,8811990 to 1999
7,4021980 to 1989
3,7481970 to 1979
1,459Before 1970
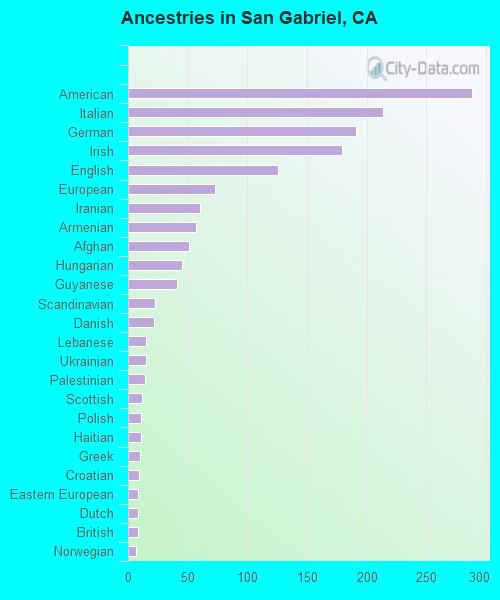
First ancestries reported:
American: 288 (1.1%)
Italian: 214 (0.8%)
German: 191 (0.7%)
Irish: 179 (0.7%)
English: 126 (0.5%)
European: 73 (0.3%)
Iranian: 60 (0.2%)
Armenian: 57 (0.2%)
Afghan: 51 (0.2%)
Hungarian: 45 (0.2%)
Guyanese: 41 (0.2%)
Scandinavian: 23 (0.09%)
Danish: 22 (0.08%)
Lebanese: 15 (0.06%)
Ukrainian: 15 (0.06%)
Palestinian: 14 (0.05%)
Scottish: 12 (0.04%)
Polish: 11 (0.04%)
Haitian: 11 (0.04%)
Greek: 10 (0.04%)
Croatian: 9 (0.03%)
Eastern European: 8 (0.03%)
Dutch: 8 (0.03%)
British: 8 (0.03%)
Norwegian: 7 (0.03%)
Scotch-Irish: 6 (0.02%)
Northern European: 5 (0.02%)
Welsh: 5 (0.02%)
French Canadian: 4 (0.01%)
Slovak: 4 (0.01%)
French: 4 (0.01%)
Czechoslovakian: 3 (0.01%)
Swiss: 2 (0.01%)
Most common places of birth for foreign-born residents (%):
China, excluding Hong Kong and Taiwan
San Gabriel:
37.3% (7,668)
California:
6.6% (684,672)
Vietnam
San Gabriel:
23.4% (4,813)
California:
4.9% (512,335)
Mexico
San Gabriel:
10.3% (2,112)
California:
37.2% (3,881,193)
Taiwan
San Gabriel:
6.3% (1,294)
California:
1.7% (176,274)
Hong Kong
San Gabriel:
4.7% (969)
California:
1.0% (105,215)
Philippines
San Gabriel:
2.5% (524)
California:
7.8% (818,297)
Cambodia
San Gabriel:
2.3% (475)
California:
0.5% (51,974)
Burma (Myanmar)
San Gabriel:
1.9% (381)
California:
0.3% (28,176)
Place of birth for U.S.-born residents:
This state: 15,571
Other state: 1,938
Northeast: 521
Midwest: 579
South: 416
West: 405
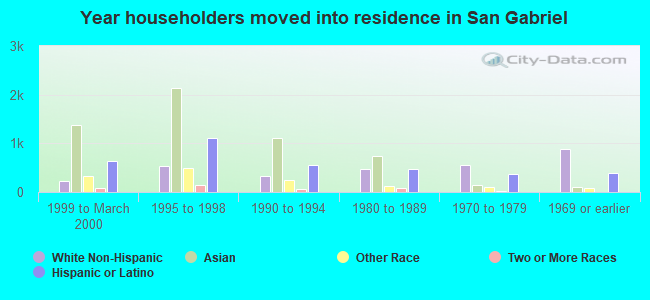
95.2% of San Gabriel residents lived in the same house 1 years ago. Out of people who lived in different houses, 40.1% lived in this county. Out of people who lived in different counties, 49.7% lived in California.
San Gabriel:
95.2%
State average:
88.9%
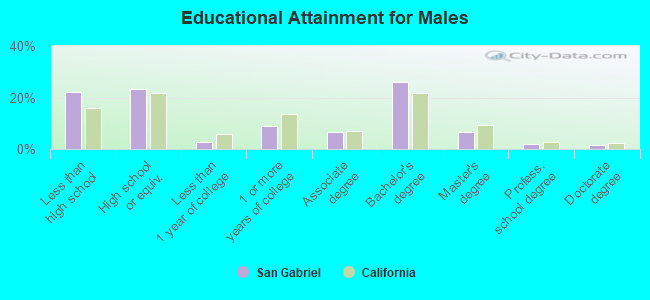
Education attainment for males 25 years and older:
No schooling: 1,377
Nursery to 4th grade: 190
5th and 6th grade: 506
7th and 8th grade: 80
9th grade: 308
10th grade: 71
11th grade: 110
12th grade, no diploma: 475
High school graduate (or equivalency): 3,292
Less than 1 year of college: 364
Some college more than 1 year, no degree: 1,268
Associate degree: 942
Bachelor's degree: 3,638
Master's degree: 928
Professional school degree: 287
Doctorate degree: 199
Education attainment for females 25 years and older:
No schooling: 1,852
Nursery to 4th grade: 271
5th and 6th grade: 559
7th and 8th grade: 170
9th grade: 398
10th grade: 135
11th grade: 54
12th grade, no diploma: 300
High school graduate (or equivalency): 3,332
Less than 1 year of college: 601
Some college more than 1 year, no degree: 1,456
Associate degree: 1,284
Bachelor's degree: 3,683
Master's degree: 1,287
Professional school degree: 294
Doctorate degree: 106
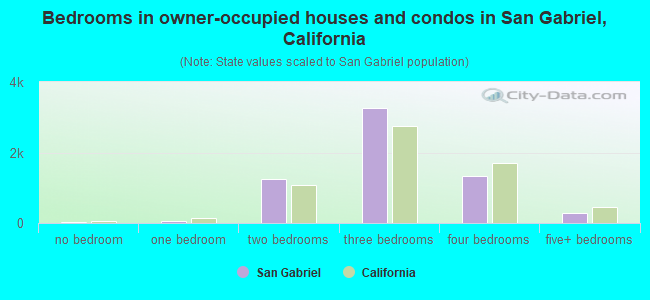
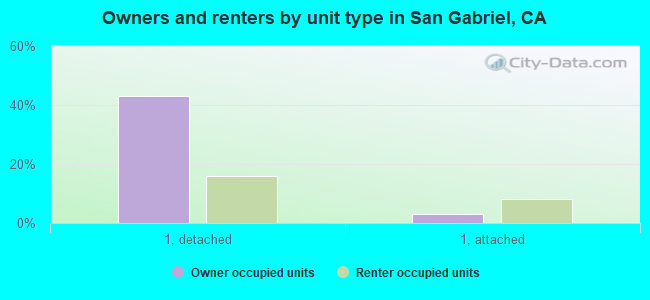
Housing units in structures:
One, detached: 7,934
One, attached: 1,568
Two: 108
3 or 4: 577
5 to 9: 1,140
10 to 19: 1,005
20 to 49: 933
50 or more: 267
Mobile homes: 16
Housing units lacking complete plumbing facilities in 2022: 0.2%
Housing units lacking complete kitchen facilities in 2022: 5.3%
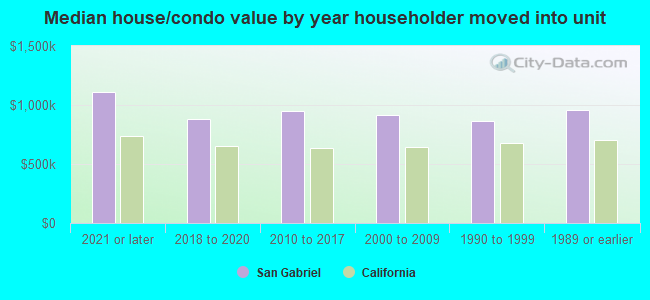
House/condo owner moved in on average 20 years ago