Housing density: 8,878 houses/condos per square mile
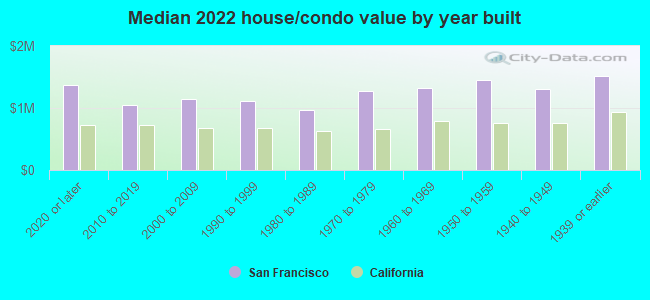
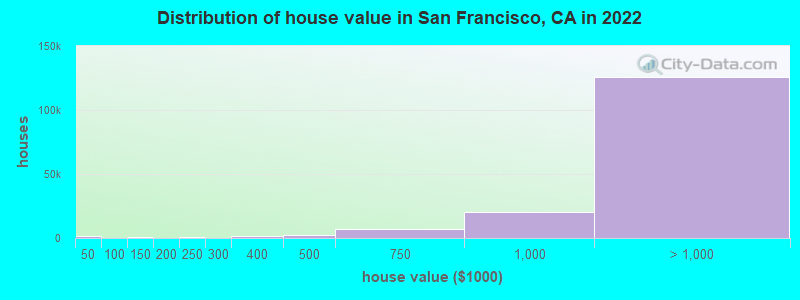
Median price asked for vacant for-sale houses and condos in 2022: $1,758,224.
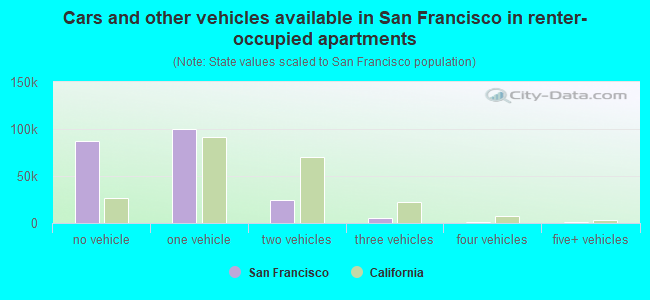
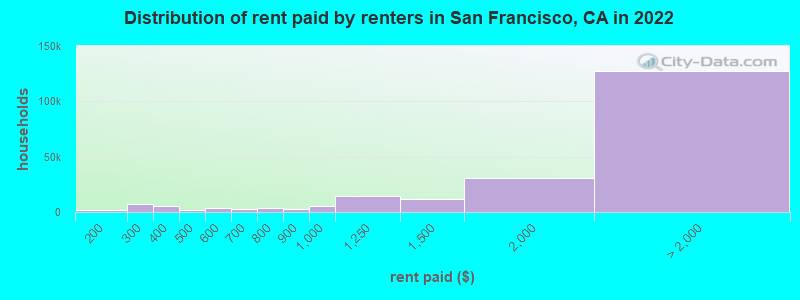
Median contract rent in 2022: over $2,000 (lower quartile is $1,319, upper quartile is over $2,000)
Median rent asked for vacant for-rent units in 2022: $2,966
Median gross rent in San Francisco, CA in 2022: over $2,000
Housing units in San Francisco with a mortgage: 88,355 (11,037 second mortgage, 418 home equity loan, 8,730 both second mortgage and home equity loan) Houses without a mortgage: 1,471
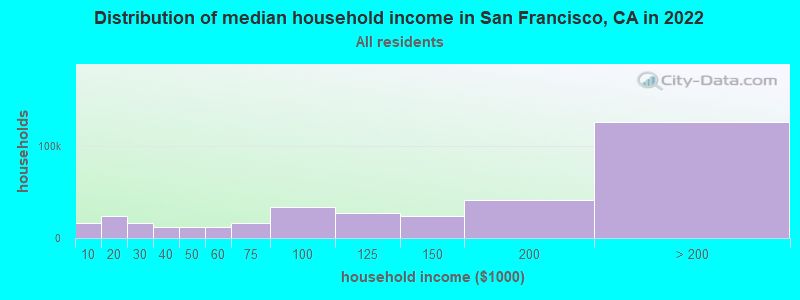
Median household income for houses/condos with a mortgage: $227,626
Median household income for apartments without a mortgage: $116,133
Median monthly housing costs: $2,451
Compare current foreclosures in San Francisco, CA:
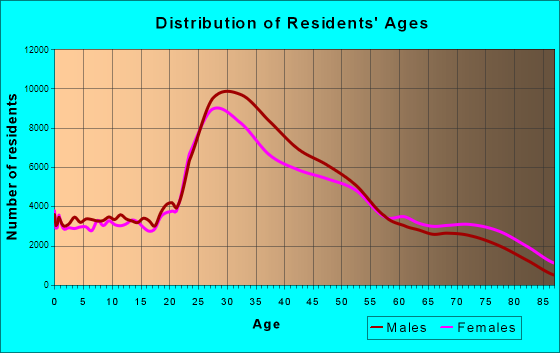
77,405 married couples with children.
19,126 single-parent households (6,278 men, 12,848 women).
56.7% of residents of San Francisco speak English at home.
10.4% of residents speak Spanish at home (64% speak English very well, 17% speak English well, 14% speak English not well, 4% don't speak English at all).
6.9% of residents speak other Indo-European language at home (81% speak English very well, 13% speak English well, 5% speak English not well, 1% don't speak English at all).
25.0% of residents speak Asian or Pacific Island language at home (45% speak English very well, 21% speak English well, 21% speak English not well, 12% don't speak English at all).
1.0% of residents speak other language at home (74% speak English very well, 17% speak English well, 6% speak English not well, 3% don't speak English at all).
Foreign born population: 268,197 (33.2%)
(63.3% of them are naturalized citizens)
Percentage of workers working in this county: 82.3% Number of people working at home: 151,314 (32.5% of all workers)
Travel time to work (commute)
Less than 5 minutes: 3,362
5 to 9 minutes: 17,754
10 to 14 minutes: 28,272
15 to 19 minutes: 42,248
20 to 24 minutes: 46,627
25 to 29 minutes: 23,497
30 to 34 minutes: 61,455
35 to 39 minutes: 12,486
40 to 44 minutes: 15,007
45 to 59 minutes: 29,000
60 to 89 minutes: 27,824
90 or more minutes: 6,335
Means of transportation to work:
Drove a car alone: 212,061 (35.2%)
Carpooled: 44,065 (7.3%)
Bus: 55,563 (9.2%)
Subway or elevated rail: 46,153 (7.7%)
Long-distance train or commuter rail: 9,622 (1.6%)
Light rail, streetcar or trolley: 5,726 (0.9%)
Ferryboat: 4,973 (0.8%)
Taxi: 14,648 (2.4%)
Bicycle: 16,237 (2.7%)
Walked: 42,815 (7.1%)
Worked at home: 151,314 (25.1%)
Unemployment by race in 2022
Unemployment rate for White non-Hispanic residents
2.4%Males
2.9%Females
Unemployment rate for Black residents
14.1%Males
4.1%Females
Unemployment rate for American Indian and Alaska Native residents
6.5%Males
5.2%Females
Unemployment rate for Asian residents
4.6%Males
3.4%Females
Unemployment rate for other race residents
4.7%Males
2.2%Females
Unemployment rate for two or more race residents
3.6%Males
4.8%Females
Unemployment rate for Hispanic or Latino residents
4.9%Males
3.0%Females
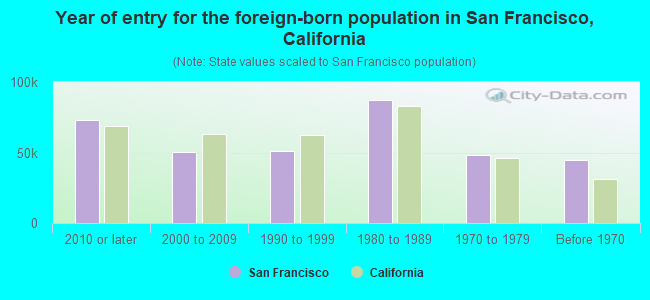
Year of entry for the foreign-born population in San Francisco, California
73,2082010 or later
50,5482000 to 2009
51,4111990 to 1999
86,9491980 to 1989
47,9991970 to 1979
44,393Before 1970
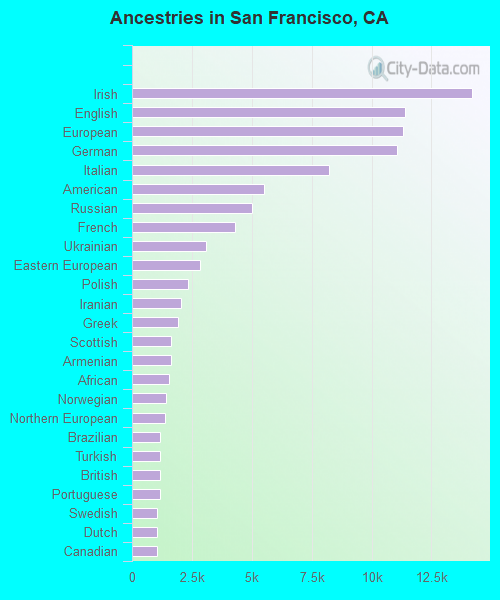
First ancestries reported:
Irish: 14,191 (3.4%)
English: 11,409 (2.7%)
European: 11,314 (2.7%)
German: 11,077 (2.6%)
Italian: 8,209 (1.9%)
American: 5,497 (1.3%)
Russian: 5,001 (1.2%)
French: 4,304 (1.0%)
Ukrainian: 3,097 (0.7%)
Eastern European: 2,837 (0.7%)
Polish: 2,330 (0.6%)
Iranian: 2,066 (0.5%)
Greek: 1,938 (0.5%)
Scottish: 1,616 (0.4%)
Armenian: 1,613 (0.4%)
African: 1,540 (0.4%)
Norwegian: 1,422 (0.3%)
Northern European: 1,361 (0.3%)
Brazilian: 1,185 (0.3%)
Turkish: 1,176 (0.3%)
British: 1,174 (0.3%)
Portuguese: 1,165 (0.3%)
Swedish: 1,048 (0.2%)
Dutch: 1,043 (0.2%)
Canadian: 1,031 (0.2%)
Lebanese: 957 (0.2%)
Romanian: 903 (0.2%)
Nigerian: 766 (0.2%)
Afghan: 759 (0.2%)
Swiss: 681 (0.2%)
French Canadian: 671 (0.2%)
Scandinavian: 661 (0.2%)
Croatian: 642 (0.2%)
Czech: 630 (0.1%)
Scotch-Irish: 624 (0.1%)
Austrian: 603 (0.1%)
Australian: 583 (0.1%)
Serbian: 556 (0.1%)
Finnish: 526 (0.1%)
Danish: 432 (0.1%)
Welsh: 425 (0.1%)
Belgian: 403 (0.10%)
Arab: 383 (0.09%)
Hungarian: 377 (0.09%)
Ugandan: 368 (0.09%)
Ethiopian: 355 (0.08%)
Israeli: 348 (0.08%)
Egyptian: 346 (0.08%)
Slovak: 338 (0.08%)
Lithuanian: 244 (0.06%)
Moroccan: 239 (0.06%)
Liberian: 233 (0.06%)
Ghanaian: 183 (0.04%)
Syrian: 177 (0.04%)
Bulgarian: 171 (0.04%)
Slavic: 156 (0.04%)
Cape Verdean: 151 (0.04%)
Palestinian: 146 (0.03%)
Haitian: 143 (0.03%)
Slovene: 139 (0.03%)
Kenyan: 131 (0.03%)
Iraqi: 124 (0.03%)
South African: 117 (0.03%)
Albanian: 108 (0.03%)
Yugoslavian: 103 (0.02%)
Jamaican: 92 (0.02%)
Basque: 87 (0.02%)
Trinidadian and Tobagonian: 52 (0.01%)
Guyanese: 45 (0.01%)
Assyrian: 41 (0.01%)
West Indian: 23 (0.01%)
Most common places of birth for foreign-born residents (%):
China, excluding Hong Kong and Taiwan
San Francisco:
29.4% (84,515)
California:
6.6% (684,672)
Philippines
San Francisco:
7.5% (21,605)
California:
7.8% (818,297)
Mexico
San Francisco:
7.0% (20,137)
California:
37.2% (3,881,193)
Hong Kong
San Francisco:
5.3% (15,223)
California:
1.0% (105,215)
Vietnam
San Francisco:
5.2% (14,907)
California:
4.9% (512,335)
India
San Francisco:
4.8% (13,787)
California:
5.2% (539,184)
El Salvador
San Francisco:
3.1% (8,868)
California:
4.2% (440,287)
Korea
San Francisco:
2.4% (6,809)
California:
3.0% (315,248)
Taiwan
San Francisco:
1.9% (5,496)
California:
1.7% (176,274)
Canada
San Francisco:
1.9% (5,410)
California:
1.2% (127,477)
Russia
San Francisco:
1.8% (5,234)
California:
0.7% (71,932)
Ukraine
San Francisco:
1.6% (4,466)
California:
0.6% (60,761)
France
San Francisco:
1.5% (4,385)
California:
0.4% (40,224)
Place of birth for U.S.-born residents:
This state: 329,753
Other state: 189,258
Northeast: 64,541
Midwest: 52,215
South: 43,663
West: 28,839
84.5% of San Francisco residents lived in the same house 1 years ago. Out of people who lived in different houses, 33.8% lived in this county. Out of people who lived in different counties, 58.1% lived in California.
San Francisco:
84.5%
State average:
88.9%
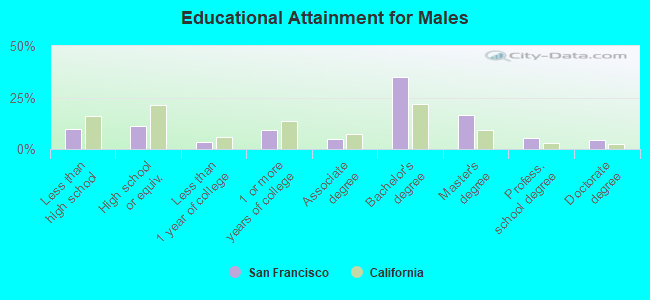
Education attainment for males 25 years and older:
No schooling: 11,341
Nursery to 4th grade: 1,902
5th and 6th grade: 2,842
7th and 8th grade: 2,964
9th grade: 2,001
10th grade: 1,992
11th grade: 2,061
12th grade, no diploma: 7,809
High school graduate (or equivalency): 37,934
Less than 1 year of college: 11,007
Some college more than 1 year, no degree: 30,649
Associate degree: 15,374
Bachelor's degree: 116,929
Master's degree: 55,653
Professional school degree: 18,316
Doctorate degree: 14,136
Education attainment for females 25 years and older:
No schooling: 14,447
Nursery to 4th grade: 3,127
5th and 6th grade: 4,782
7th and 8th grade: 3,304
9th grade: 2,480
10th grade: 2,080
11th grade: 2,302
12th grade, no diploma: 6,129
High school graduate (or equivalency): 32,038
Less than 1 year of college: 8,714
Some college more than 1 year, no degree: 22,033
Associate degree: 19,448
Bachelor's degree: 109,554
Master's degree: 53,972
Professional school degree: 15,858
Doctorate degree: 11,171
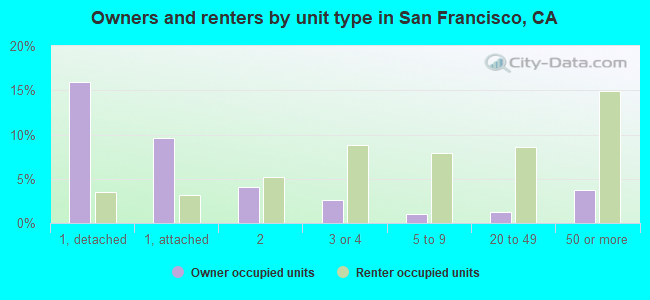
Housing units in structures:
One, detached: 74,994
One, attached: 47,815
Two: 39,593
3 or 4: 49,051
5 to 9: 36,968
10 to 19: 38,953
20 to 49: 43,311
50 or more: 83,197
Mobile homes: 350
Boats, RVs, vans, etc.: 321
Median worth of mobile homes: $193,774
Housing units lacking complete plumbing facilities in 2022: 2.4%
Housing units lacking complete kitchen facilities in 2022: 4.2%
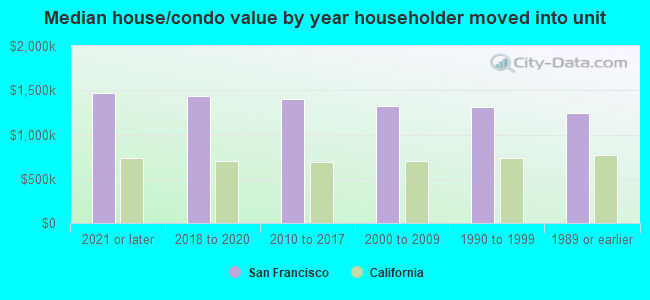
House/condo owner moved in on average 15 years ago