San Clemente, CA (California) Houses and Residents
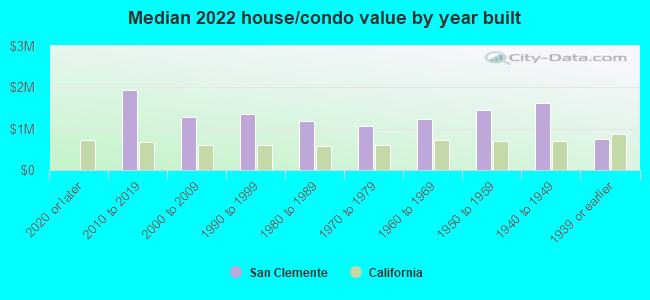
| San Clemente: | $1,265,946 |
| California: | $715,900 |
Mean price in 2022:
Detached houses: $1,626,593
Here: $1,626,593 State: $988,808 Townhouses or other attached units: $988,689
Here: $988,689 State: $838,546 In 2-unit structures: $1,219,180
Here: $1,219,180 State: $1,138,100 In 3-to-4-unit structures: $2,257,135
Here: $2,257,135 State: $824,253 In 5-or-more-unit structures: $831,519
Here: $831,519 State: $730,996 Mobile homes: $667,481
Here: $667,481 State: $184,506
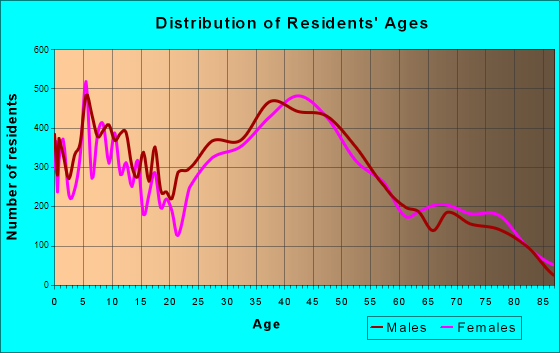
Total population: 65,326 (Urban population: 49,620, Rural population: 241 (all nonfarm))
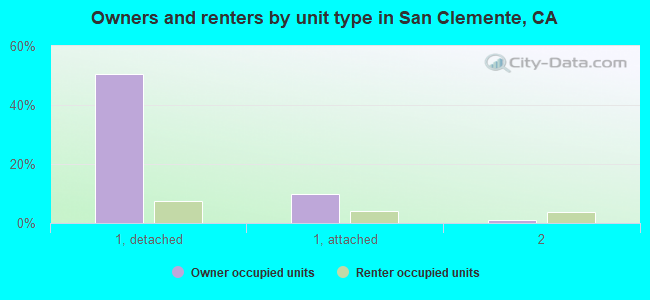
Houses: 26,945 (23,974 occupied: 15,610 owner occupied, 8,455 renter occupied)
| % of renters here: | 35% |
| State: | 44% |
Housing density: 1,529 houses/condos per square mile
Median price asked for vacant for-sale houses and condos in 2022: $1,733,094.
Median contract rent in 2022: over $2,000 (lower quartile is $1,664, upper quartile is over $2,000)
Median rent asked for vacant for-rent units in 2022: $2,239
Median gross rent in San Clemente, CA in 2022: over $2,000
Housing units in San Clemente with a mortgage: 10,980 (1,772 second mortgage, 56 home equity loan, 1,640 both second mortgage and home equity loan)
Houses without a mortgage: 205
Median household income for houses/condos with a mortgage: $186,784
Median household income for apartments without a mortgage: $122,815
Median monthly housing costs: $2,676
Compare current foreclosures near San Clemente, CA:
| Photo | Address | Area | Beds / Baths | Price | Details |
|---|---|---|---|---|---|

|
#1
E Marquita
San Clemente, CA 92672
|
1,443 sq. feet
|
3 baths 3 beds |
show details | |

|
#2
W Canada
San Clemente, CA 92672
|
1,202 sq. feet
|
2 baths 2 beds |
show details | |

|
#3
Calle Del Juego
San Clemente, CA 92672
|
2,285 sq. feet
|
2 baths 4 beds |
show details | |

|
#4
Calle Vallarta
San Clemente, CA 92673
|
2,987 sq. feet
|
3 baths 4 beds |
show details | |

|
#5
Paseo Halcon
San Clemente, CA 92672
|
1,606 sq. feet
|
2 baths 2 beds |
show details | |

|
#6
Avenida Adobe
San Clemente, CA 92672
|
1,027 sq. feet
|
2 baths 2 beds |
show details | |

|
#7
Puerto Caravaca
San Clemente, CA 92672
|
1,363 sq. feet
|
1 baths - beds |
show details | |

|
#8
Vista Jardin
San Clemente, CA 92673
|
- sq. feet
|
- baths 5 beds |
show details | |

|
#9
Avenida Pelayo Apt A
San Clemente, CA 92672
|
- sq. feet
|
- baths - beds |
show details | |

|
#10
E Escalones Apt A
San Clemente, CA 92672
|
- sq. feet
|
- baths - beds |
show details |
| Photo | Address | Area | Beds / Baths | Price | Details |
|---|---|---|---|---|---|

|
#11
S El Camino Real
San Clemente, CA 92672
|
3,251 sq. feet
|
- baths - beds |
show details | |

|
#12
Calle Camisa
San Clemente, CA 92673
|
- sq. feet
|
- baths - beds |
show details | |

|
#13
Finca
San Clemente, CA 92672
|
1,192 sq. feet
|
- baths - beds |
show details | |

|
#14
W Escalones Apt B
San Clemente, CA 92672
|
- sq. feet
|
- baths - beds |
show details | |

|
#15
Calle Campana Apt 1
San Clemente, CA 92673
|
- sq. feet
|
- baths - beds |
show details | |

|
#16
Avenida Dolores
San Clemente, CA 92672
|
- sq. feet
|
- baths - beds |
show details | |

|
#17
Avenida La Pata
San Clemente, CA 92673
|
- sq. feet
|
- baths - beds |
show details | |

|
#18
Via Vistosa
San Clemente, CA 92672
|
- sq. feet
|
- baths - beds |
show details | |

|
#19
Vista Jardin
San Clemente, CA 92673
|
- sq. feet
|
- baths 5 beds |
show details | |

|
#20
Via Mariposa E Unit C
Laguna Hills, CA 92637
|
1,325 sq. feet
|
2 baths 2 beds |
$409,000
|
show details |
| Photo | Address | Area | Beds / Baths | Price | Details |
|---|---|---|---|---|---|

|
#21
Costero Risco
San Clemente, CA 92673
|
- sq. feet
|
- baths - beds |
show details | |

|
#22
Via Vina
San Clemente, CA 92673
|
- sq. feet
|
- baths - beds |
show details | |

|
#23
Carmel Dr
Lake Forest, CA 92630
|
1,549 sq. feet
|
2 baths 3 beds |
show details | |

|
#24
32981 N. Peak Dr.
Trabuco Canyon, CA 92679
|
2,647 sq. feet
|
2 baths 4 beds |
show details | |

|
#25
Via Joaquin
Rancho Santa Margarita, CA 92688
|
1,100 sq. feet
|
2 baths 3 beds |
show details | |

|
#26
Tobago
Laguna Niguel, CA 92677
|
1,605 sq. feet
|
3 baths 3 beds |
show details | |

|
#27
Hidden Trail Rd
Laguna Hills, CA 92653
|
5,762 sq. feet
|
4 baths 5 beds |
show details | |

|
#28
Silver Lantern St
Dana Point, CA 92629
|
3,066 sq. feet
|
4 baths 3 beds |
show details | |

|
#29
Daybreak Ln
Rancho Santa Margarita, CA 92688
|
1,420 sq. feet
|
2 baths 3 beds |
show details | |

|
#30
Shady Ln
Laguna Beach, CA 92651
|
995 sq. feet
|
2 baths 3 beds |
show details |
| Photo | Address | Area | Beds / Baths | Price | Details |
|---|---|---|---|---|---|

|
#31
Black Hawk
Irvine, CA 92603
|
4,887 sq. feet
|
4 baths 4 beds |
show details | |

|
#32
Glocamora Ln
San Juan Capistrano, CA 92675
|
4,337 sq. feet
|
3 baths 3 beds |
show details | |

|
#33
Zancon
Mission Viejo, CA 92692
|
1,123 sq. feet
|
2 baths 3 beds |
show details | |

|
#34
Via Del Sur
Mission Viejo, CA 92691
|
1,369 sq. feet
|
2 baths 2 beds |
show details | |

|
#35
El Pilar
Laguna Niguel, CA 92677
|
683 sq. feet
|
1 baths 1 beds |
show details | |

|
#36
Clemens Ln
Lake Forest, CA 92630
|
1,189 sq. feet
|
2 baths 2 beds |
show details | |

|
#37
Del Mar Ave
Laguna Beach, CA 92651
|
640 sq. feet
|
2 baths 2 beds |
show details | |

|
#38
Malaga Way
Lake Forest, CA 92630
|
1,022 sq. feet
|
2 baths 2 beds |
show details | |

|
#39
Estepona
Mission Viejo, CA 92691
|
1,123 sq. feet
|
2 baths 3 beds |
show details | |

|
#40
Placida Ave
Laguna Niguel, CA 92677
|
2,051 sq. feet
|
2 baths 3 beds |
show details |
| Photo | Address | Area | Beds / Baths | Price | Details |
|---|---|---|---|---|---|

|
#41
Cottage Ln
Aliso Viejo, CA 92656
|
2,000 sq. feet
|
3 baths 3 beds |
show details | |

|
#42
Sorrento Unit 144
Laguna Niguel, CA 92677
|
1,131 sq. feet
|
2 baths 3 beds |
show details | |

|
#43
San Dona
Laguna Hills, CA 92653
|
1,331 sq. feet
|
2 baths 4 beds |
show details | |

|
#44
Killy St
Lake Forest, CA 92630
|
1,250 sq. feet
|
2 baths 3 beds |
show details | |

|
#45
Cabrosa
Mission Viejo, CA 92691
|
1,812 sq. feet
|
3 baths 4 beds |
show details | |

|
#46
San Dona
Laguna Hills, CA 92653
|
1,331 sq. feet
|
2 baths 4 beds |
show details | |

|
#47
Fargo Rd
Laguna Hills, CA 92653
|
6,596 sq. feet
|
5 baths 4 beds |
show details | |

|
#48
Fargo Rd
Laguna Hills, CA 92653
|
6,596 sq. feet
|
5 baths 4 beds |
show details | |

|
#49
Lake Forest Ln
Lake Forest, CA 92630
|
1,926 sq. feet
|
3 baths 4 beds |
show details | |

|
Check over 1 million property listings on Foreclosure.com!
|
browse all offers | |||


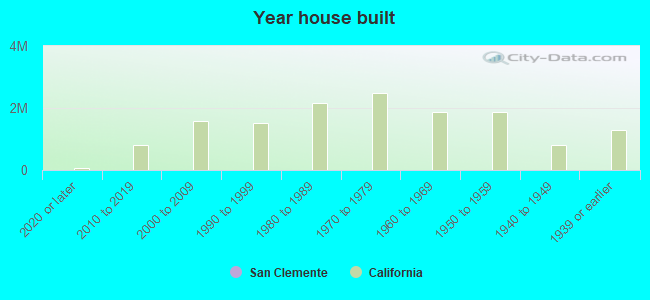
Median year apartment built: 1977
Household type by relationship:
Households: 63,745- Male householders: 12,157 (1,613 living alone), Female householders: 11,309 (3,161 living alone)
14,306 spouses (14,187 opposite-sex spouses), 1,623 unmarried partners, (1,506 opposite-sex unmarried partners), 18,793 children (18,247 natural, 264 adopted, 280 stepchildren), 984 grandchildren, 242 brothers or sisters, 725 parents, 80 foster children, 786 other relatives, 2,296 non-relatives
- In group quarters: 439
Size of family households: 7,782 2-persons, 3,459 3-persons, 3,679 4-persons, 1,213 5-persons, 721 6-persons, 148 7-or-more-persons.
Size of nonfamily households: 4,974 1-person, 1,820 2-persons, 156 3-persons, 63 4-persons, 64 5-persons.
9,791 married couples with children.
2,456 single-parent households (590 men, 1,866 women).
82.0% of residents of San Clemente speak English at home.
9.3% of residents speak Spanish at home (66% speak English very well, 13% speak English well, 14% speak English not well, 7% don't speak English at all).
5.0% of residents speak other Indo-European language at home (76% speak English very well, 17% speak English well, 7% speak English not well).
1.9% of residents speak Asian or Pacific Island language at home (74% speak English very well, 14% speak English well, 10% speak English not well, 1% don't speak English at all).
0.5% of residents speak other language at home (87% speak English very well, 8% speak English well, 5% speak English not well).
Foreign born population: 7,363 (11.6%)
(67.5% of them are naturalized citizens)
| Here: | 6.7 |
| State: | 6.0 |
| Here: | 4.0 |
| State: | 3.9 |
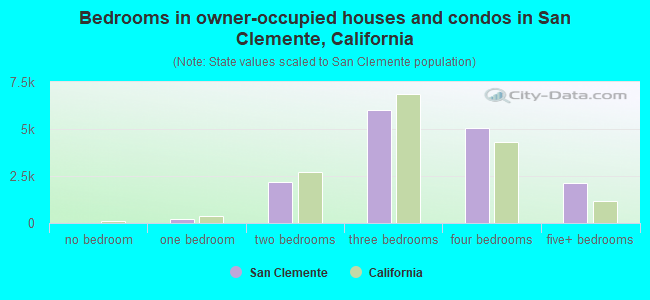
- Bedrooms in owner-occupied houses and condos in San Clemente, California
- 17no bedroom
- 2341 bedroom
- 2,1952 bedrooms
- 5,9993 bedrooms
- 5,0284 bedrooms
- 2,1375+ bedrooms
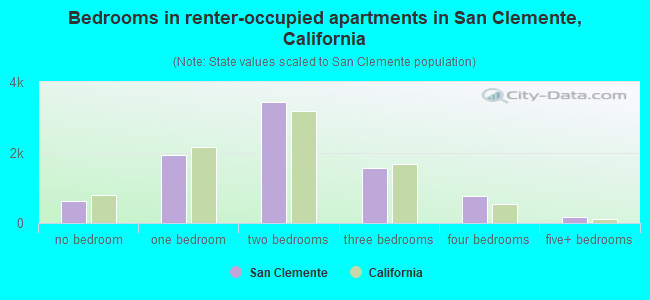
- Bedrooms in renter-occupied apartments in San Clemente, California
- 610no bedroom
- 1,9271 bedroom
- 3,4282 bedrooms
- 1,5713 bedrooms
- 7634 bedrooms
- 1575+ bedrooms
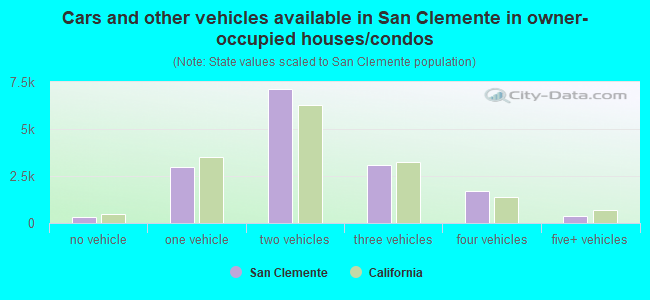
- Cars and other vehicles available in San Clemente in owner-occupied houses/condos
- 306no vehicle
- 3,0041 vehicle
- 7,1192 vehicles
- 3,0983 vehicles
- 1,7264 vehicles
- 3565+ vehicles
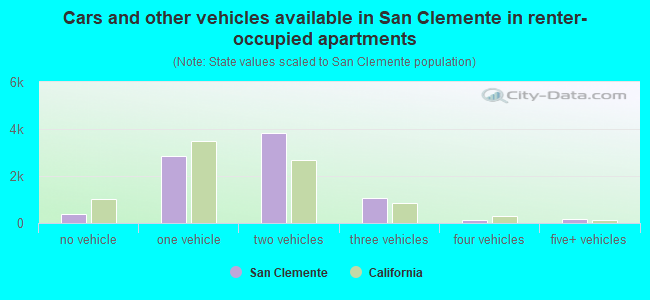
- Cars and other vehicles available in San Clemente in renter-occupied apartments
- 399no vehicle
- 2,8341 vehicle
- 3,8452 vehicles
- 1,0713 vehicles
- 1364 vehicles
- 1705+ vehicles
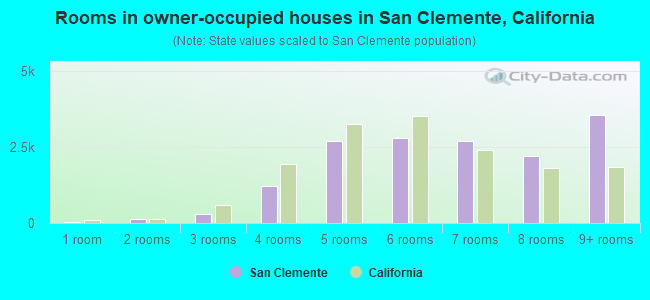
- Rooms in owner-occupied houses in San Clemente, California
- 171 room
- 1312 rooms
- 2983 rooms
- 1,2094 rooms
- 2,6845 rooms
- 2,8066 rooms
- 2,7107 rooms
- 2,2038 rooms
- 3,5519+ rooms
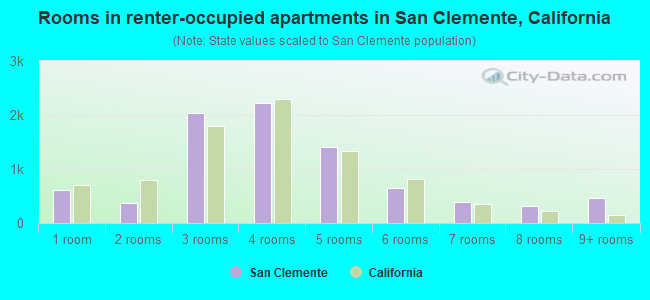
- Rooms in renter-occupied apartments in San Clemente, California
- 6101 room
- 3642 rooms
- 2,0433 rooms
- 2,2224 rooms
- 1,4005 rooms
- 6456 rooms
- 3937 rooms
- 3188 rooms
- 4619+ rooms
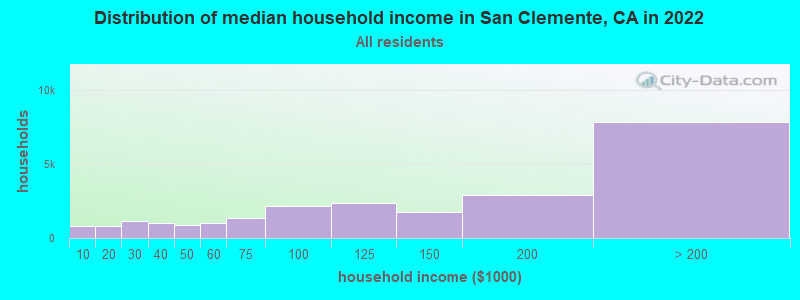
San Clemente, CA household income distribution

- 821Less than $10,000
- 827$10,000 to $19,999
- 1,148$20,000 to $29,999
- 1,012$30,000 to $39,999
- 902$40,000 to $49,999
- 1,033$50,000 to $59,999
- 1,363$60,000 to $74,999
- 2,150$75,000 to $99,999
- 2,356$100,000 to $124,999
- 1,739$125,000 to $149,999
- 2,886$150,000 to $199,999
- 7,820$200,000 or more
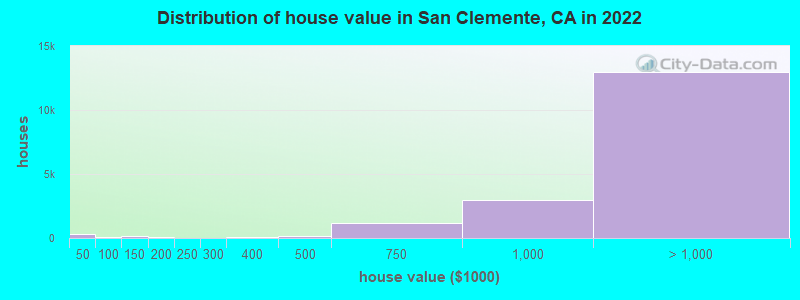
Home value of owner - occupied houses in 2022 in San Clemente, CA
-
- 291Less than $10,000
- 13$70,000 to $79,999
- 41$80,000 to $89,999
- 113$100,000 to $124,999
- 7$125,000 to $149,999
- 87$150,000 to $174,999
- 17$200,000 to $249,999
- 7$250,000 to $299,999
- 58$300,000 to $399,999
- 173$400,000 to $499,999
- 1,146$500,000 to $749,999
- 2,931$750,000 to $999,999
- 6,448$1,000,000 to $1,499,999
- 3,545$1,500,000 to $1,999,999
- 2,974$2,000,000 or more
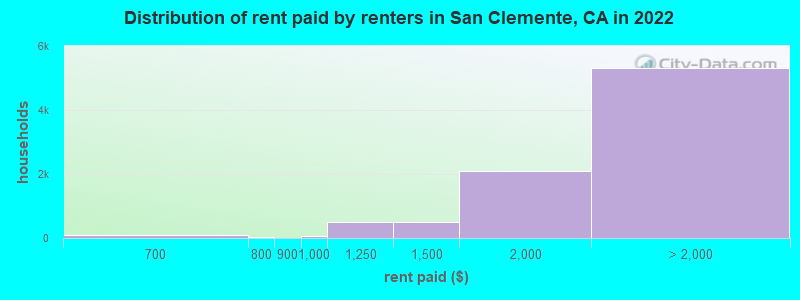
Rent paid by renters in 2022 in San Clemente, CA
-
- 16$100 to $149
- 15$250 to $299
- 44$300 to $349
- 9$400 to $449
- 79$600 to $649
- 44$700 to $749
- 9$800 to $899
- 57$900 to $999
- 504$1,000 to $1,249
- 511$1,250 to $1,499
- 2,104$1,500 to $1,999
- 1,514$2,000 to $2,499
- 1,157$2,500 to $2,999
- 807$3,000 to $3,499
- 1,246$3,500 or more
- 600No cash rent
Percentage of workers working in this county: 87.7%
Number of people working at home: 7,304 (23.7% of all workers)
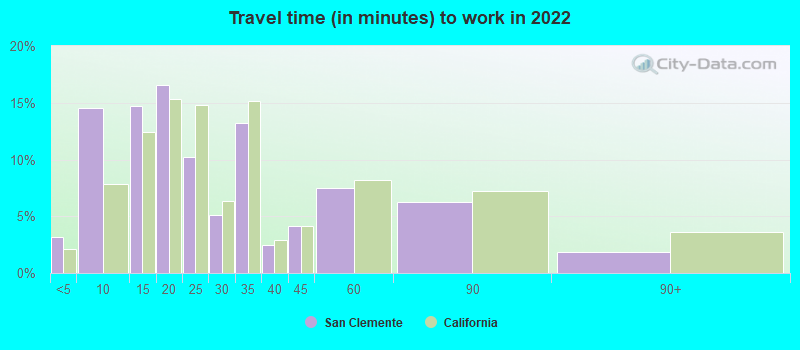
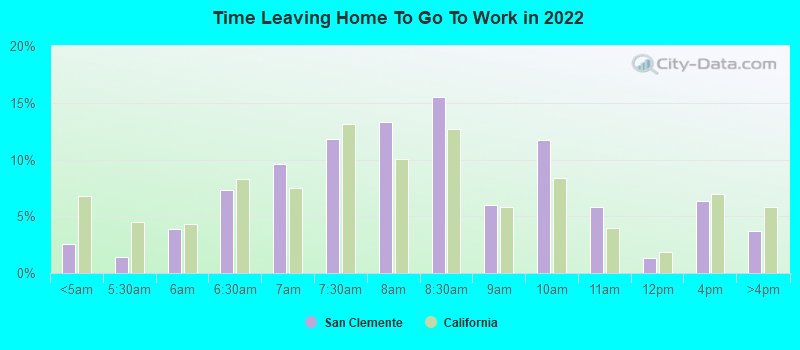
Travel time to work (commute)
- Less than 5 minutes: 639
- 5 to 9 minutes: 2,753
- 10 to 14 minutes: 3,604
- 15 to 19 minutes: 2,738
- 20 to 24 minutes: 2,160
- 25 to 29 minutes: 1,376
- 30 to 34 minutes: 3,248
- 35 to 39 minutes: 1,033
- 40 to 44 minutes: 985
- 45 to 59 minutes: 2,392
- 60 to 89 minutes: 1,956
- 90 or more minutes: 738
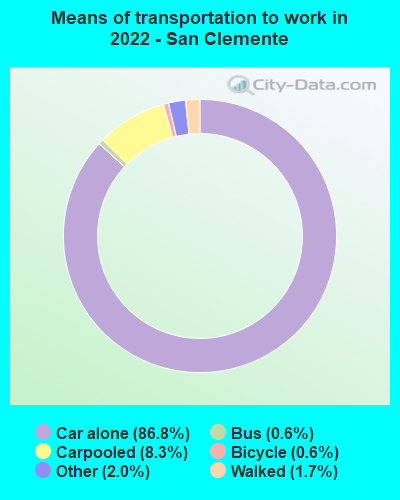
Means of transportation to work:
- Drove a car alone: 16,737 (63.9%)
- Carpooled: 1,726 (6.6%)
- Bus: 106 (0.4%)
- Taxi: 444 (1.7%)
- Bicycle: 131 (0.5%)
- Walked: 328 (1.3%)
- Worked at home: 7,304 (27.9%)
- Unemployment by race in 2022
- Unemployment rate for White non-Hispanic residents
- 4.3%Males
- 4.6%Females
- Unemployment rate for Asian residents
- 4.6%Females
- Unemployment rate for other race residents
- 3.2%Males
- 8.1%Females
- Unemployment rate for two or more race residents
- 1.0%Males
- 1.2%Females
- Unemployment rate for Hispanic or Latino residents
- 3.7%Males
- 3.2%Females
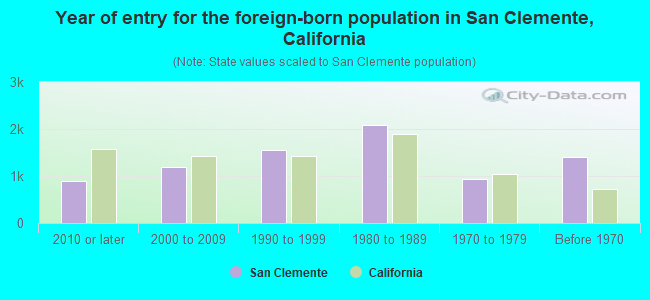
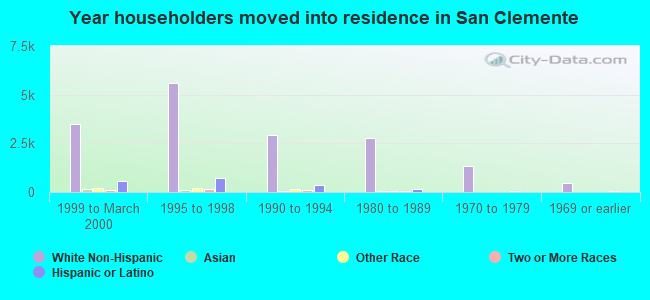
- Year of entry for the foreign-born population in San Clemente, California
- 8902010 or later
- 1,2022000 to 2009
- 1,5611990 to 1999
- 2,0811980 to 1989
- 9311970 to 1979
- 1,412Before 1970
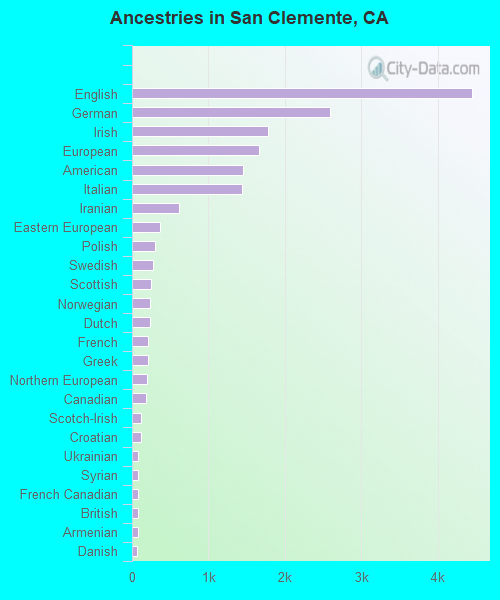
First ancestries reported:
- English: 4,451 (15.7%)
- German: 2,590 (9.1%)
- Irish: 1,781 (6.3%)
- European: 1,663 (5.9%)
- American: 1,453 (5.1%)
- Italian: 1,441 (5.1%)
- Iranian: 611 (2.2%)
- Eastern European: 364 (1.3%)
- Polish: 298 (1.1%)
- Swedish: 271 (1.0%)
- Scottish: 253 (0.9%)
- Norwegian: 240 (0.8%)
- Dutch: 238 (0.8%)
- French: 208 (0.7%)
- Greek: 204 (0.7%)
- Northern European: 193 (0.7%)
- Canadian: 184 (0.6%)
- Scotch-Irish: 123 (0.4%)
- Croatian: 119 (0.4%)
- Ukrainian: 81 (0.3%)
- Syrian: 80 (0.3%)
- French Canadian: 80 (0.3%)
- British: 77 (0.3%)
- Armenian: 76 (0.3%)
- Danish: 69 (0.2%)
- Jamaican: 68 (0.2%)
- Estonian: 59 (0.2%)
- Czech: 55 (0.2%)
- Hungarian: 55 (0.2%)
- Russian: 55 (0.2%)
- Austrian: 44 (0.2%)
- Portuguese: 43 (0.2%)
- Slovak: 35 (0.1%)
- Welsh: 31 (0.1%)
- Scandinavian: 25 (0.09%)
- Lithuanian: 21 (0.07%)
- Finnish: 20 (0.07%)
- Pennsylvania German: 19 (0.07%)
- Lebanese: 19 (0.07%)
- Ghanaian: 18 (0.06%)
- Egyptian: 14 (0.05%)
- Romanian: 13 (0.05%)
- Slovene: 13 (0.05%)
- Trinidadian and Tobagonian: 12 (0.04%)
- Basque: 7 (0.02%)
- South African: 7 (0.02%)
- Afghan: 6 (0.02%)
- Haitian: 6 (0.02%)
- Belgian: 2 (0.01%)
Most common places of birth for foreign-born residents (%):
| San Clemente: | 28.4% (2,090) |
| California: | 37.2% (3,881,193) |
| San Clemente: | 8.7% (642) |
| California: | 5.2% (539,184) |
| San Clemente: | 8.1% (594) |
| California: | 2.0% (206,004) |
| San Clemente: | 5.3% (393) |
| California: | 7.8% (818,297) |
| San Clemente: | 4.0% (298) |
| California: | 1.2% (127,477) |
| San Clemente: | 3.6% (268) |
| California: | 0.6% (57,953) |
| San Clemente: | 3.1% (229) |
| California: | 0.2% (23,338) |
| San Clemente: | 2.8% (203) |
| California: | 0.7% (73,304) |
| San Clemente: | 1.7% (126) |
| California: | 0.3% (33,960) |
| San Clemente: | 1.7% (125) |
| California: | 1.7% (176,274) |
Place of birth for U.S.-born residents:
- This state: 36,867
- Other state: 17,985
- Northeast: 4,948
- Midwest: 5,229
- South: 4,322
- West: 3,514
88.3% of San Clemente residents lived in the same house 1 years ago.
Out of people who lived in different houses, 36.0% lived in this county.
Out of people who lived in different counties, 49.1% lived in California.
| San Clemente: | 88.3% |
| State average: | 88.9% |
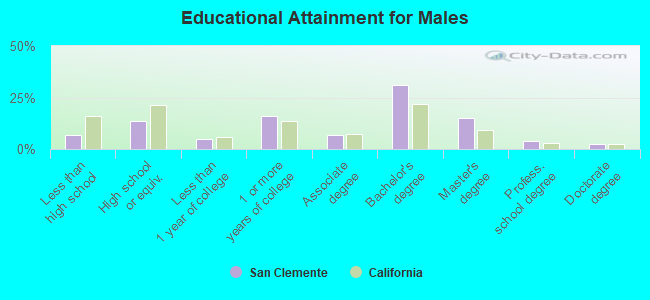
Education attainment for males 25 years and older:
- No schooling: 379
- Nursery to 4th grade: 183
- 5th and 6th grade: 113
- 7th and 8th grade: 160
- 9th grade: 105
- 10th grade: 70
- 11th grade: 74
- 12th grade, no diploma: 459
- High school graduate (or equivalency): 3,039
- Less than 1 year of college: 1,097
- Some college more than 1 year, no degree: 3,588
- Associate degree: 1,565
- Bachelor's degree: 7,030
- Master's degree: 3,365
- Professional school degree: 913
- Doctorate degree: 520
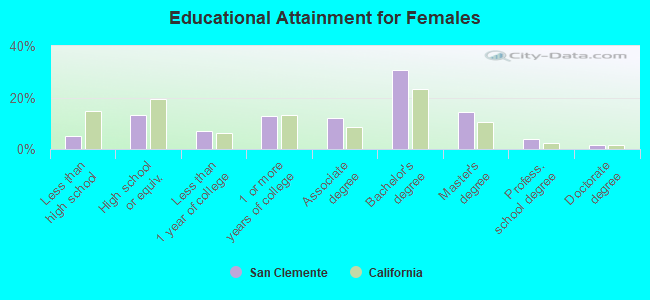
Education attainment for females 25 years and older:
- No schooling: 302
- Nursery to 4th grade: 183
- 5th and 6th grade: 192
- 7th and 8th grade: 139
- 9th grade: 82
- 10th grade: 23
- 11th grade: 111
- 12th grade, no diploma: 147
- High school graduate (or equivalency): 3,029
- Less than 1 year of college: 1,589
- Some college more than 1 year, no degree: 2,949
- Associate degree: 2,805
- Bachelor's degree: 7,101
- Master's degree: 3,317
- Professional school degree: 892
- Doctorate degree: 357
Housing units in structures:
- One, detached: 15,435
- One, attached: 3,378
- Two: 1,260
- 3 or 4: 2,692
- 5 to 9: 1,046
- 10 to 19: 1,161
- 20 to 49: 961
- 50 or more: 681
- Mobile homes: 323
- Boats, RVs, vans, etc.: 4
Median worth of mobile homes: $815,506
Housing units lacking complete kitchen facilities in 2022: 1.2%
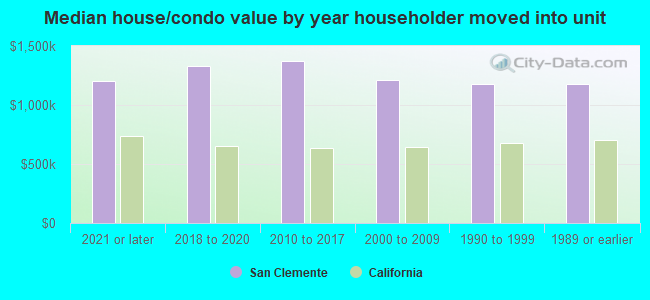
House/condo owner moved in on average 12 years ago
Renter moved in on average 3 years ago
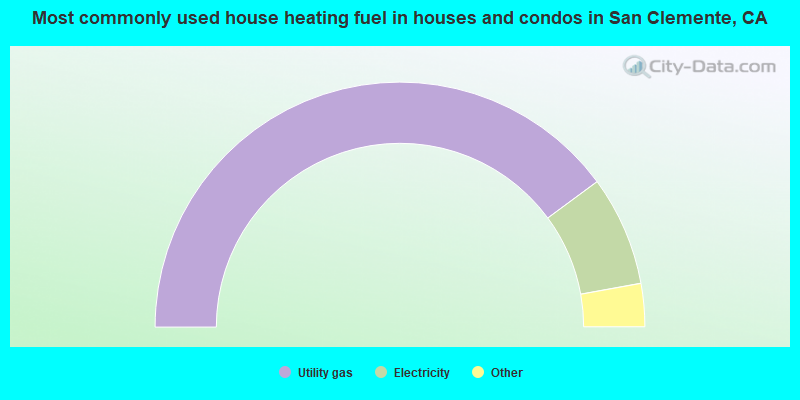
- 79.8%Utility gas
- 14.5%Electricity
- 2.6%Solar energy
- 1.8%No fuel used
- 1.0%Bottled, tank, or LP gas
- 0.2%Other fuel
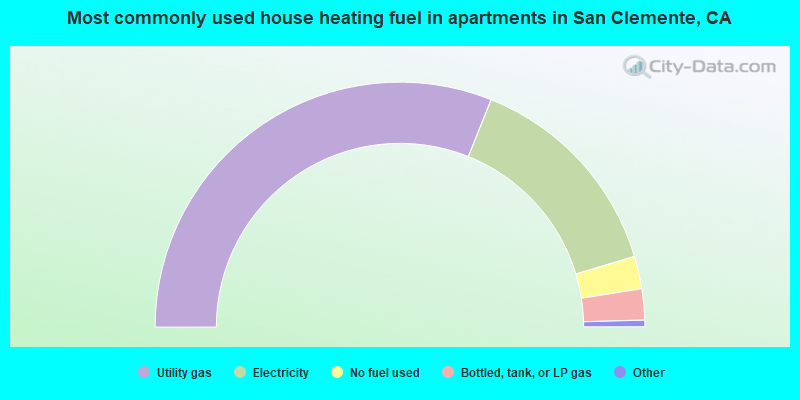
- 62.2%Utility gas
- 28.6%Electricity
- 4.3%No fuel used
- 4.1%Bottled, tank, or LP gas
- 0.4%Solar energy
- 0.3%Wood
- 0.2%Other fuel
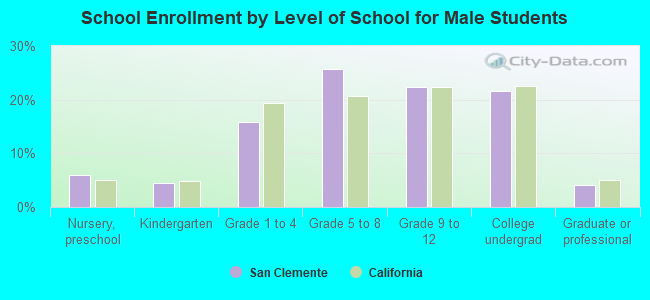
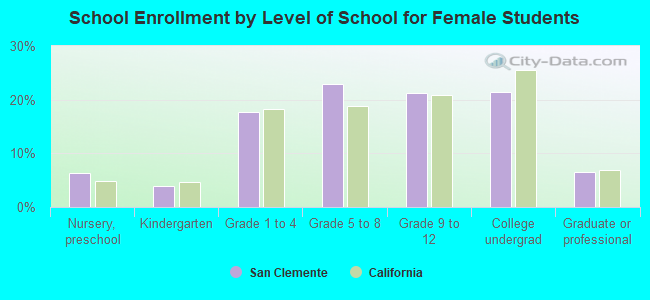
Private vs. public school enrollment:
| Here: | 20.3% |
| California: | 10.5% |
| Here: | 10.1% |
| California: | 8.5% |
| Here: | 10.4% |
| California: | 15.9% |