San Buenaventura (Ventura), CA (California) Houses and Residents
| San Buenaventura (Ventura): | $794,900 |
| California: | $715,900 |
Mean price in 2022:
Detached houses: $971,333
Here: $971,333 State: $988,808 Townhouses or other attached units: $601,493
Here: $601,493 State: $838,546 In 2-unit structures: $1,883,731
Here: $1,883,731 State: $1,138,100 In 3-to-4-unit structures: $543,280
Here: $543,280 State: $824,253 In 5-or-more-unit structures: $573,325
Here: $573,325 State: $730,996 Mobile homes: $319,216
Here: $319,216 State: $184,506 Occupied boats, RVs, vans, etc.: $6,040
Here: $6,040 State: $204,957
Total population: 109,484 (Urban population: 101,155, Rural population: 0)
Houses: 43,779 (41,937 occupied: 24,667 owner occupied, 17,270 renter occupied)
| % of renters here: | 41% |
| State: | 44% |
Housing density: 2,078 houses/condos per square mile
Median price asked for vacant for-sale houses and condos in 2022: $705,596.
Median contract rent in 2022: $1,906 (lower quartile is $1,448, upper quartile is over $2,000)
Median rent asked for vacant for-rent units in 2022: $1,653
Median gross rent in San Buenaventura (Ventura), CA in 2022: $1,966
Housing units in San Buenaventura (Ventura) with a mortgage: 16,953 (1,247 second mortgage, 0 home equity loan, 871 both second mortgage and home equity loan)
Houses without a mortgage: 155
Median household income for houses/condos with a mortgage: $140,259
Median household income for apartments without a mortgage: $77,667
Median monthly housing costs: $1,997
Compare current foreclosures near San Buenaventura (Ventura), CA:
| Photo | Address | Area | Beds / Baths | Price | Details |
|---|---|---|---|---|---|

|
#1
Islander Walk
Oxnard, CA 93035
|
1,283 sq. feet
|
2 baths 2 beds |
show details | |

|
#2
Green River St
Oxnard, CA 93036
|
1,556 sq. feet
|
2 baths 4 beds |
show details | |

|
#3
Ribera Dr
Oxnard, CA 93030
|
2,419 sq. feet
|
3 baths 4 beds |
show details | |

|
#4
Kumquat Pl
Oxnard, CA 93036
|
1,860 sq. feet
|
2 baths 5 beds |
show details | |

|
#5
Dove Canyon Dr
Oxnard, CA 93036
|
4,257 sq. feet
|
3 baths 5 beds |
show details | |

|
#6
Center Ln
Santa Paula, CA 93060
|
1,250 sq. feet
|
2 baths 3 beds |
show details | |

|
#7
Utica Ave
Ventura, CA 93004
|
1,354 sq. feet
|
2 baths 4 beds |
show details | |

|
#8
Lookout Dr
Oxnard, CA 93035
|
1,950 sq. feet
|
2 baths 4 beds |
show details | |

|
#9
Kern St
Oxnard, CA 93033
|
1,233 sq. feet
|
2 baths 4 beds |
show details | |

|
#10
Callas Dr
Oxnard, CA 93035
|
2,469 sq. feet
|
3 baths 5 beds |
show details |
| Photo | Address | Area | Beds / Baths | Price | Details |
|---|---|---|---|---|---|

|
#11
Rudder Ave
Port Hueneme, CA 93041
|
806 sq. feet
|
1 baths 2 beds |
show details | |

|
#12
Joliet Pl
Oxnard, CA 93030
|
1,268 sq. feet
|
2 baths 3 beds |
show details | |

|
#13
S Padre Juan Ave
Ojai, CA 93023
|
1,057 sq. feet
|
1 baths 1 beds |
show details | |

|
#14
Hughes Dr
Oxnard, CA 93033
|
1,192 sq. feet
|
1 baths 3 beds |
show details | |

|
#15
Sycamore St
Santa Paula, CA 93060
|
720 sq. feet
|
1 baths 2 beds |
show details | |

|
#16
N Hayes Ave
Oxnard, CA 93030
|
1,044 sq. feet
|
1 baths 3 beds |
show details | |

|
#17
Saratoga Ave Unit 1201
Ventura, CA 93003
|
1,250 sq. feet
|
2 baths 4 beds |
show details | |

|
#18
Canal St
Oxnard, CA 93035
|
2,504 sq. feet
|
3 baths 3 beds |
show details | |

|
#19
E Orchard St
Santa Paula, CA 93060
|
1,239 sq. feet
|
2 baths 3 beds |
show details | |

|
#20
Corte Primavera
Oxnard, CA 93030
|
1,074 sq. feet
|
2 baths 3 beds |
show details |
| Photo | Address | Area | Beds / Baths | Price | Details |
|---|---|---|---|---|---|

|
#21
Primrose Dr
Ventura, CA 93001
|
1,066 sq. feet
|
2 baths 3 beds |
show details | |

|
#22
Hill St
Oxnard, CA 93035
|
1,744 sq. feet
|
2 baths 5 beds |
show details | |

|
#23
Bordeaux Ave
Camarillo, CA 93010
|
1,956 sq. feet
|
2 baths 4 beds |
show details | |

|
#24
Torero Dr
Oxnard, CA 93030
|
2,717 sq. feet
|
3 baths 4 beds |
show details | |

|
#25
E Pleasant St
Santa Paula, CA 93060
|
1,997 sq. feet
|
1 baths 3 beds |
show details | |

|
#26
N I St
Oxnard, CA 93030
|
1,258 sq. feet
|
2 baths 3 beds |
show details | |

|
#27
Hill St
Oxnard, CA 93035
|
2,594 sq. feet
|
2 baths 4 beds |
show details | |

|
#28
Harbour Island Ln
Oxnard, CA 93035
|
2,663 sq. feet
|
2 baths 2 beds |
show details | |

|
#29
Orange Dr
Oxnard, CA 93036
|
1,344 sq. feet
|
2 baths 3 beds |
show details | |

|
#30
Maria Ln
Camarillo, CA 93010
|
2,596 sq. feet
|
3 baths 3 beds |
show details |
| Photo | Address | Area | Beds / Baths | Price | Details |
|---|---|---|---|---|---|

|
#31
1/2 Sycamore St
Santa Paula, CA 93060
|
720 sq. feet
|
1 baths 2 beds |
show details | |

|
#32
W Cedar St
Oxnard, CA 93033
|
1,050 sq. feet
|
1 baths 3 beds |
show details | |

|
#33
S G St # 321
Oxnard, CA 93030
|
1,008 sq. feet
|
1 baths 3 beds |
show details | |

|
#34
Nyeland Ave
Oxnard, CA 93036
|
960 sq. feet
|
7 baths 3 beds |
show details | |

|
#35
Hill St
Oxnard, CA 93035
|
2,594 sq. feet
|
2 baths 4 beds |
show details | |

|
#36
Moby Dick Ln
Oxnard, CA 93030
|
1,583 sq. feet
|
2 baths 3 beds |
show details | |

|
#37
Miramar Walk
Oxnard, CA 93035
|
1,189 sq. feet
|
1 baths 3 beds |
show details | |

|
#38
Callas Dr
Oxnard, CA 93035
|
2,469 sq. feet
|
2 baths 5 beds |
show details | |

|
#39
Navarro St
Oxnard, CA 93030
|
1,066 sq. feet
|
1 baths 3 beds |
show details | |

|
#40
Miramar Walk
Oxnard, CA 93035
|
1,148 sq. feet
|
2 baths 3 beds |
show details |
| Photo | Address | Area | Beds / Baths | Price | Details |
|---|---|---|---|---|---|

|
#41
Mandalay Beach Rd
Oxnard, CA 93035
|
2,914 sq. feet
|
2 baths 3 beds |
show details | |

|
#42
Kohala St
Oxnard, CA 93030
|
2,310 sq. feet
|
3 baths 5 beds |
show details | |

|
#43
Fathom Dr
Oxnard, CA 93035
|
1,178 sq. feet
|
2 baths 3 beds |
show details | |

|
#44
Taxco Ct
Camarillo, CA 93010
|
1,273 sq. feet
|
2 baths 3 beds |
show details | |

|
#45
Taxco Ct
Camarillo, CA 93010
|
1,273 sq. feet
|
2 baths 3 beds |
show details | |

|
#46
Canal St
Oxnard, CA 93035
|
2,028 sq. feet
|
2 baths 4 beds |
show details | |

|
#47
Cesar Chavez Dr
Oxnard, CA 93030
|
2,399 sq. feet
|
3 baths 4 beds |
show details | |

|
#48
Euclid Ave
Camarillo, CA 93010
|
1,483 sq. feet
|
2 baths 2 beds |
show details | |

|
#49
Tradewinds Dr
Oxnard, CA 93035
|
1,734 sq. feet
|
2 baths 2 beds |
show details | |

|
Check over 1 million property listings on Foreclosure.com!
|
browse all offers | |||


Median year apartment built: 1973
Household type by relationship:
Households: 109,528- Male householders: 19,532 (4,975 living alone), Female householders: 22,405 (6,419 living alone)
20,407 spouses (20,232 opposite-sex spouses), 4,045 unmarried partners, (3,704 opposite-sex unmarried partners), 31,020 children (29,583 natural, 885 adopted, 552 stepchildren), 2,202 grandchildren, 305 brothers or sisters, 1,452 parents, 0 foster children, 1,419 other relatives, 4,150 non-relatives
- In group quarters: 2,591
Size of family households: 10,991 2-persons, 5,757 3-persons, 6,706 4-persons, 1,945 5-persons, 386 6-persons, 504 7-or-more-persons.
Size of nonfamily households: 11,394 1-person, 3,548 2-persons, 235 3-persons, 428 4-persons, 43 5-persons.
13,269 married couples with children.
5,256 single-parent households (2,047 men, 3,209 women).
74.5% of residents of San Buenaventura (Ventura) speak English at home.
18.3% of residents speak Spanish at home (68% speak English very well, 15% speak English well, 11% speak English not well, 7% don't speak English at all).
3.5% of residents speak other Indo-European language at home (87% speak English very well, 10% speak English well, 3% speak English not well).
2.3% of residents speak Asian or Pacific Island language at home (64% speak English very well, 22% speak English well, 13% speak English not well).
1.0% of residents speak other language at home (31% speak English very well, 32% speak English well, 25% speak English not well, 11% don't speak English at all).
Foreign born population: 14,007 (12.8%)
(51.6% of them are naturalized citizens)
| Here: | 6.1 |
| State: | 6.0 |
| Here: | 3.8 |
| State: | 3.9 |

- Bedrooms in owner-occupied houses and condos in San Buenaventura (Ventura), California
- 77no bedroom
- 7401 bedroom
- 4,6792 bedrooms
- 10,2623 bedrooms
- 7,5744 bedrooms
- 1,3355+ bedrooms

- Bedrooms in renter-occupied apartments in San Buenaventura (Ventura), California
- 1,287no bedroom
- 5,0271 bedroom
- 7,3042 bedrooms
- 2,8463 bedrooms
- 8064 bedrooms
- 05+ bedrooms

- Cars and other vehicles available in San Buenaventura (Ventura) in owner-occupied houses/condos
- 310no vehicle
- 6,1601 vehicle
- 10,2652 vehicles
- 4,6363 vehicles
- 2,2364 vehicles
- 1,0605+ vehicles

- Cars and other vehicles available in San Buenaventura (Ventura) in renter-occupied apartments
- 1,250no vehicle
- 7,4581 vehicle
- 6,5752 vehicles
- 1,4863 vehicles
- 5014 vehicles
- 05+ vehicles

- Rooms in owner-occupied houses in San Buenaventura (Ventura), California
- 771 room
- 302 rooms
- 6203 rooms
- 2,6684 rooms
- 4,5635 rooms
- 6,8136 rooms
- 4,1677 rooms
- 2,8838 rooms
- 2,8469+ rooms

- Rooms in renter-occupied apartments in San Buenaventura (Ventura), California
- 1,2871 room
- 1,4772 rooms
- 4,3623 rooms
- 4,8054 rooms
- 2,5795 rooms
- 1,8456 rooms
- 4627 rooms
- 2768 rooms
- 1779+ rooms


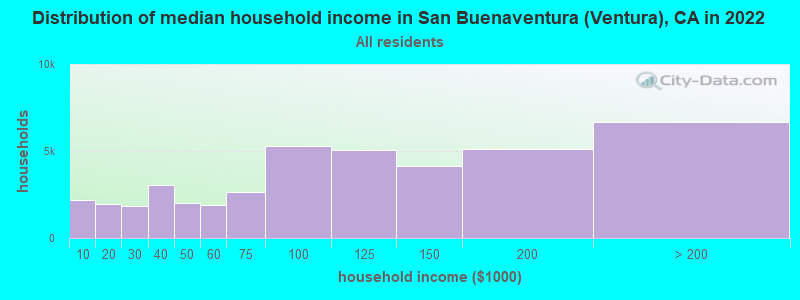
San Buenaventura (Ventura), CA household income distribution

- 2,218Less than $10,000
- 1,988$10,000 to $19,999
- 1,838$20,000 to $29,999
- 3,031$30,000 to $39,999
- 2,034$40,000 to $49,999
- 1,882$50,000 to $59,999
- 2,667$60,000 to $74,999
- 5,289$75,000 to $99,999
- 5,070$100,000 to $124,999
- 4,121$125,000 to $149,999
- 5,114$150,000 to $199,999
- 6,685$200,000 or more
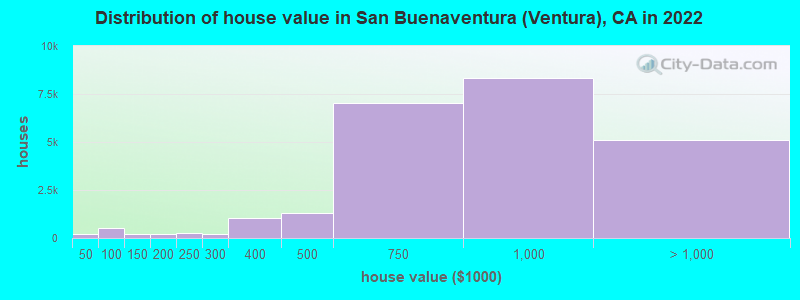
Home value of owner - occupied houses in 2022 in San Buenaventura (Ventura), CA
-
- 108Less than $10,000
- 21$10,000 to $14,999
- 6$15,000 to $19,999
- 14$25,000 to $29,999
- 37$30,000 to $34,999
- 18$40,000 to $49,999
- 63$50,000 to $59,999
- 78$60,000 to $69,999
- 179$70,000 to $79,999
- 99$80,000 to $89,999
- 86$90,000 to $99,999
- 98$100,000 to $124,999
- 104$125,000 to $149,999
- 76$150,000 to $174,999
- 109$175,000 to $199,999
- 277$200,000 to $249,999
- 193$250,000 to $299,999
- 1,018$300,000 to $399,999
- 1,293$400,000 to $499,999
- 7,037$500,000 to $749,999
- 8,311$750,000 to $999,999
- 3,677$1,000,000 to $1,499,999
- 731$1,500,000 to $1,999,999
- 698$2,000,000 or more
Rent paid by renters in 2022 in San Buenaventura (Ventura), CA
-
- 236Less than $100
- 29$150 to $199
- 218$200 to $249
- 311$250 to $299
- 158$300 to $349
- 336$350 to $399
- 192$400 to $449
- 54$450 to $499
- 114$500 to $549
- 82$550 to $599
- 286$600 to $649
- 129$650 to $699
- 14$700 to $749
- 104$750 to $799
- 133$800 to $899
- 171$900 to $999
- 1,096$1,000 to $1,249
- 1,743$1,250 to $1,499
- 4,956$1,500 to $1,999
- 3,919$2,000 to $2,499
- 1,850$2,500 to $2,999
- 741$3,000 to $3,499
- 735$3,500 or more
- 258No cash rent


Percentage of workers working in this county: 84.7%
Number of people working at home: 8,494 (14.9% of all workers)
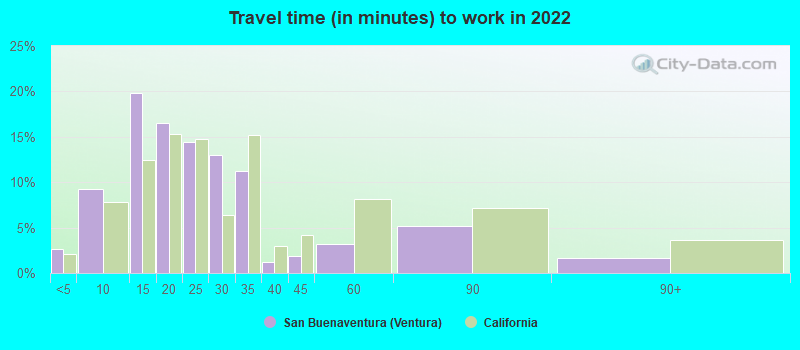
Travel time to work (commute)
- Less than 5 minutes: 1,260
- 5 to 9 minutes: 5,666
- 10 to 14 minutes: 9,033
- 15 to 19 minutes: 8,407
- 20 to 24 minutes: 5,060
- 25 to 29 minutes: 5,005
- 30 to 34 minutes: 5,410
- 35 to 39 minutes: 1,017
- 40 to 44 minutes: 1,906
- 45 to 59 minutes: 1,923
- 60 to 89 minutes: 2,356
- 90 or more minutes: 1,457
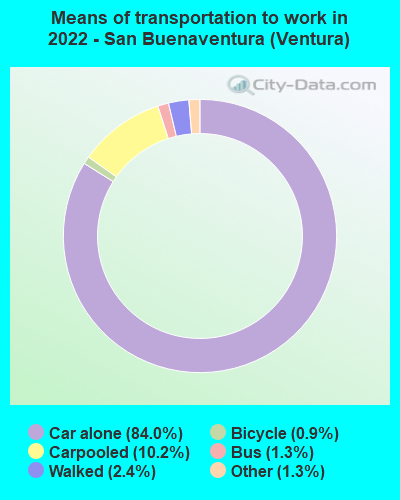
Means of transportation to work:
- Drove a car alone: 46,679 (72.9%)
- Carpooled: 5,643 (8.8%)
- Bus: 702 (1.1%)
- Taxi: 716 (1.1%)
- Bicycle: 478 (0.7%)
- Walked: 1,343 (2.1%)
- Worked at home: 8,494 (13.3%)

- Unemployment by race in 2022
- Unemployment rate for White non-Hispanic residents
- 2.5%Males
- 2.2%Females
- Unemployment rate for Black residents
- 5.7%Males
- 12.1%Females
- Unemployment rate for American Indian and Alaska Native residents
- 2.2%Females
- Unemployment rate for Asian residents
- 1.5%Males
- 6.4%Females
- Unemployment rate for other race residents
- 1.0%Males
- 7.9%Females
- Unemployment rate for two or more race residents
- 4.7%Males
- 2.8%Females
- Unemployment rate for Hispanic or Latino residents
- 1.4%Males
- 0.9%Females

- Year of entry for the foreign-born population in San Buenaventura (Ventura), California
- 3,3952010 or later
- 3,2162000 to 2009
- 2,3711990 to 1999
- 3,5311980 to 1989
- 2,4021970 to 1979
- 2,897Before 1970

First ancestries reported:
- American: 4,211 (8.0%)
- German: 3,263 (6.2%)
- English: 3,260 (6.2%)
- Irish: 2,715 (5.2%)
- Italian: 1,823 (3.5%)
- European: 1,733 (3.3%)
- Norwegian: 578 (1.1%)
- Scottish: 536 (1.0%)
- French: 450 (0.9%)
- Scotch-Irish: 427 (0.8%)
- Polish: 367 (0.7%)
- Iranian: 353 (0.7%)
- Dutch: 351 (0.7%)
- Eastern European: 290 (0.6%)
- Swedish: 284 (0.5%)
- Czech: 271 (0.5%)
- Syrian: 271 (0.5%)
- British: 199 (0.4%)
- Russian: 185 (0.4%)
- Egyptian: 179 (0.3%)
- Danish: 172 (0.3%)
- Arab: 163 (0.3%)
- Scandinavian: 163 (0.3%)
- French Canadian: 131 (0.2%)
- Northern European: 123 (0.2%)
- Portuguese: 123 (0.2%)
- Canadian: 109 (0.2%)
- Lithuanian: 98 (0.2%)
- Romanian: 98 (0.2%)
- Albanian: 95 (0.2%)
- Austrian: 81 (0.2%)
- South African: 77 (0.1%)
- Welsh: 77 (0.1%)
- Ukrainian: 72 (0.1%)
- Greek: 70 (0.1%)
- Brazilian: 68 (0.1%)
- Israeli: 63 (0.1%)
- Swiss: 57 (0.1%)
- Turkish: 57 (0.1%)
- Armenian: 53 (0.1%)
- Hungarian: 53 (0.1%)
- Barbadian: 41 (0.08%)
- Latvian: 37 (0.07%)
- Maltese: 29 (0.06%)
- Czechoslovakian: 29 (0.06%)
- Finnish: 25 (0.05%)
- Basque: 22 (0.04%)
- Moroccan: 21 (0.04%)
- Icelander: 20 (0.04%)
- Croatian: 19 (0.04%)
- Slovak: 17 (0.03%)
- Nigerian: 17 (0.03%)
- Yugoslavian: 17 (0.03%)
- Serbian: 15 (0.03%)
- Lebanese: 10 (0.02%)
- Jordanian: 9 (0.02%)
- Australian: 9 (0.02%)
- Slavic: 8 (0.02%)
- Pennsylvania German: 8 (0.02%)
- African: 8 (0.02%)
- Palestinian: 6 (0.01%)
- German Russian: 3 (0.01%)
Most common places of birth for foreign-born residents (%):
| San Buenaventura (Ventura): | 48.7% (7,207) |
| California: | 37.2% (3,881,193) |
| San Buenaventura (Ventura): | 5.4% (796) |
| California: | 7.8% (818,297) |
| San Buenaventura (Ventura): | 3.4% (502) |
| California: | 6.6% (684,672) |
| San Buenaventura (Ventura): | 2.7% (398) |
| California: | 5.2% (539,184) |
| San Buenaventura (Ventura): | 2.6% (381) |
| California: | 1.2% (127,477) |
| San Buenaventura (Ventura): | 2.5% (363) |
| California: | 0.5% (55,249) |
| San Buenaventura (Ventura): | 2.4% (353) |
| California: | 4.9% (512,335) |
| San Buenaventura (Ventura): | 2.4% (352) |
| California: | 4.2% (440,287) |
| San Buenaventura (Ventura): | 2.1% (310) |
| California: | 0.3% (30,949) |
| San Buenaventura (Ventura): | 1.9% (276) |
| California: | 0.7% (73,304) |
| San Buenaventura (Ventura): | 1.8% (272) |
| California: | 3.0% (315,248) |
| San Buenaventura (Ventura): | 1.7% (252) |
| California: | 0.4% (42,718) |
Place of birth for U.S.-born residents:
- This state: 68,116
- Other state: 25,845
- Northeast: 7,286
- Midwest: 8,580
- South: 3,739
- West: 6,240
87.7% of San Buenaventura (Ventura) residents lived in the same house 1 years ago.
Out of people who lived in different houses, 39.8% lived in this county.
Out of people who lived in different counties, 78.7% lived in California.
| San Buenaventura (Ventura): | 87.7% |
| State average: | 88.9% |
Education attainment for males 25 years and older:
- No schooling: 822
- Nursery to 4th grade: 0
- 5th and 6th grade: 579
- 7th and 8th grade: 0
- 9th grade: 676
- 10th grade: 114
- 11th grade: 540
- 12th grade, no diploma: 591
- High school graduate (or equivalency): 6,671
- Less than 1 year of college: 3,681
- Some college more than 1 year, no degree: 5,399
- Associate degree: 3,241
- Bachelor's degree: 11,583
- Master's degree: 4,140
- Professional school degree: 1,543
- Doctorate degree: 347

Education attainment for females 25 years and older:
- No schooling: 957
- Nursery to 4th grade: 261
- 5th and 6th grade: 535
- 7th and 8th grade: 319
- 9th grade: 0
- 10th grade: 0
- 11th grade: 224
- 12th grade, no diploma: 423
- High school graduate (or equivalency): 5,850
- Less than 1 year of college: 3,100
- Some college more than 1 year, no degree: 5,282
- Associate degree: 4,851
- Bachelor's degree: 12,082
- Master's degree: 4,518
- Professional school degree: 896
- Doctorate degree: 720


Housing units in structures:
- One, detached: 23,856
- One, attached: 4,848
- Two: 1,232
- 3 or 4: 2,671
- 5 to 9: 2,656
- 10 to 19: 1,947
- 20 to 49: 2,030
- 50 or more: 2,070
- Mobile homes: 2,392
- Boats, RVs, vans, etc.: 77
Median worth of mobile homes: $239,300
House/condo owner moved in on average 14 years ago
Renter moved in on average 4 years ago

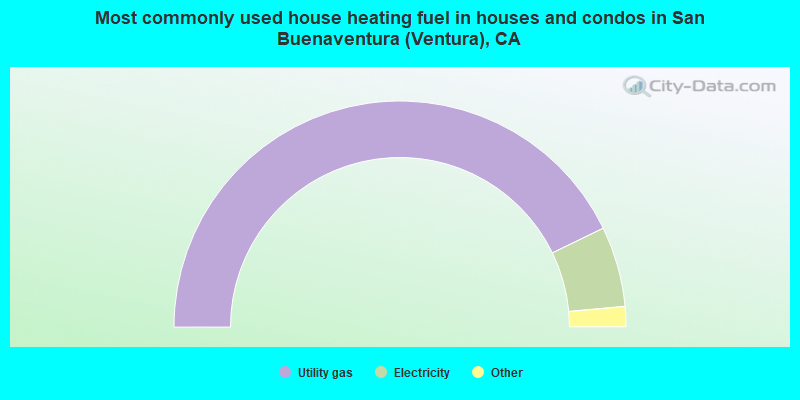
- 85.6%Utility gas
- 11.5%Electricity
- 1.4%No fuel used
- 0.9%Bottled, tank, or LP gas
- 0.3%Wood
- 0.2%Solar energy
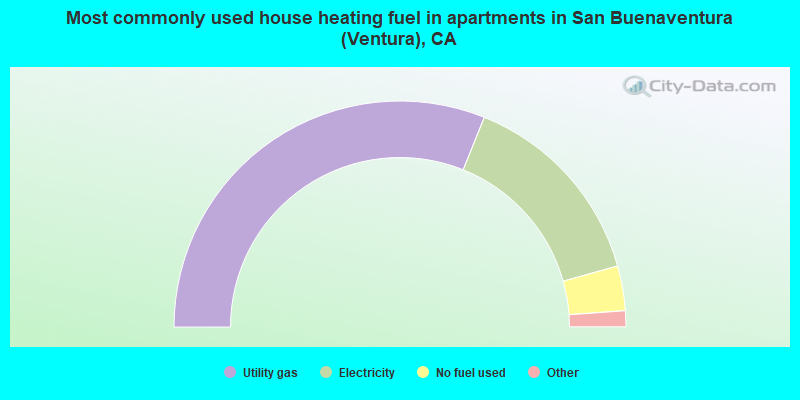
- 62.2%Utility gas
- 29.1%Electricity
- 6.4%No fuel used
- 0.9%Bottled, tank, or LP gas
- 0.7%Other fuel
- 0.5%Wood
- 0.1%Solar energy
Private vs. public school enrollment:
| Here: | 15.6% |
| California: | 10.5% |
| Here: | 0.7% |
| California: | 8.5% |
| Here: | 8.1% |
| California: | 15.9% |


