Housing density: 3,022 houses/condos per square mile
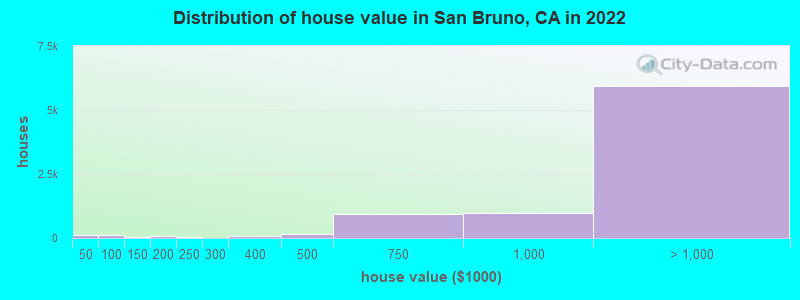
Median price asked for vacant for-sale houses and condos in 2022: $1,757,095.
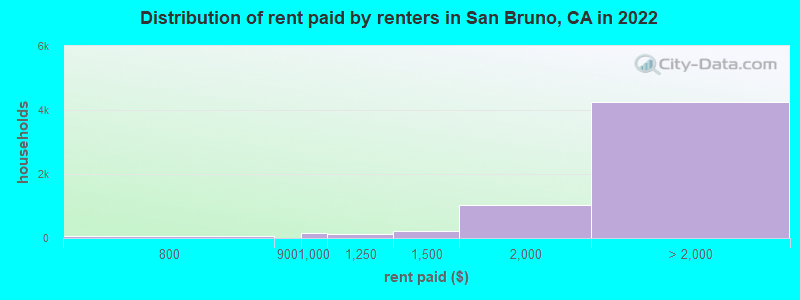
Median contract rent in 2022: over $2,000 (lower quartile is $1,892, upper quartile is over $2,000)
Median rent asked for vacant for-rent units in 2022: $3,611
Median gross rent in San Bruno, CA in 2022: over $2,000
Housing units in San Bruno with a mortgage: 6,206 (875 second mortgage, 24 home equity loan, 829 both second mortgage and home equity loan) Houses without a mortgage: 138
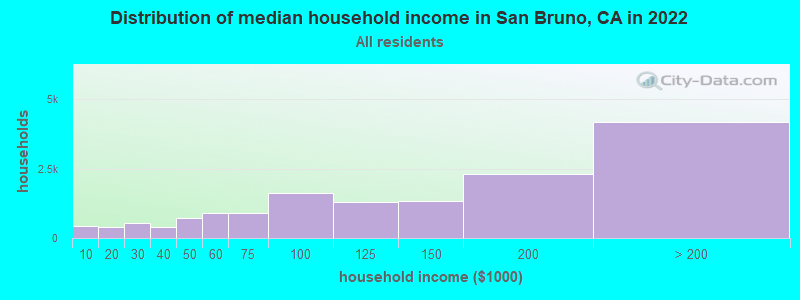
Median household income for houses/condos with a mortgage: $175,341
Median household income for apartments without a mortgage: $100,411
4,864 married couples with children.
1,646 single-parent households (564 men, 1,082 women).
51.1% of residents of San Bruno speak English at home.
19.4% of residents speak Spanish at home (52% speak English very well, 25% speak English well, 20% speak English not well, 4% don't speak English at all).
7.9% of residents speak other Indo-European language at home (74% speak English very well, 17% speak English well, 7% speak English not well, 3% don't speak English at all).
20.5% of residents speak Asian or Pacific Island language at home (62% speak English very well, 26% speak English well, 9% speak English not well, 4% don't speak English at all).
0.7% of residents speak other language at home (80% speak English very well, 19% speak English well, 1% speak English not well).
Foreign born population: 15,853 (37.9%)
(59.2% of them are naturalized citizens)
Percentage of workers working in this county: 70.6% Number of people working at home: 4,348 (19.6% of all workers)
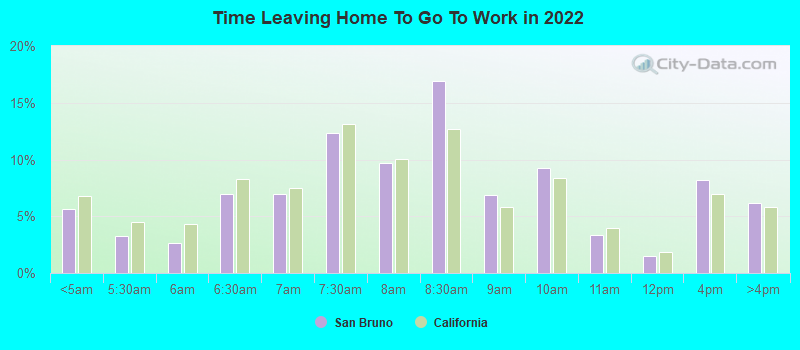
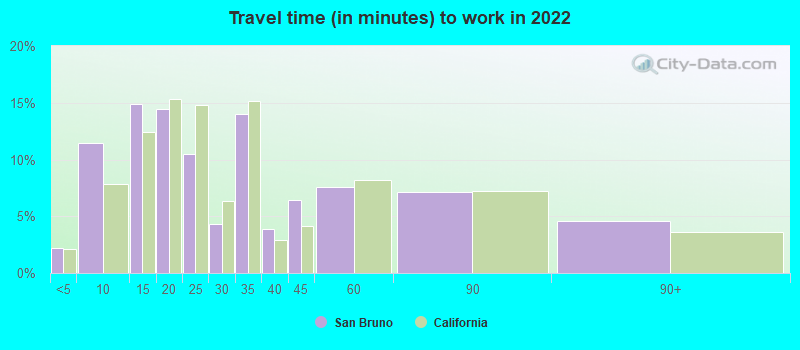
Travel time to work (commute)
Less than 5 minutes: 292
5 to 9 minutes: 1,700
10 to 14 minutes: 2,869
15 to 19 minutes: 2,799
20 to 24 minutes: 2,415
25 to 29 minutes: 979
30 to 34 minutes: 2,980
35 to 39 minutes: 580
40 to 44 minutes: 1,057
45 to 59 minutes: 1,097
60 to 89 minutes: 687
90 or more minutes: 178
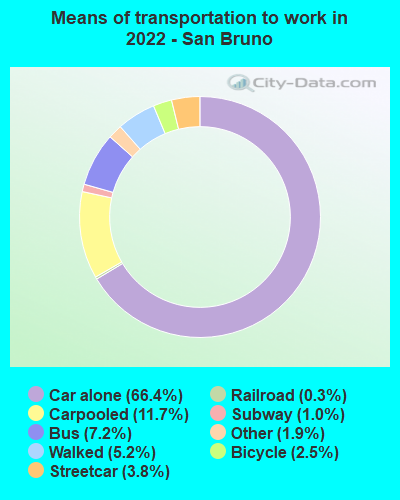
Means of transportation to work:
Drove a car alone: 8,414 (49.6%)
Carpooled: 1,621 (9.6%)
Bus: 815 (4.8%)
Subway or elevated rail: 382 (2.3%)
Long-distance train or commuter rail: 123 (0.7%)
Light rail, streetcar or trolley: 37 (0.2%)
Taxi: 192 (1.1%)
Bicycle: 360 (2.1%)
Walked: 748 (4.4%)
Worked at home: 4,348 (25.6%)
Unemployment by race in 2022
Unemployment rate for White non-Hispanic residents
4.8%Males
3.4%Females
Unemployment rate for Asian residents
1.6%Males
2.9%Females
Unemployment rate for other race residents
4.2%Males
3.5%Females
Unemployment rate for two or more race residents
6.2%Males
1.0%Females
Unemployment rate for Hispanic or Latino residents
3.4%Males
4.1%Females
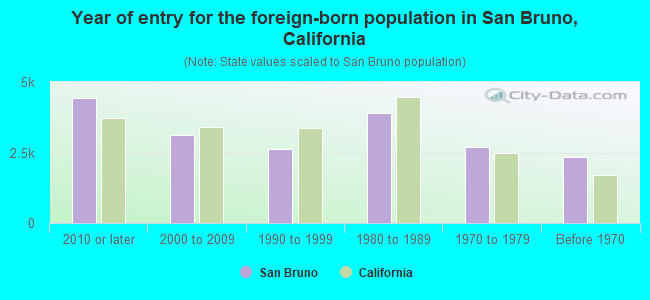
Year of entry for the foreign-born population in San Bruno, California
4,4492010 or later
3,1342000 to 2009
2,6141990 to 1999
3,8871980 to 1989
2,7041970 to 1979
2,325Before 1970
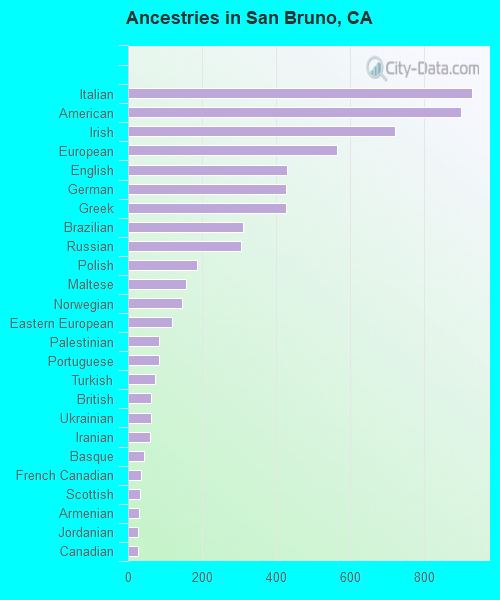
First ancestries reported:
Italian: 928 (3.4%)
American: 899 (3.3%)
Irish: 720 (2.6%)
European: 564 (2.1%)
English: 429 (1.6%)
German: 427 (1.6%)
Greek: 426 (1.6%)
Brazilian: 310 (1.1%)
Russian: 305 (1.1%)
Polish: 187 (0.7%)
Maltese: 156 (0.6%)
Norwegian: 146 (0.5%)
Eastern European: 119 (0.4%)
Palestinian: 85 (0.3%)
Portuguese: 84 (0.3%)
Turkish: 73 (0.3%)
British: 62 (0.2%)
Ukrainian: 62 (0.2%)
Iranian: 60 (0.2%)
Basque: 42 (0.2%)
French Canadian: 34 (0.1%)
Scottish: 33 (0.1%)
Armenian: 30 (0.1%)
Jordanian: 27 (0.10%)
Canadian: 27 (0.10%)
French: 27 (0.10%)
Dutch: 26 (0.10%)
Lithuanian: 23 (0.08%)
Swedish: 23 (0.08%)
Danish: 20 (0.07%)
Scotch-Irish: 20 (0.07%)
Finnish: 16 (0.06%)
Hungarian: 14 (0.05%)
Austrian: 14 (0.05%)
Israeli: 14 (0.05%)
Australian: 13 (0.05%)
African: 12 (0.04%)
Northern European: 11 (0.04%)
Slavic: 8 (0.03%)
Yugoslavian: 4 (0.01%)
Most common places of birth for foreign-born residents (%):
Philippines
San Bruno:
18.4% (2,959)
California:
7.8% (818,297)
Mexico
San Bruno:
14.1% (2,270)
California:
37.2% (3,881,193)
China, excluding Hong Kong and Taiwan
San Bruno:
11.3% (1,814)
California:
6.6% (684,672)
El Salvador
San Bruno:
9.4% (1,510)
California:
4.2% (440,287)
Hong Kong
San Bruno:
6.0% (971)
California:
1.0% (105,215)
India
San Bruno:
3.9% (630)
California:
5.2% (539,184)
Nicaragua
San Bruno:
3.9% (625)
California:
0.6% (58,161)
Oceania, n.e.c.
San Bruno:
2.2% (358)
California:
0.2% (18,925)
Brazil
San Bruno:
2.1% (339)
California:
0.5% (53,222)
Fiji
San Bruno:
2.1% (333)
California:
0.3% (33,937)
Pakistan
San Bruno:
2.0% (322)
California:
0.5% (49,399)
Taiwan
San Bruno:
2.0% (317)
California:
1.7% (176,274)
Korea
San Bruno:
1.6% (262)
California:
3.0% (315,248)
Place of birth for U.S.-born residents:
This state: 22,118
Other state: 3,255
Northeast: 967
Midwest: 1,003
South: 549
West: 757
88.4% of San Bruno residents lived in the same house 1 years ago. Out of people who lived in different houses, 35.4% lived in this county. Out of people who lived in different counties, 81.4% lived in California.
San Bruno:
88.4%
State average:
88.9%
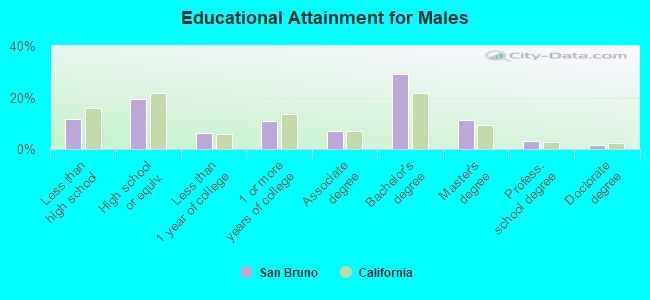
Education attainment for males 25 years and older:
No schooling: 680
Nursery to 4th grade: 116
5th and 6th grade: 248
7th and 8th grade: 119
9th grade: 113
10th grade: 46
11th grade: 229
12th grade, no diploma: 198
High school graduate (or equivalency): 2,884
Less than 1 year of college: 917
Some college more than 1 year, no degree: 1,607
Associate degree: 1,046
Bachelor's degree: 4,358
Master's degree: 1,690
Professional school degree: 449
Doctorate degree: 249
Education attainment for females 25 years and older:
No schooling: 336
Nursery to 4th grade: 189
5th and 6th grade: 204
7th and 8th grade: 118
9th grade: 78
10th grade: 85
11th grade: 106
12th grade, no diploma: 501
High school graduate (or equivalency): 3,070
Less than 1 year of college: 1,050
Some college more than 1 year, no degree: 1,566
Associate degree: 1,453
Bachelor's degree: 4,688
Master's degree: 1,503
Professional school degree: 550
Doctorate degree: 297
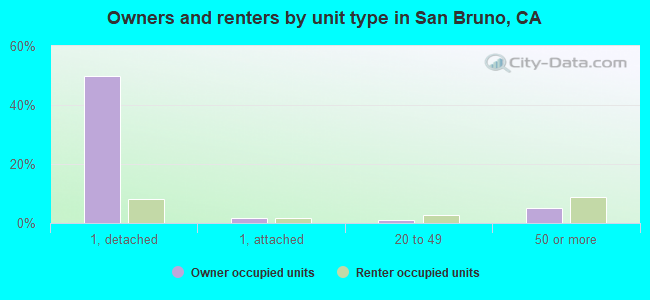
Housing units in structures:
One, detached: 9,505
One, attached: 530
Two: 272
3 or 4: 1,275
5 to 9: 1,335
10 to 19: 623
20 to 49: 655
50 or more: 2,237
Mobile homes: 67
Housing units lacking complete plumbing facilities in 2022: 0.6%
Housing units lacking complete kitchen facilities in 2022: 1.3%
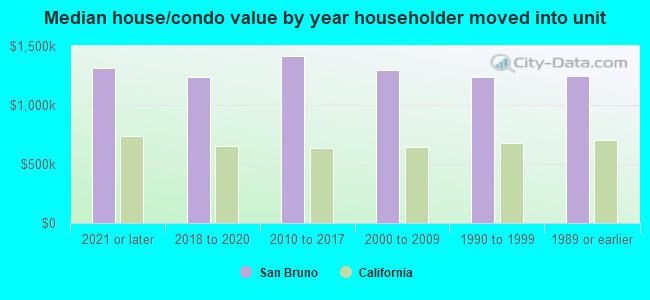
House/condo owner moved in on average 19 years ago