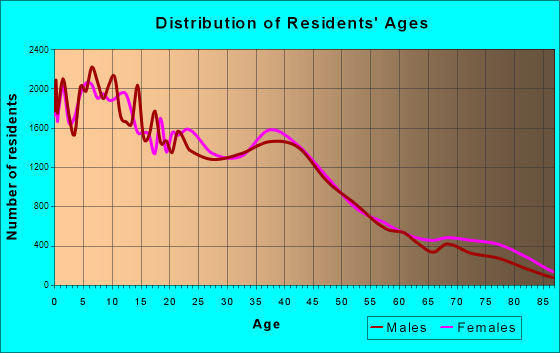
San Bernardino, CA (California) Houses and Residents
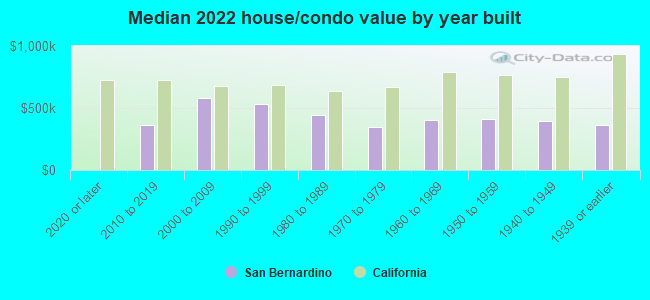
| San Bernardino: | $422,200 |
| California: | $715,900 |
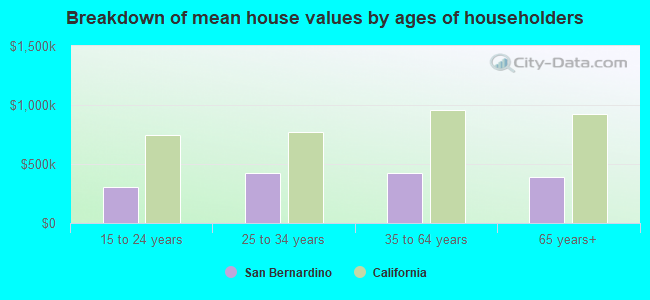
Mean price in 2022:
Detached houses: $444,219
Here: $444,219 State: $988,808 Townhouses or other attached units: $354,925
Here: $354,925 State: $838,546 In 2-unit structures: $514,251
Here: $514,251 State: $1,138,100 In 3-to-4-unit structures: $285,003
Here: $285,003 State: $824,253 In 5-or-more-unit structures: $299,230
Here: $299,230 State: $730,996 Mobile homes: $91,778
Here: $91,778 State: $184,506
Total population: 215,213 (Urban population: 184,626, Rural population: 762 (all nonfarm))
Houses: 68,352 (65,420 occupied: 31,465 owner occupied, 33,955 renter occupied)
| % of renters here: | 52% |
| State: | 44% |
Housing density: 1,162 houses/condos per square mile
Median price asked for vacant for-sale houses and condos in 2022: $397,204.
Median contract rent in 2022: $1,172 (lower quartile is $902, upper quartile is $1,485)
Median rent asked for vacant for-rent units in 2022: $1,407
Median gross rent in San Bernardino, CA in 2022: $1,349
Housing units in San Bernardino with a mortgage: 19,742 (1,281 second mortgage, 0 home equity loan, 850 both second mortgage and home equity loan)
Houses without a mortgage: 110
Median household income for houses/condos with a mortgage: $95,894
Median household income for apartments without a mortgage: $56,813
Median monthly housing costs: $1,376
Compare current foreclosures in San Bernardino, CA:
| Photo | Address | Area | Beds / Baths | Price | Details |
|---|---|---|---|---|---|

|
#1
Lincoln Dr
San Bernardino, CA 92405
|
775 sq. feet
|
1 baths 3 beds |
show details | |

|
#2
W 55th St
San Bernardino, CA 92407
|
1,710 sq. feet
|
2 baths 3 beds |
show details | |

|
#3
N Melvin Dr
San Bernardino, CA 92407
|
2,531 sq. feet
|
4 baths 3 beds |
show details | |

|
#4
Osbun Rd
San Bernardino, CA 92404
|
2,545 sq. feet
|
2 baths 5 beds |
show details | |

|
#5
Camellia Dr San Bernardino, Ca 92404-1530 Aka 4083 N Camellia Dr
San Bernardino, CA 92404
|
2,821 sq. feet
|
4 baths 3 beds |
show details | |

|
#6
Guthrie St
San Bernardino, CA 92404
|
1,963 sq. feet
|
2 baths 4 beds |
show details | |

|
#7
Rogers Ln
San Bernardino, CA 92410
|
1,885 sq. feet
|
2 baths 4 beds |
show details | |

|
#8
Echo Ct
San Bernardino, CA 92404
|
1,746 sq. feet
|
2 baths 3 beds |
show details | |

|
#9
W Marshall Blvd
San Bernardino, CA 92405
|
3,657 sq. feet
|
4 baths 5 beds |
show details | |

|
#10
Camellia Dr
San Bernardino, CA 92404
|
2,821 sq. feet
|
4 baths 3 beds |
show details |
| Photo | Address | Area | Beds / Baths | Price | Details |
|---|---|---|---|---|---|

|
#11
N Stoddard Ave
San Bernardino, CA 92407
|
1,068 sq. feet
|
1 baths 2 beds |
show details | |

|
#12
Split Mountain Ln
San Bernardino, CA 92407
|
2,963 sq. feet
|
2 baths 4 beds |
show details | |

|
#13
N F St
San Bernardino, CA 92405
|
- sq. feet
|
2 baths 3 beds |
show details | |

|
#14
S J St
San Bernardino, CA 92410
|
837 sq. feet
|
1 baths 2 beds |
show details | |

|
#15
N Allen St
San Bernardino, CA 92408
|
981 sq. feet
|
2 baths 3 beds |
show details | |

|
#16
N Pennsylvania Ave
San Bernardino, CA 92411
|
1,217 sq. feet
|
1 baths 3 beds |
show details | |

|
#17
W Hill Dr
San Bernardino, CA 92407
|
1,262 sq. feet
|
2 baths 3 beds |
show details | |

|
#18
N Mountain View Ave
San Bernardino, CA 92405
|
1,008 sq. feet
|
1 baths 2 beds |
show details | |

|
#19
E Marshall Blvd
San Bernardino, CA 92404
|
1,413 sq. feet
|
1 baths 3 beds |
show details | |

|
#20
Maple St
San Bernardino, CA 92410
|
1,207 sq. feet
|
2 baths 3 beds |
show details |
| Photo | Address | Area | Beds / Baths | Price | Details |
|---|---|---|---|---|---|

|
#21
N Macy St
San Bernardino, CA 92407
|
1,839 sq. feet
|
2 baths 4 beds |
show details | |

|
#22
Saint Elmo Dr
San Bernardino, CA 92410
|
1,140 sq. feet
|
2 baths 3 beds |
show details | |

|
#23
Magnolia Ave
San Bernardino, CA 92411
|
1,011 sq. feet
|
1 baths 3 beds |
show details | |

|
#24
Deer Creek Rd
San Bernardino, CA 92410
|
1,056 sq. feet
|
2 baths 3 beds |
show details | |

|
#25
Loma Ave
San Bernardino, CA 92404
|
825 sq. feet
|
1 baths 3 beds |
show details | |

|
#26
W Hill Dr
San Bernardino, CA 92407
|
1,262 sq. feet
|
1 baths 3 beds |
show details | |

|
#27
E 34th St
San Bernardino, CA 92404
|
947 sq. feet
|
1 baths 3 beds |
show details | |

|
#28
Paloma Rd
San Bernardino, CA 92410
|
980 sq. feet
|
1 baths 3 beds |
show details | |

|
#29
S Macy St Spc 130
San Bernardino, CA 92410
|
1,680 sq. feet
|
2 baths 3 beds |
show details | |

|
#30
Donald St
San Bernardino, CA 92407
|
1,320 sq. feet
|
2 baths 4 beds |
show details |
| Photo | Address | Area | Beds / Baths | Price | Details |
|---|---|---|---|---|---|

|
#31
E 29th St
San Bernardino, CA 92404
|
850 sq. feet
|
1 baths 3 beds |
show details | |

|
#32
W Edgehill Rd Apt 17
San Bernardino, CA 92405
|
801 sq. feet
|
1 baths 2 beds |
show details | |

|
#33
Split Mountain Ln
San Bernardino, CA 92407
|
2,963 sq. feet
|
2 baths 4 beds |
show details | |

|
#34
E 9th St Spc 154
San Bernardino, CA 92410
|
520 sq. feet
|
1 baths 2 beds |
show details | |

|
#35
Elm St
San Bernardino, CA 92410
|
1,280 sq. feet
|
1 baths 3 beds |
show details | |

|
#36
Fisher St
San Bernardino, CA 92404
|
1,165 sq. feet
|
1 baths 2 beds |
show details | |

|
#37
E Carol Way
San Bernardino, CA 92408
|
1,763 sq. feet
|
3 baths 4 beds |
show details | |

|
#38
E 23rd St
San Bernardino, CA 92404
|
1,325 sq. feet
|
1 baths 2 beds |
show details | |

|
#39
Modesto Dr
San Bernardino, CA 92404
|
1,012 sq. feet
|
1 baths 3 beds |
show details | |

|
#40
W Edgehill Rd Apt 17
San Bernardino, CA 92405
|
801 sq. feet
|
1 baths 2 beds |
show details |
| Photo | Address | Area | Beds / Baths | Price | Details |
|---|---|---|---|---|---|

|
#41
E Manchester Ln
San Bernardino, CA 92408
|
2,161 sq. feet
|
3 baths 5 beds |
show details | |

|
#42
W Highland Ave Spc 45
San Bernardino, CA 92411
|
660 sq. feet
|
1 baths 2 beds |
show details | |

|
#43
N Stoddard Ave
San Bernardino, CA 92407
|
1,466 sq. feet
|
1 baths 2 beds |
show details | |

|
#44
W 48th St Unit 53
San Bernardino, CA 92407
|
1,400 sq. feet
|
2 baths 3 beds |
show details | |

|
#45
E 33rd St
San Bernardino, CA 92404
|
1,368 sq. feet
|
2 baths 3 beds |
show details | |

|
#46
Canyon Rd
San Bernardino, CA 92404
|
1,329 sq. feet
|
2 baths 4 beds |
show details | |

|
#47
Big Horn Mountain Rd
San Bernardino, CA 92410
|
1,248 sq. feet
|
2 baths 3 beds |
show details | |

|
#48
Acre Ln
San Bernardino, CA 92407
|
1,576 sq. feet
|
2 baths 5 beds |
show details | |

|
#49
W 5th St
San Bernardino, CA 92410
|
1,744 sq. feet
|
2 baths 3 beds |
show details | |

|
Check over 1 million property listings on Foreclosure.com!
|
browse all offers | |||


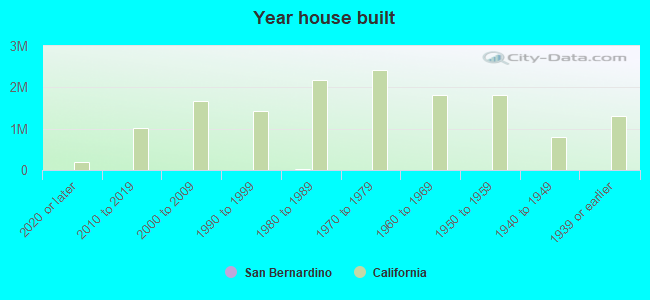
Median year apartment built: 1979
Household type by relationship:
Households: 220,314- Male householders: 29,727 (5,800 living alone), Female householders: 35,693 (6,868 living alone)
28,666 spouses (28,541 opposite-sex spouses), 7,945 unmarried partners, (7,844 opposite-sex unmarried partners), 77,216 children (75,529 natural, 438 adopted, 1,249 stepchildren), 8,718 grandchildren, 6,687 brothers or sisters, 5,150 parents, 216 foster children, 8,652 other relatives, 6,382 non-relatives
- In group quarters: 5,262
Size of family households: 13,572 2-persons, 9,338 3-persons, 10,182 4-persons, 7,953 5-persons, 3,579 6-persons, 3,296 7-or-more-persons.
Size of nonfamily households: 12,668 1-person, 3,978 2-persons, 322 3-persons, 299 4-persons, 233 6-persons.
26,311 married couples with children.
20,162 single-parent households (5,640 men, 14,522 women).
45.2% of residents of San Bernardino speak English at home.
50.5% of residents speak Spanish at home (69% speak English very well, 13% speak English well, 11% speak English not well, 7% don't speak English at all).
0.7% of residents speak other Indo-European language at home (66% speak English very well, 22% speak English well, 12% speak English not well).
3.4% of residents speak Asian or Pacific Island language at home (50% speak English very well, 27% speak English well, 16% speak English not well, 7% don't speak English at all).
1.1% of residents speak other language at home (58% speak English very well, 29% speak English well, 10% speak English not well, 3% don't speak English at all).
Foreign born population: 49,114 (22.3%)
(43.3% of them are naturalized citizens)
| Here: | 5.7 |
| State: | 6.0 |
| Here: | 4.1 |
| State: | 3.9 |
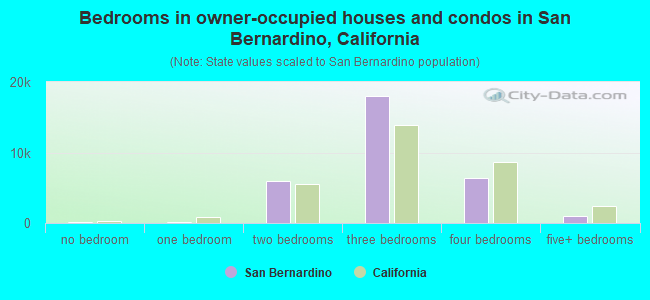
- Bedrooms in owner-occupied houses and condos in San Bernardino, California
- 84no bedroom
- 1291 bedroom
- 5,9172 bedrooms
- 17,9483 bedrooms
- 6,3264 bedrooms
- 1,0615+ bedrooms
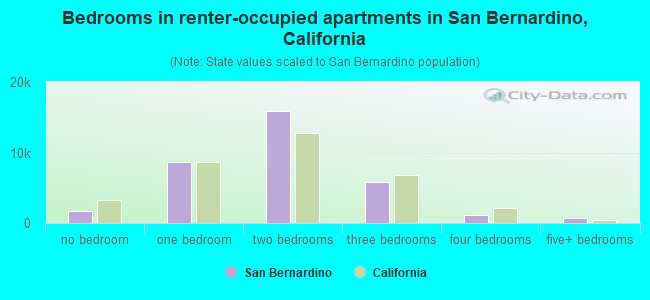
- Bedrooms in renter-occupied apartments in San Bernardino, California
- 1,706no bedroom
- 8,7151 bedroom
- 15,8702 bedrooms
- 5,8043 bedrooms
- 1,1864 bedrooms
- 6745+ bedrooms
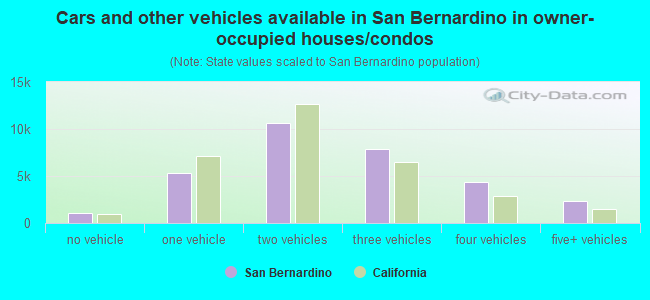
- Cars and other vehicles available in San Bernardino in owner-occupied houses/condos
- 1,070no vehicle
- 5,2681 vehicle
- 10,6052 vehicles
- 7,8323 vehicles
- 4,3704 vehicles
- 2,3205+ vehicles
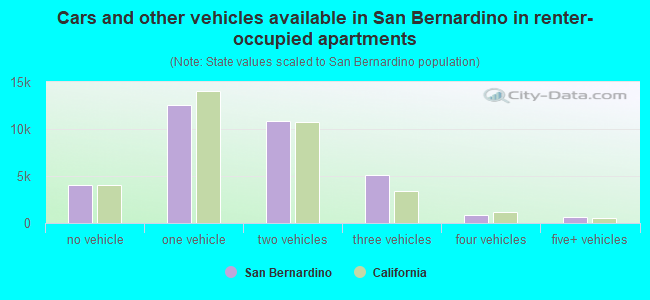
- Cars and other vehicles available in San Bernardino in renter-occupied apartments
- 4,034no vehicle
- 12,5771 vehicle
- 10,8222 vehicles
- 5,1033 vehicles
- 8014 vehicles
- 6185+ vehicles
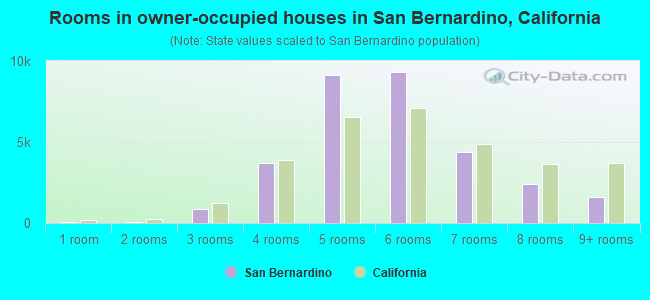
- Rooms in owner-occupied houses in San Bernardino, California
- 381 room
- 462 rooms
- 8383 rooms
- 3,6974 rooms
- 9,1055 rooms
- 9,3396 rooms
- 4,3847 rooms
- 2,4058 rooms
- 1,6139+ rooms
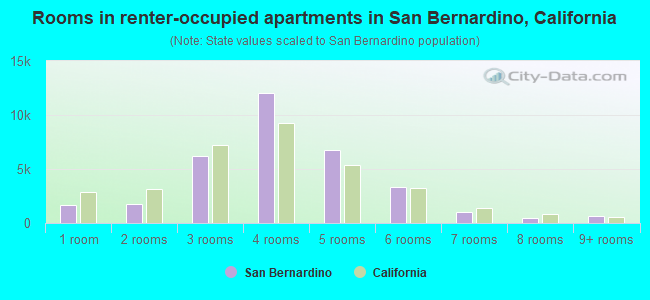
- Rooms in renter-occupied apartments in San Bernardino, California
- 1,7061 room
- 1,7732 rooms
- 6,1813 rooms
- 12,0074 rooms
- 6,7875 rooms
- 3,3276 rooms
- 1,0067 rooms
- 4778 rooms
- 6919+ rooms
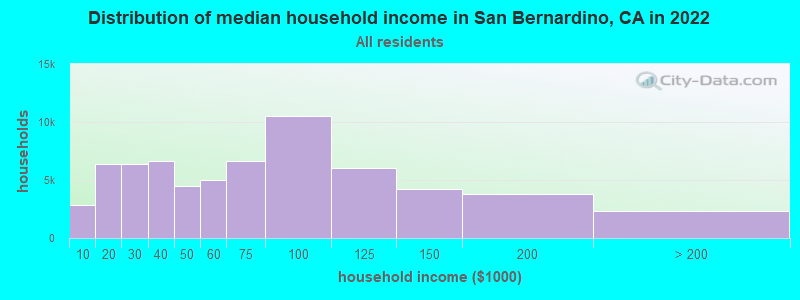
San Bernardino, CA household income distribution

- 2,876Less than $10,000
- 6,348$10,000 to $19,999
- 6,414$20,000 to $29,999
- 6,639$30,000 to $39,999
- 4,461$40,000 to $49,999
- 5,028$50,000 to $59,999
- 6,664$60,000 to $74,999
- 10,515$75,000 to $99,999
- 6,076$100,000 to $124,999
- 4,266$125,000 to $149,999
- 3,823$150,000 to $199,999
- 2,310$200,000 or more
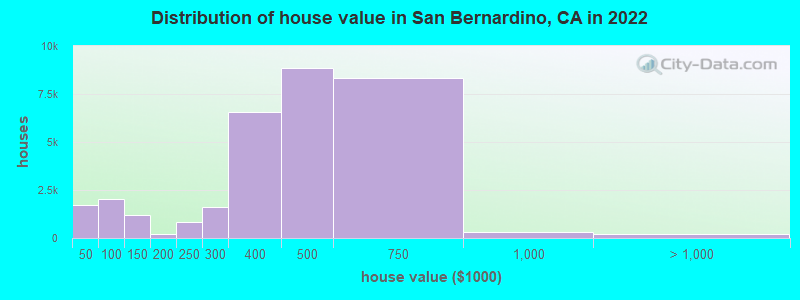
Home value of owner - occupied houses in 2022 in San Bernardino, CA
-
- 177Less than $10,000
- 53$10,000 to $14,999
- 397$20,000 to $24,999
- 53$25,000 to $29,999
- 370$30,000 to $34,999
- 279$35,000 to $39,999
- 367$40,000 to $49,999
- 123$50,000 to $59,999
- 399$60,000 to $69,999
- 336$70,000 to $79,999
- 605$80,000 to $89,999
- 214$90,000 to $99,999
- 815$100,000 to $124,999
- 392$125,000 to $149,999
- 215$175,000 to $199,999
- 820$200,000 to $249,999
- 1,593$250,000 to $299,999
- 6,559$300,000 to $399,999
- 8,867$400,000 to $499,999
- 8,309$500,000 to $749,999
- 315$750,000 to $999,999
- 68$1,500,000 to $1,999,999
- 139$2,000,000 or more
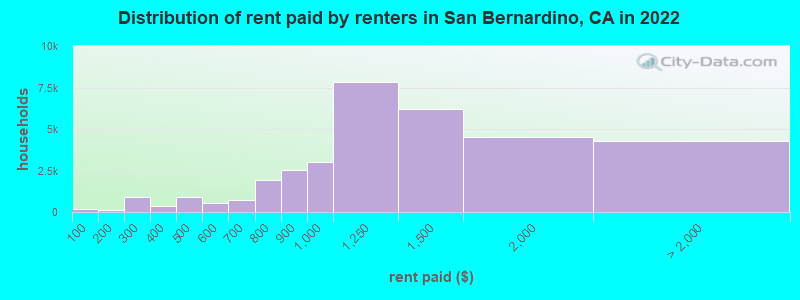
Rent paid by renters in 2022 in San Bernardino, CA
-
- 203Less than $100
- 105$150 to $199
- 216$200 to $249
- 676$250 to $299
- 35$300 to $349
- 337$350 to $399
- 557$400 to $449
- 354$450 to $499
- 323$500 to $549
- 224$550 to $599
- 141$600 to $649
- 566$650 to $699
- 527$700 to $749
- 1,383$750 to $799
- 2,541$800 to $899
- 2,998$900 to $999
- 7,807$1,000 to $1,249
- 6,214$1,250 to $1,499
- 4,497$1,500 to $1,999
- 3,009$2,000 to $2,499
- 49$2,500 to $2,999
- 301$3,000 to $3,499
- 46$3,500 or more
- 846No cash rent
Percentage of workers working in this county: 81.1%
Number of people working at home: 5,371 (5.5% of all workers)
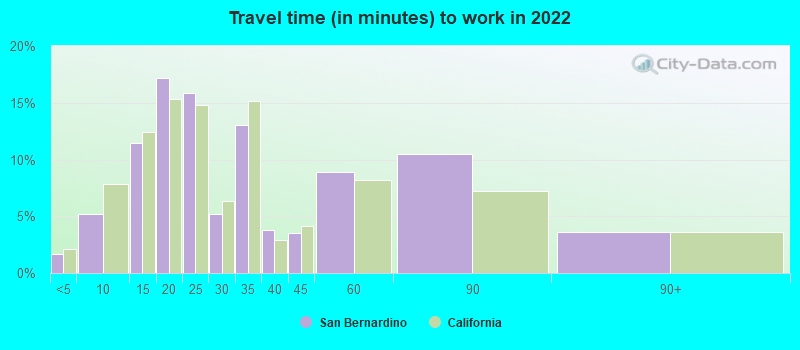
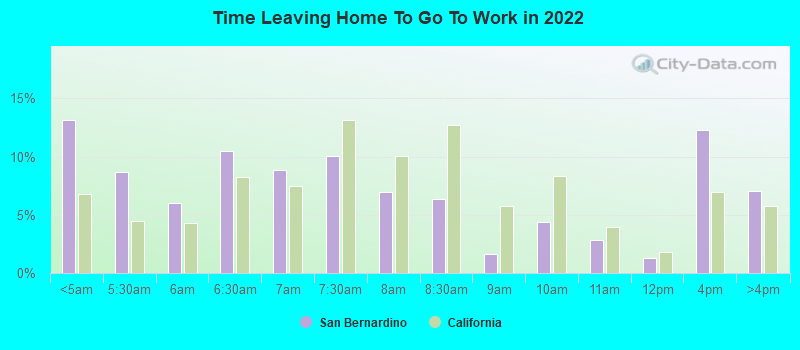
Travel time to work (commute)
- Less than 5 minutes: 489
- 5 to 9 minutes: 4,544
- 10 to 14 minutes: 13,229
- 15 to 19 minutes: 18,144
- 20 to 24 minutes: 18,187
- 25 to 29 minutes: 5,985
- 30 to 34 minutes: 14,409
- 35 to 39 minutes: 1,205
- 40 to 44 minutes: 2,088
- 45 to 59 minutes: 2,612
- 60 to 89 minutes: 6,487
- 90 or more minutes: 4,403
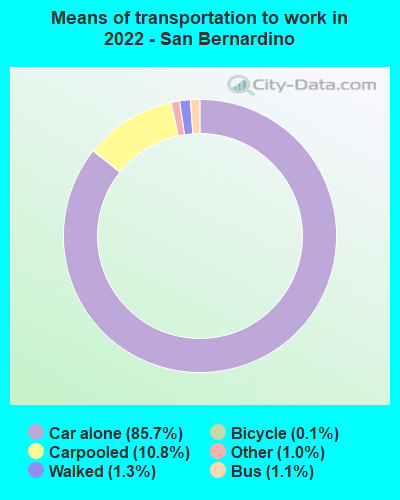
Means of transportation to work:
- Drove a car alone: 106,451 (82.1%)
- Carpooled: 13,435 (10.4%)
- Bus: 1,336 (1.0%)
- Light rail, streetcar or trolley: 39 (0.0%)
- Taxi: 1,209 (0.9%)
- Bicycle: 142 (0.1%)
- Walked: 1,643 (1.3%)
- Worked at home: 5,371 (4.1%)
- Unemployment by race in 2022
- Unemployment rate for White non-Hispanic residents
- 4.2%Males
- 3.2%Females
- Unemployment rate for Black residents
- 8.5%Males
- 6.5%Females
- Unemployment rate for American Indian and Alaska Native residents
- 5.3%Males
- 3.5%Females
- Unemployment rate for Asian residents
- 16.1%Males
- 3.0%Females
- Unemployment rate for other race residents
- 4.8%Males
- 4.3%Females
- Unemployment rate for two or more race residents
- 6.9%Males
- 3.5%Females
- Unemployment rate for Hispanic or Latino residents
- 5.9%Males
- 3.8%Females
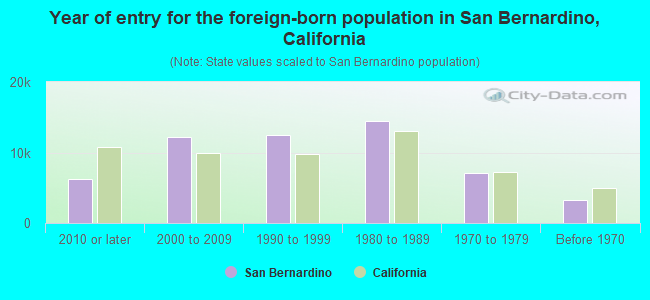
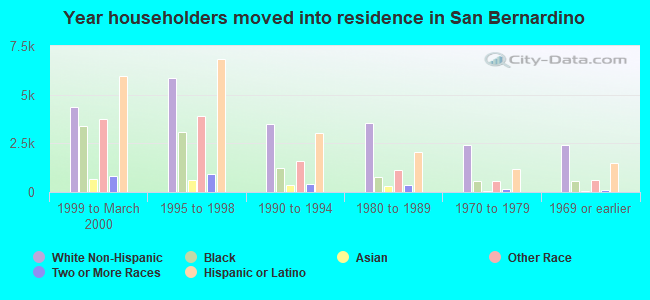
- Year of entry for the foreign-born population in San Bernardino, California
- 6,2732010 or later
- 12,1712000 to 2009
- 12,4801990 to 1999
- 14,5241980 to 1989
- 7,1571970 to 1979
- 3,256Before 1970
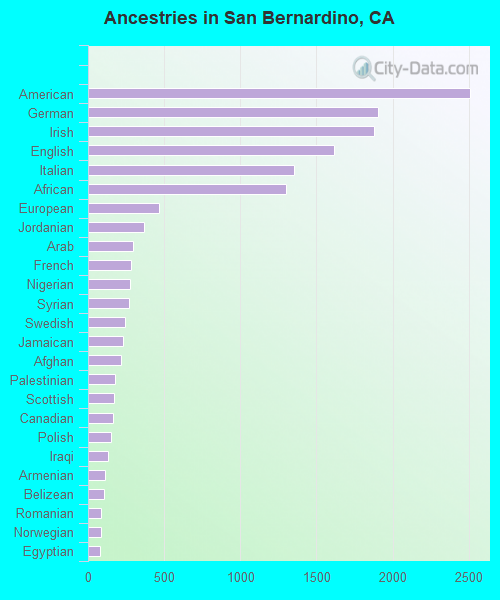
First ancestries reported:
- American: 2,508 (1.6%)
- German: 1,907 (1.2%)
- Irish: 1,881 (1.2%)
- English: 1,616 (1.0%)
- Italian: 1,352 (0.9%)
- African: 1,302 (0.8%)
- European: 463 (0.3%)
- Jordanian: 370 (0.2%)
- Arab: 296 (0.2%)
- French: 280 (0.2%)
- Nigerian: 278 (0.2%)
- Syrian: 269 (0.2%)
- Swedish: 242 (0.2%)
- Jamaican: 230 (0.1%)
- Afghan: 218 (0.1%)
- Palestinian: 177 (0.1%)
- Scottish: 170 (0.1%)
- Canadian: 164 (0.1%)
- Polish: 149 (0.10%)
- Iraqi: 129 (0.08%)
- Armenian: 113 (0.07%)
- Belizean: 105 (0.07%)
- Romanian: 87 (0.06%)
- Norwegian: 83 (0.05%)
- Egyptian: 78 (0.05%)
- Eastern European: 72 (0.05%)
- Dutch: 71 (0.05%)
- West Indian: 71 (0.05%)
- French Canadian: 70 (0.05%)
- Northern European: 68 (0.04%)
- Kenyan: 68 (0.04%)
- Scandinavian: 65 (0.04%)
- British: 64 (0.04%)
- Hungarian: 59 (0.04%)
- Greek: 59 (0.04%)
- Finnish: 55 (0.04%)
- Russian: 54 (0.03%)
- Lebanese: 51 (0.03%)
- Scotch-Irish: 51 (0.03%)
- Ukrainian: 48 (0.03%)
- Danish: 40 (0.03%)
- Portuguese: 38 (0.02%)
- Slavic: 34 (0.02%)
- Welsh: 30 (0.02%)
- South African: 29 (0.02%)
- Iranian: 27 (0.02%)
- Ethiopian: 24 (0.02%)
- Haitian: 22 (0.01%)
- Trinidadian and Tobagonian: 22 (0.01%)
- Czechoslovakian: 21 (0.01%)
- Swiss: 18 (0.01%)
- Guyanese: 16 (0.01%)
- British West Indian: 15 (0.01%)
- Austrian: 14 (0.01%)
- Slovak: 11 (0.01%)
- Ghanaian: 11 (0.01%)
- Brazilian: 11 (0.01%)
Most common places of birth for foreign-born residents (%):
| San Bernardino: | 69.0% (33,239) |
| California: | 37.2% (3,881,193) |
| San Bernardino: | 4.8% (2,306) |
| California: | 4.2% (440,287) |
| San Bernardino: | 4.0% (1,931) |
| California: | 7.8% (818,297) |
| San Bernardino: | 3.1% (1,517) |
| California: | 2.8% (290,436) |
| San Bernardino: | 1.8% (864) |
| California: | 4.9% (512,335) |
Place of birth for U.S.-born residents:
- This state: 150,918
- Other state: 17,940
- Northeast: 2,976
- Midwest: 5,331
- South: 5,907
- West: 3,726
90.7% of San Bernardino residents lived in the same house 1 years ago.
Out of people who lived in different houses, 39.8% lived in this county.
Out of people who lived in different counties, 85.4% lived in California.
| San Bernardino: | 90.7% |
| State average: | 88.9% |
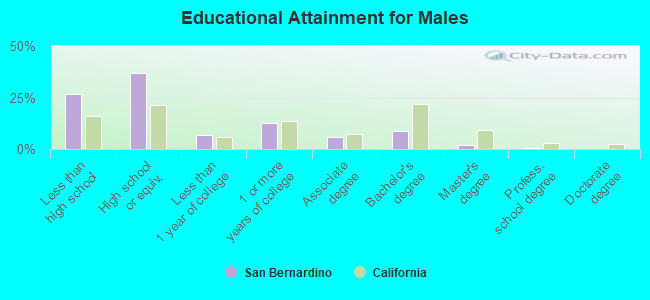
Education attainment for males 25 years and older:
- No schooling: 2,764
- Nursery to 4th grade: 1,900
- 5th and 6th grade: 3,230
- 7th and 8th grade: 1,523
- 9th grade: 1,639
- 10th grade: 1,405
- 11th grade: 3,300
- 12th grade, no diploma: 1,958
- High school graduate (or equivalency): 24,320
- Less than 1 year of college: 4,355
- Some college more than 1 year, no degree: 8,304
- Associate degree: 3,970
- Bachelor's degree: 5,940
- Master's degree: 1,313
- Professional school degree: 213
- Doctorate degree: 56
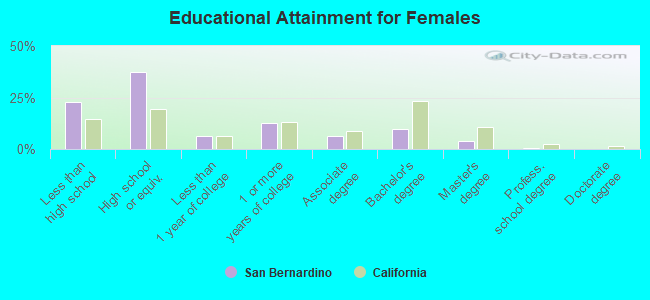
Education attainment for females 25 years and older:
- No schooling: 2,570
- Nursery to 4th grade: 897
- 5th and 6th grade: 3,639
- 7th and 8th grade: 1,228
- 9th grade: 1,503
- 10th grade: 2,376
- 11th grade: 1,717
- 12th grade, no diploma: 2,212
- High school graduate (or equivalency): 26,641
- Less than 1 year of college: 4,651
- Some college more than 1 year, no degree: 9,110
- Associate degree: 4,422
- Bachelor's degree: 7,035
- Master's degree: 2,617
- Professional school degree: 282
- Doctorate degree: 111
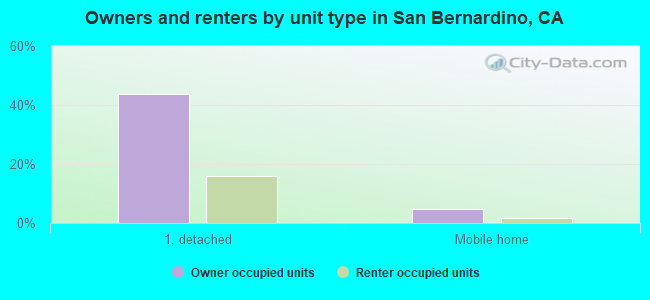
Housing units in structures:
- One, detached: 38,635
- One, attached: 2,065
- Two: 1,865
- 3 or 4: 4,004
- 5 to 9: 3,243
- 10 to 19: 3,024
- 20 to 49: 3,292
- 50 or more: 6,771
- Mobile homes: 5,383
- Boats, RVs, vans, etc.: 70
Median worth of mobile homes: $70,000
Housing units lacking complete kitchen facilities in 2022: 3.1%
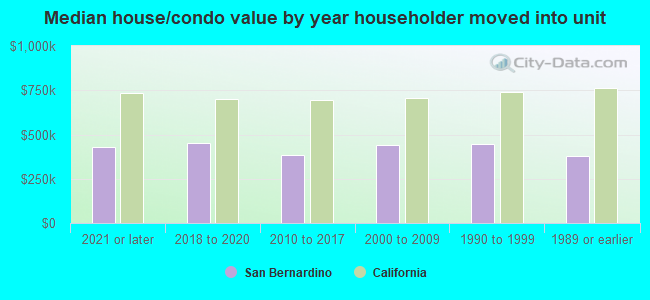
House/condo owner moved in on average 14 years ago
Renter moved in on average 4 years ago
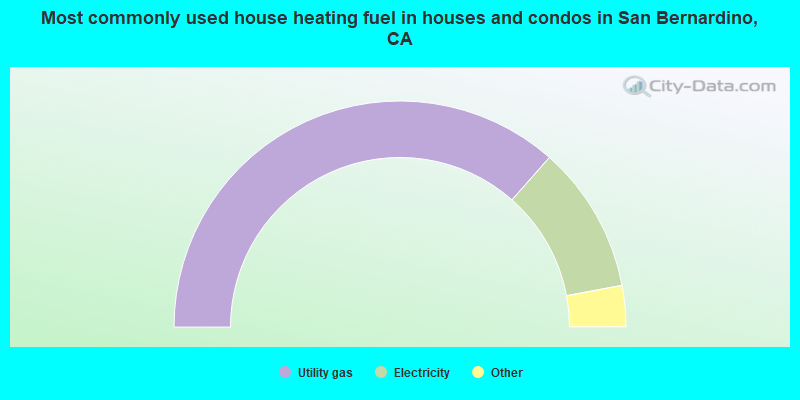
- 73.0%Utility gas
- 21.1%Electricity
- 2.3%No fuel used
- 1.7%Solar energy
- 1.1%Bottled, tank, or LP gas
- 0.5%Wood
- 0.3%Fuel oil, kerosene, etc.
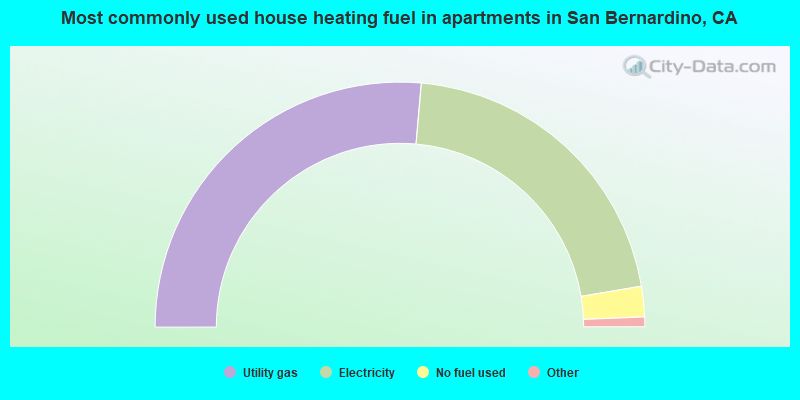
- 52.8%Utility gas
- 41.9%Electricity
- 4.0%No fuel used
- 0.9%Bottled, tank, or LP gas
- 0.2%Fuel oil, kerosene, etc.
- 0.1%Wood
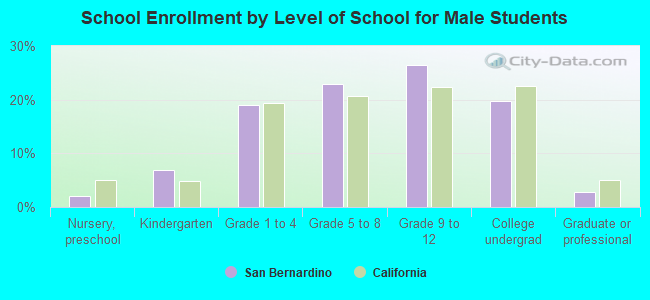
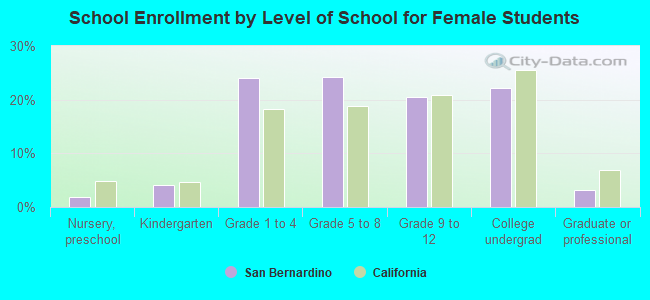
Private vs. public school enrollment:
| Here: | 2.0% |
| California: | 10.5% |
| Here: | 3.4% |
| California: | 8.5% |
| Here: | 15.4% |
| California: | 15.9% |