Housing density: 843 houses/condos per square mile
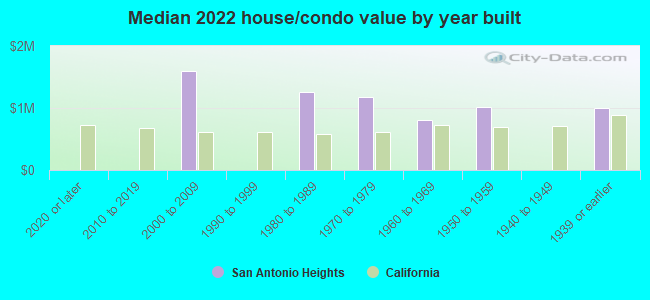
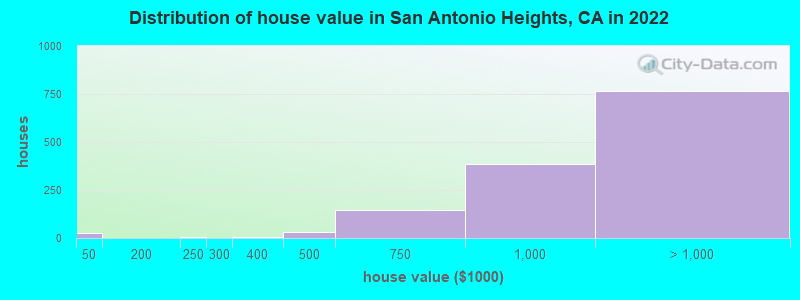
Median price asked for vacant for-sale houses and condos in 2022 in this county: $446,573.
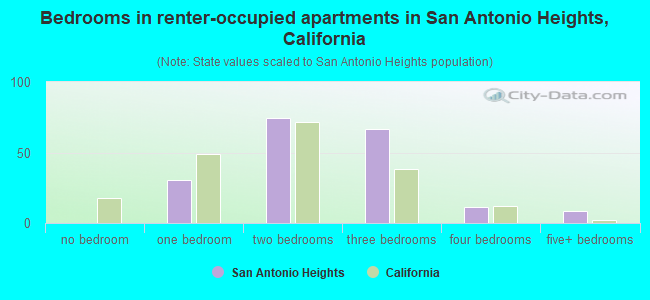
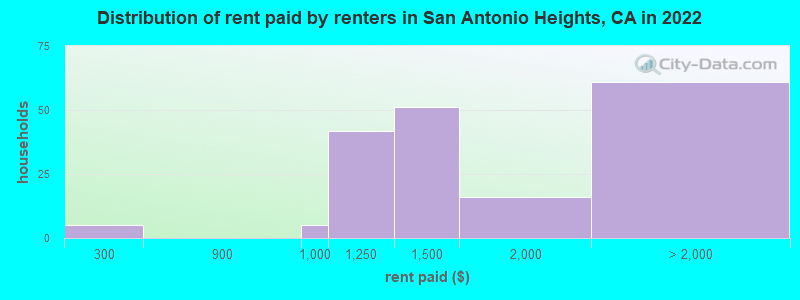
Median contract rent in 2022: $1,430 (lower quartile is $1,189, upper quartile is over $2,000)
Median gross rent in San Antonio Heights, CA in 2022: $1,718
Housing units in San Antonio Heights with a mortgage: 562 (52 second mortgage, 0 home equity loan, 55 both second mortgage and home equity loan) Houses without a mortgage: 0
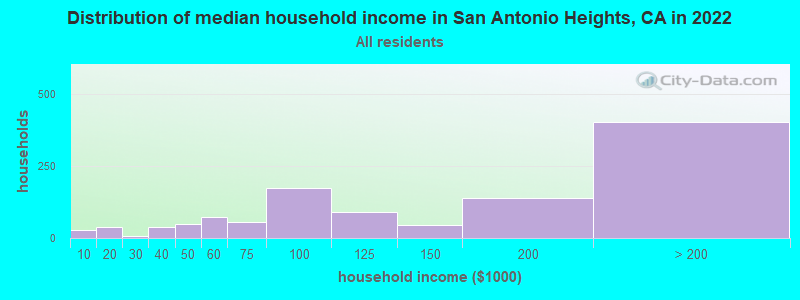
Median household income for houses/condos with a mortgage: $162,510
Median household income for apartments without a mortgage: $126,461
Median monthly housing costs: $2,355
Compare current foreclosures near San Antonio Heights, CA:
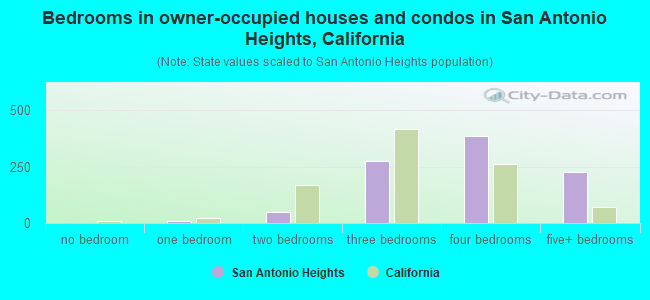
Size of family households: 311 2-persons, 241 3-persons, 190 4-persons, 62 5-persons, 60 6-persons.
Size of nonfamily households: 208 1-person, 47 2-persons, 9 5-persons.
602 married couples with children.
79 single-parent households (6 men, 73 women).
72.2% of residents of San Antonio Heights speak English at home.
9.1% of residents speak Spanish at home (93% speak English very well, 7% speak English well).
4.8% of residents speak other Indo-European language at home (95% speak English very well, 5% speak English well).
11.4% of residents speak Asian or Pacific Island language at home (41% speak English very well, 43% speak English well, 16% speak English not well).
0.6% of residents speak other language at home (100% speak English very well).
Foreign born population: 753 (22.7%)
(78.1% of them are naturalized citizens)
Percentage of workers working in this county: 72.9% Number of people working at home: 425 (26.6% of all workers)
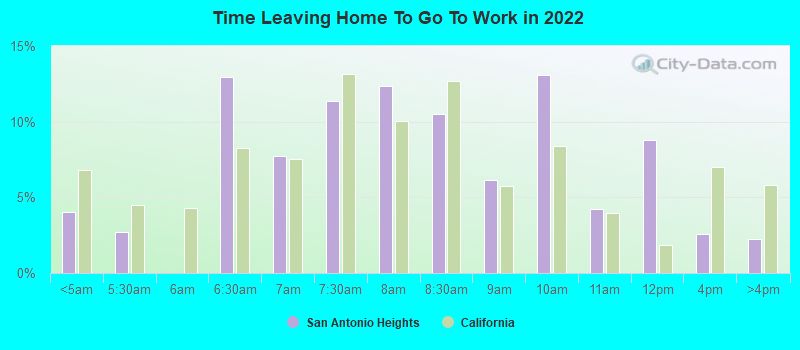
Travel time to work (commute)
Less than 5 minutes: 25
5 to 9 minutes: 21
10 to 14 minutes: 195
15 to 19 minutes: 64
20 to 24 minutes: 211
25 to 29 minutes: 167
30 to 34 minutes: 219
35 to 39 minutes: 96
40 to 44 minutes: 40
45 to 59 minutes: 39
60 to 89 minutes: 82
90 or more minutes: 54
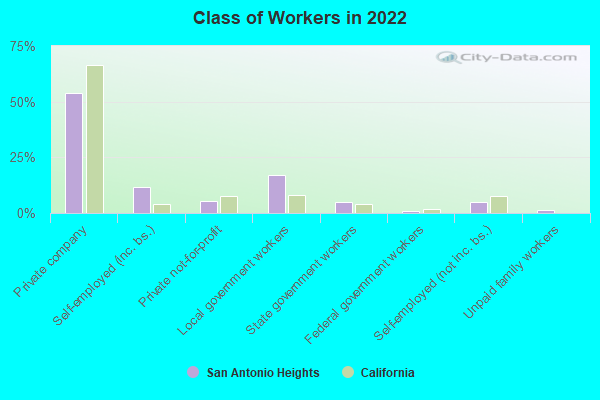
Means of transportation to work:
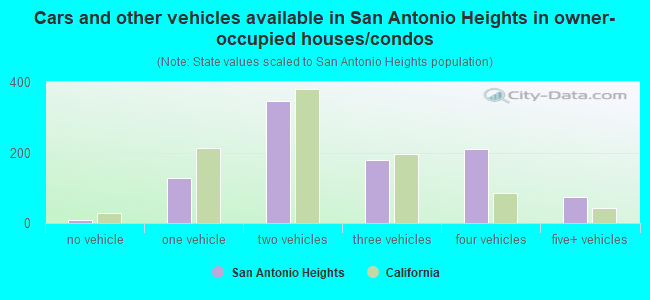
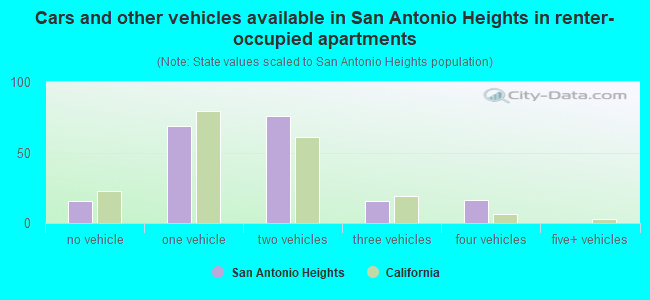
Drove a car alone: 1,207 (77.7%)
Carpooled: 181 (11.7%)
Bus or trolley bus: 7 (0.5%)
Railroad: 22 (1.4%)
Bicycle: 9 (0.6%)
Worked at home: 127 (8.2%)
Unemployment by race in 2022
Unemployment rate for White non-Hispanic residents
1.8%Males
4.0%Females
Unemployment rate for two or more race residents
8.4%Females
Unemployment rate for Hispanic or Latino residents
2.2%Females
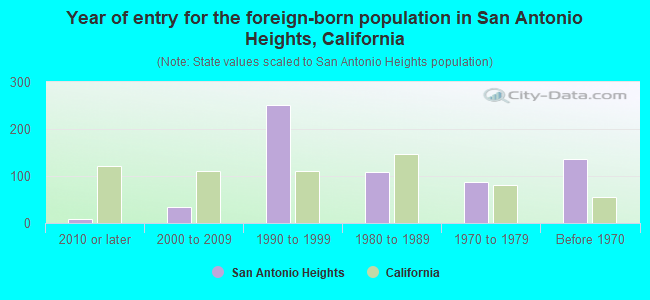
Year of entry for the foreign-born population in San Antonio Heights, California
92010 or later
332000 to 2009
2521990 to 1999
1081980 to 1989
871970 to 1979
136Before 1970
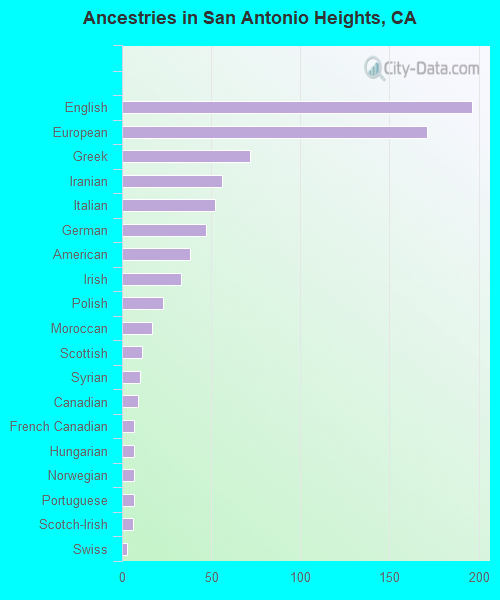
First ancestries reported:
English: 196 (12.6%)
European: 171 (11.0%)
Greek: 72 (4.6%)
Iranian: 56 (3.6%)
Italian: 52 (3.3%)
German: 47 (3.0%)
American: 38 (2.4%)
Irish: 33 (2.1%)
Polish: 23 (1.5%)
Moroccan: 17 (1.1%)
Scottish: 11 (0.7%)
Syrian: 10 (0.6%)
Canadian: 9 (0.6%)
French Canadian: 7 (0.5%)
Hungarian: 7 (0.5%)
Norwegian: 7 (0.5%)
Portuguese: 7 (0.5%)
Scotch-Irish: 6 (0.4%)
Swiss: 3 (0.2%)
Most common places of birth for foreign-born residents (%):
Taiwan
San Antonio Heights:
17.6% (129)
California:
1.7% (176,274)
China, excluding Hong Kong and Taiwan
San Antonio Heights:
14.2% (104)
California:
6.6% (684,672)
Ireland
San Antonio Heights:
12.8% (94)
California:
0.2% (16,042)
Colombia
San Antonio Heights:
9.7% (71)
California:
0.5% (55,249)
Iran
San Antonio Heights:
7.2% (53)
California:
2.0% (206,004)
Mexico
San Antonio Heights:
7.1% (52)
California:
37.2% (3,881,193)
Philippines
San Antonio Heights:
5.3% (39)
California:
7.8% (818,297)
Peru
San Antonio Heights:
4.6% (34)
California:
0.7% (74,025)
India
San Antonio Heights:
4.5% (33)
California:
5.2% (539,184)
Japan
San Antonio Heights:
2.6% (19)
California:
1.0% (103,575)
England
San Antonio Heights:
2.5% (18)
California:
0.6% (57,953)
Morocco
San Antonio Heights:
2.2% (16)
California:
0.1% (6,612)
El Salvador
San Antonio Heights:
1.8% (13)
California:
4.2% (440,287)
Place of birth for U.S.-born residents:
This state: 2,091
Other state: 442
Northeast: 87
Midwest: 163
South: 92
West: 101
99.5% of San Antonio Heights residents lived in the same house 1 years ago. Out of people who lived in different houses, 47.7% lived in this county. Out of people who lived in different counties, 100.0% lived in California.
San Antonio Heights:
99.5%
State average:
88.9%
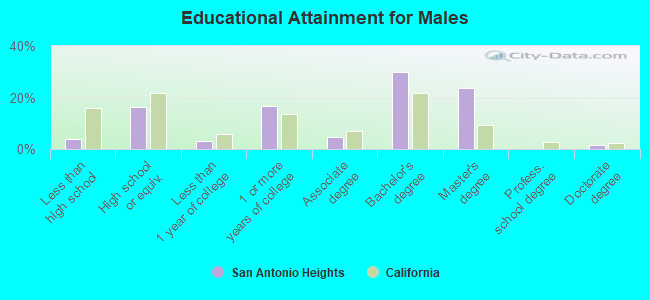
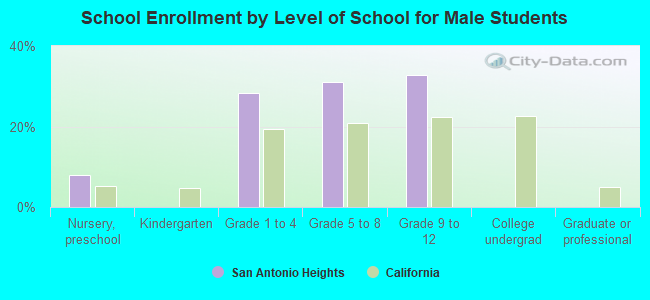
Education attainment for males 25 years and older:
No schooling: 0
Nursery to 4th grade: 0
5th and 6th grade: 0
7th and 8th grade: 8
9th grade: 9
10th grade: 21
11th grade: 1
12th grade, no diploma: 7
High school graduate (or equivalency): 197
Less than 1 year of college: 37
Some college more than 1 year, no degree: 203
Associate degree: 57
Bachelor's degree: 364
Master's degree: 288
Professional school degree: 0
Doctorate degree: 20
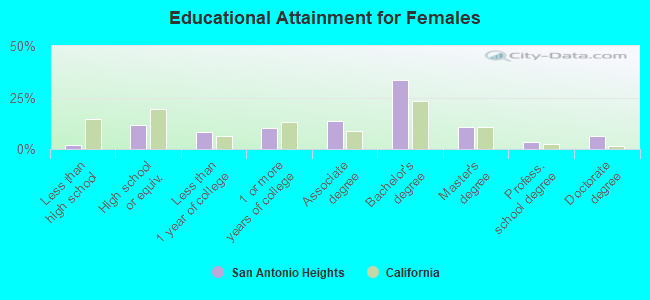
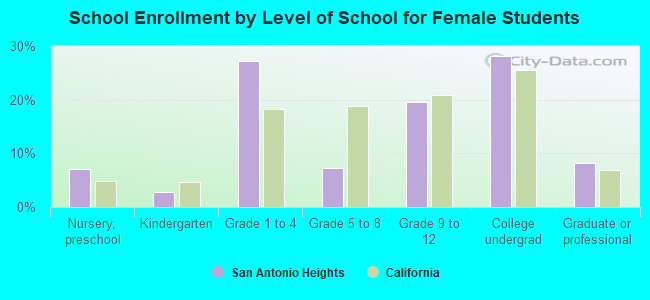
Education attainment for females 25 years and older:
No schooling: 4
Nursery to 4th grade: 0
5th and 6th grade: 0
7th and 8th grade: 0
9th grade: 2
10th grade: 0
11th grade: 15
12th grade, no diploma: 2
High school graduate (or equivalency): 141
Less than 1 year of college: 99
Some college more than 1 year, no degree: 123
Associate degree: 163
Bachelor's degree: 399
Master's degree: 129
Professional school degree: 38
Doctorate degree: 74
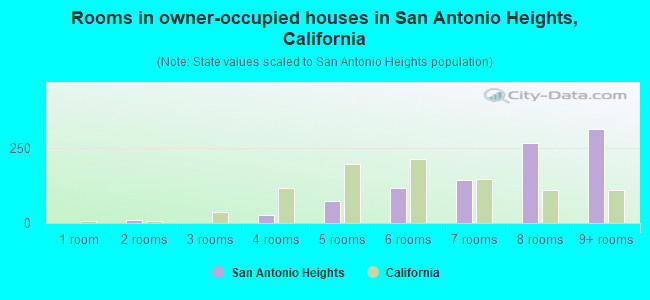
Housing units in structures:
One, detached: 1,083
One, attached: 56
Two: 26
3 or 4: 7
50 or more: 8
Housing units lacking complete kitchen facilities in 2022: 0.7%
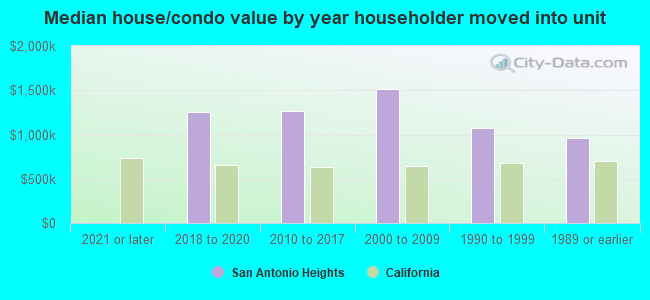
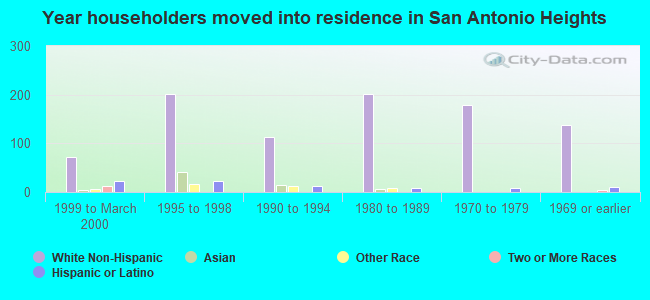
House/condo owner moved in on average 13 years ago