Sams Valley, OR (Oregon) Houses and Residents
| Sams Valley: | $423,122 |
| Oregon: | $475,600 |
Total population: 5,024 (Urban population: 1,164 (all inside urban clusters), Rural population: 3,441 (259 farm, 3,182 nonfarm))
Houses: 1,872 (1,725 occupied: 1,417 owner occupied, 308 renter occupied)
| % of renters here: | 18% |
| State: | 37% |
Housing density: 18 houses/condos per square mile
Median price asked for vacant for-sale houses and condos in 2022 in this county: $473,144.
Median contract rent in 2022: $1,160 (lower quartile is $997, upper quartile is $1,448)
Median rent asked for vacant for-rent units in 2022: $1,199
Median gross rent in Sams Valley, OR in 2022: $1,293
Housing units in Sams Valley with a mortgage: 514 (36 second mortgage, 46 home equity loan, 6 both second mortgage and home equity loan)
Houses without a mortgage: 189


Household type by relationship:
Households: 199,714- In family households: 161,570 (37,109 male householders, 16,351 female householders)
40,231 spouses, 51,509 children (46,857 natural, 1,604 adopted, 3,048 stepchildren), 3,573 grandchildren, 1,578 brothers or sisters, 1,576 parents, foster children, 2,053 other relatives, 6,259 non-relatives
- In nonfamily households: 38,144 (13,151 male householders (9,635 living alone)), 16,465 female householders (13,400 living alone)), 8,528 nonrelatives
- In group quarters: 3,492 (950 institutionalized population)
29,116 married couples with children.
10,962 single-parent households (2,782 men, 8,180 women).
95.7% of residents of Sams Valley speak English at home.
3.2% of residents speak Spanish at home (69% speak English very well, 24% speak English well, 4% speak English not well, 4% don't speak English at all).
0.6% of residents speak other Indo-European language at home (100% speak English very well).
0.5% of residents speak other language at home (100% speak English very well).
Foreign born population: 193 (3.4%)
(64.8% of them are naturalized citizens)
| Here: | 6.0 |
| State: | 6.2 |
| Here: | 4.5 |
| State: | 4.0 |

- Bedrooms in owner-occupied houses and condos in Sams Valley, Oregon
- 13no bedroom
- 1091 bedroom
- 3742 bedrooms
- 7693 bedrooms
- 1414 bedrooms
- 115+ bedrooms

- Bedrooms in renter-occupied apartments in Sams Valley, Oregon
- 10no bedroom
- 531 bedroom
- 1152 bedrooms
- 873 bedrooms
- 404 bedrooms
- 35+ bedrooms

- Cars and other vehicles available in Sams Valley in owner-occupied houses/condos
- 38no vehicle
- 2351 vehicle
- 5642 vehicles
- 4203 vehicles
- 984 vehicles
- 625+ vehicles

- Cars and other vehicles available in Sams Valley in renter-occupied apartments
- 10no vehicle
- 1001 vehicle
- 1292 vehicles
- 673 vehicles
- 24 vehicles
- 05+ vehicles

- Rooms in owner-occupied houses in Sams Valley, Oregon
- 101 room
- 432 rooms
- 763 rooms
- 2124 rooms
- 4485 rooms
- 3016 rooms
- 1847 rooms
- 1078 rooms
- 369+ rooms

- Rooms in renter-occupied apartments in Sams Valley, Oregon
- 101 room
- 202 rooms
- 433 rooms
- 804 rooms
- 665 rooms
- 466 rooms
- 187 rooms
- 138 rooms
- 129+ rooms


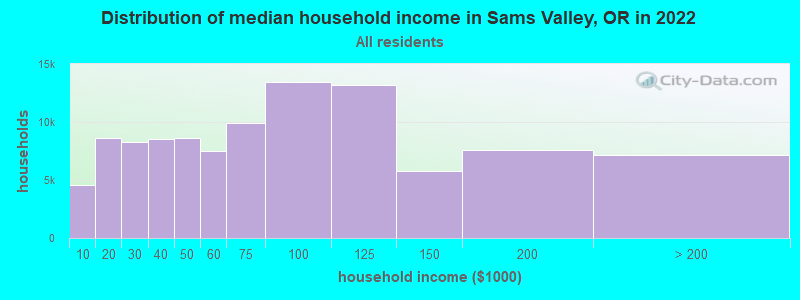
Sams Valley, OR household income distribution

- 4,546Less than $10,000
- 8,623$10,000 to $19,999
- 8,273$20,000 to $29,999
- 8,495$30,000 to $39,999
- 8,608$40,000 to $49,999
- 7,534$50,000 to $59,999
- 9,894$60,000 to $74,999
- 13,444$75,000 to $99,999
- 13,179$100,000 to $124,999
- 5,765$125,000 to $149,999
- 7,626$150,000 to $199,999
- 7,159$200,000 or more
Percentage of workers working in this county: 91.6%
Number of people working at home: 314 (12.2% of all workers)
Travel time to work (commute)
- Less than 5 minutes: 55
- 5 to 9 minutes: 60
- 10 to 14 minutes: 67
- 15 to 19 minutes: 319
- 20 to 24 minutes: 450
- 25 to 29 minutes: 228
- 30 to 34 minutes: 438
- 35 to 39 minutes: 44
- 40 to 44 minutes: 77
- 45 to 59 minutes: 112
- 60 to 89 minutes: 43
- 90 or more minutes: 36
Means of transportation to work:
- Drove a car alone: 1,658 (80.1%)
- Carpooled: 223 (10.8%)
- Motorcycle: 12 (0.6%)
- Bicycle: 7 (0.3%)
- Walked: 18 (0.9%)
- Other means: 11 (0.5%)
- Worked at home: 141 (6.8%)


- Year of entry for the foreign-born population in Sams Valley, Oregon
- 71995 to March 2000
- 341990 to 1994
- 151985 to 1989
- 01980 to 1984
- 231975 to 1979
- 51970 to 1974
- 211965 to 1969
- 49Before 1965
Most common places of birth for foreign-born residents (%):
| Sams Valley: | 40.9% (63) |
| Oregon: | 39.0% (113,083) |
| Sams Valley: | 13.6% (21) |
| Oregon: | 0.6% (1,826) |
| Sams Valley: | 13.0% (20) |
| Oregon: | 3.3% (9,473) |
| Sams Valley: | 9.7% (15) |
| Oregon: | 3.0% (8,568) |
| Sams Valley: | 6.5% (10) |
| Oregon: | 5.9% (17,137) |
| Sams Valley: | 5.8% (9) |
| Oregon: | 0.3% (729) |
| Sams Valley: | 3.9% (6) |
| Oregon: | 0.4% (1,272) |
| Sams Valley: | 1.9% (3) |
| Oregon: | 2.8% (7,995) |
Place of birth for U.S.-born residents:
- This state: 1,727
- Other state: 2,674
- Northeast: 190
- Midwest: 565
- South: 282
- West: 1,637
57% of Sams Valley residents lived in the same house 5 years ago.
Out of people who lived in different houses, 59% lived in this county.
Out of people who lived in different counties, 28% lived in Oregon.
Education attainment for males 25 years and older:
- No schooling: 0
- Nursery to 4th grade: 7
- 5th and 6th grade: 13
- 7th and 8th grade: 27
- 9th grade: 9
- 10th grade: 62
- 11th grade: 81
- 12th grade, no diploma: 56
- High school graduate (or equivalency): 602
- Less than 1 year of college: 140
- Some college more than 1 year, no degree: 247
- Associate degree: 102
- Bachelor's degree: 173
- Master's degree: 68
- Professional school degree: 18
- Doctorate degree: 21

Education attainment for females 25 years and older:
- No schooling: 0
- Nursery to 4th grade: 2
- 5th and 6th grade: 13
- 7th and 8th grade: 23
- 9th grade: 32
- 10th grade: 58
- 11th grade: 73
- 12th grade, no diploma: 66
- High school graduate (or equivalency): 576
- Less than 1 year of college: 148
- Some college more than 1 year, no degree: 317
- Associate degree: 137
- Bachelor's degree: 155
- Master's degree: 29
- Professional school degree: 8
- Doctorate degree: 9


Housing units in structures:
- One, detached: 1,348
- One, attached: 15
- Two: 21
- 3 or 4: 5
- 5 to 9: 4
- Mobile homes: 431
- Boats, RVs, vans, etc.: 48
Median worth of mobile homes: $345,638
Housing units lacking complete kitchen facilities: 0.4%

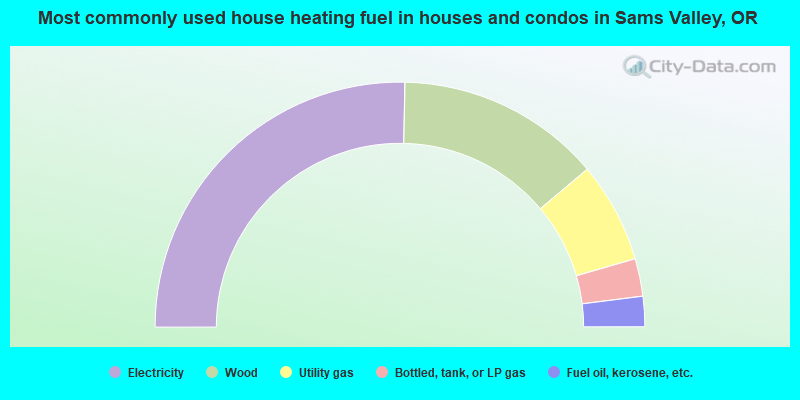
- 50.7%Electricity
- 27.1%Wood
- 13.3%Utility gas
- 5.0%Bottled, tank, or LP gas
- 4.0%Fuel oil, kerosene, etc.
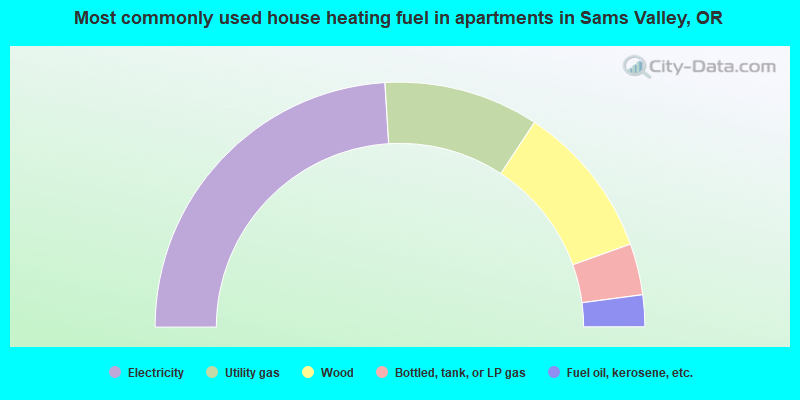
- 48.1%Electricity
- 20.5%Utility gas
- 20.5%Wood
- 6.8%Bottled, tank, or LP gas
- 4.2%Fuel oil, kerosene, etc.
Private vs. public school enrollment:
| Here: | 4.6% |
| Oregon: | 9.7% |
| Here: | 3.0% |
| Oregon: | 7.6% |
| Here: | 2.0% |
| Oregon: | 16.1% |


