Salt River, AZ (Arizona) Houses and Residents
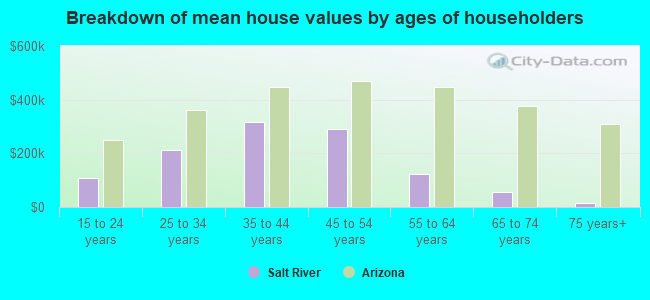
| Salt River: | $176,351 |
| Arizona: | $402,800 |
Total population: 9,036 (Urban population: 3,062, Rural population: 4,170 (32 farm, 4,138 nonfarm))
Houses: 2,807 (2,195 occupied: 1,787 owner occupied, 408 renter occupied)
| % of renters here: | 19% |
| State: | 33% |
Housing density: 24 houses/condos per square mile
Median price asked for vacant for-sale houses and condos in 2022 in this county: $468,533.
Median contract rent in 2022: $410 (lower quartile is $233, upper quartile is $780)
Median rent asked for vacant for-rent units in 2022: $1,306
Median gross rent in Salt River, AZ in 2022: $721
Housing units in Salt River with a mortgage: 413 (4 second mortgage, 0 home equity loan, 0 both second mortgage and home equity loan)
Houses without a mortgage: 476


Household type by relationship:
Households: 3,763,940- In family households: 3,138,026 (650,440 male householders, 282,374 female householders)
675,057 spouses, 1,144,635 children (1,062,824 natural, 25,811 adopted, 56,000 stepchildren), 89,562 grandchildren, 49,169 brothers or sisters, 41,379 parents, foster children, 65,445 other relatives, 109,833 non-relatives
- In nonfamily households: 625,914 (233,548 male householders (166,796 living alone)), 245,221 female householders (198,416 living alone)), 147,145 nonrelatives
- In group quarters: 53,177 (28,412 institutionalized population)
544,876 married couples with children.
186,752 single-parent households (51,395 men, 135,357 women).
76.2% of residents of Salt River speak English at home.
8.0% of residents speak Spanish at home (59% speak English very well, 18% speak English well, 10% speak English not well, 12% don't speak English at all).
0.9% of residents speak other Indo-European language at home (70% speak English very well, 30% speak English well).
2.2% of residents speak Asian or Pacific Island language at home (33% speak English very well, 41% speak English well, 20% speak English not well, 5% don't speak English at all).
12.6% of residents speak other language at home (72% speak English very well, 18% speak English well, 10% speak English not well).
Foreign born population: 522 (4.9%)
(63.0% of them are naturalized citizens)
| Here: | 6.2 |
| State: | 6.0 |
| Here: | 5.5 |
| State: | 4.1 |
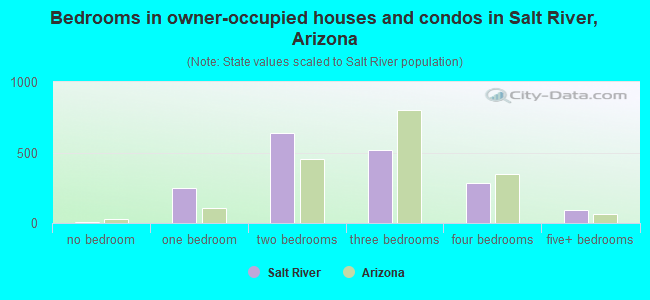
- Bedrooms in owner-occupied houses and condos in Salt River, Arizona
- 10no bedroom
- 2461 bedroom
- 6372 bedrooms
- 5213 bedrooms
- 2834 bedrooms
- 905+ bedrooms
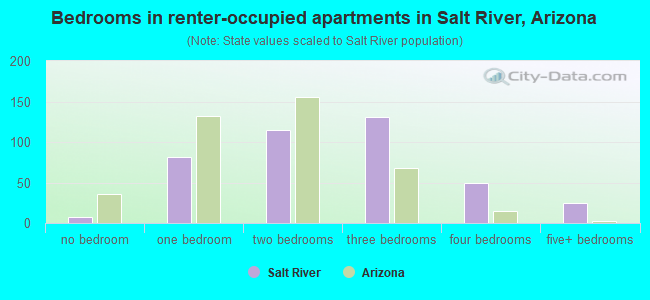
- Bedrooms in renter-occupied apartments in Salt River, Arizona
- 7no bedroom
- 811 bedroom
- 1152 bedrooms
- 1313 bedrooms
- 494 bedrooms
- 255+ bedrooms
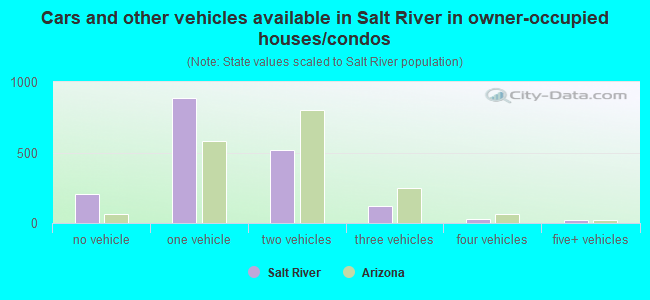
- Cars and other vehicles available in Salt River in owner-occupied houses/condos
- 207no vehicle
- 8881 vehicle
- 5182 vehicles
- 1203 vehicles
- 314 vehicles
- 235+ vehicles
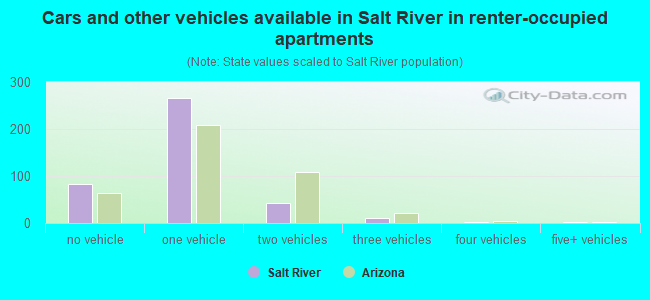
- Cars and other vehicles available in Salt River in renter-occupied apartments
- 82no vehicle
- 2671 vehicle
- 422 vehicles
- 113 vehicles
- 34 vehicles
- 35+ vehicles
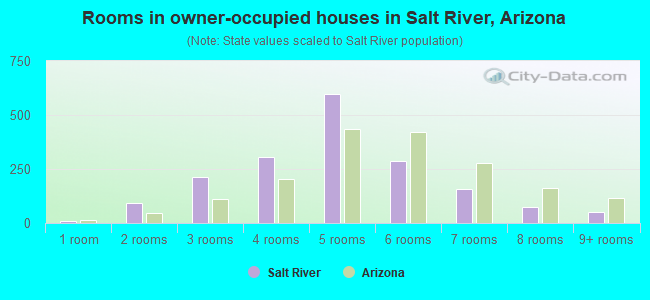
- Rooms in owner-occupied houses in Salt River, Arizona
- 71 room
- 922 rooms
- 2133 rooms
- 3054 rooms
- 5995 rooms
- 2896 rooms
- 1587 rooms
- 758 rooms
- 499+ rooms
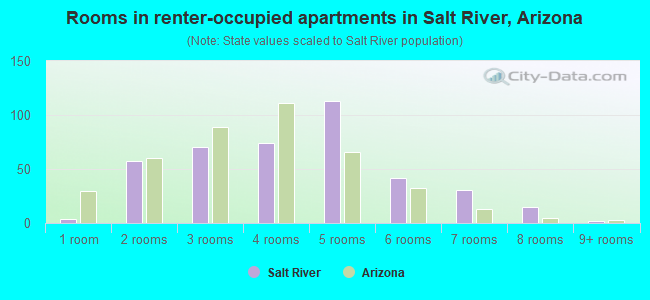
- Rooms in renter-occupied apartments in Salt River, Arizona
- 41 room
- 572 rooms
- 703 rooms
- 744 rooms
- 1135 rooms
- 426 rooms
- 317 rooms
- 158 rooms
- 29+ rooms
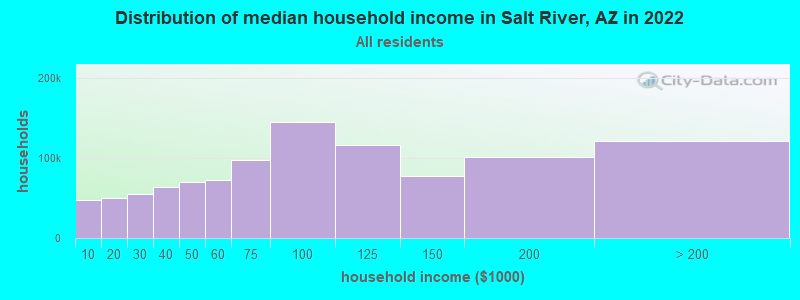
Salt River, AZ household income distribution

- 47,970Less than $10,000
- 49,864$10,000 to $19,999
- 54,512$20,000 to $29,999
- 63,282$30,000 to $39,999
- 70,029$40,000 to $49,999
- 72,028$50,000 to $59,999
- 97,303$60,000 to $74,999
- 145,035$75,000 to $99,999
- 116,075$100,000 to $124,999
- 77,842$125,000 to $149,999
- 100,998$150,000 to $199,999
- 120,787$200,000 or more
Percentage of workers working in this county: 99.1%
Number of people working at home: 706 (22.2% of all workers)
Travel time to work (commute)
- Less than 5 minutes: 115
- 5 to 9 minutes: 437
- 10 to 14 minutes: 415
- 15 to 19 minutes: 392
- 20 to 24 minutes: 220
- 25 to 29 minutes: 47
- 30 to 34 minutes: 190
- 35 to 39 minutes: 27
- 40 to 44 minutes: 24
- 45 to 59 minutes: 33
- 60 to 89 minutes: 38
- 90 or more minutes: 7
Means of transportation to work:
- Drove a car alone: 1,407 (70.8%)
- Carpooled: 406 (20.4%)
- Bus or trolley bus: 29 (1.5%)
- Bicycle: 8 (0.4%)
- Walked: 20 (1.0%)
- Other means: 75 (3.8%)
- Worked at home: 42 (2.1%)
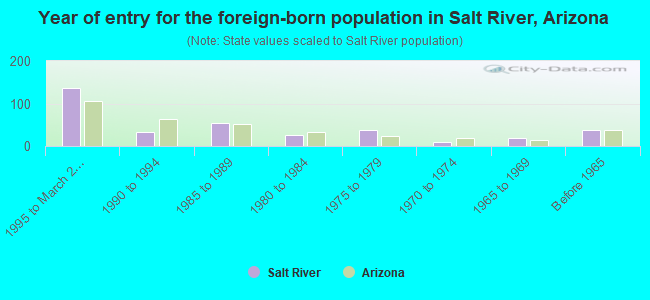
- Year of entry for the foreign-born population in Salt River, Arizona
- 1361995 to March 2000
- 331990 to 1994
- 531985 to 1989
- 251980 to 1984
- 381975 to 1979
- 91970 to 1974
- 181965 to 1969
- 37Before 1965
Most common places of birth for foreign-born residents (%):
| Salt River: | 45.0% (157) |
| Arizona: | 66.4% (436,022) |
| Salt River: | 16.9% (59) |
| Arizona: | 1.5% (10,127) |
| Salt River: | 9.2% (32) |
| Arizona: | 1.2% (8,075) |
| Salt River: | 7.4% (26) |
| Arizona: | 1.4% (9,134) |
| Salt River: | 5.4% (19) |
| Arizona: | 4.0% (26,323) |
| Salt River: | 3.7% (13) |
| Arizona: | 1.8% (11,916) |
| Salt River: | 1.7% (6) |
| Arizona: | 2.4% (15,868) |
| Salt River: | 1.7% (6) |
| Arizona: | 0.1% (641) |
Place of birth for U.S.-born residents:
- This state: 5,420
- Other state: 1,433
- Northeast: 180
- Midwest: 685
- South: 161
- West: 407
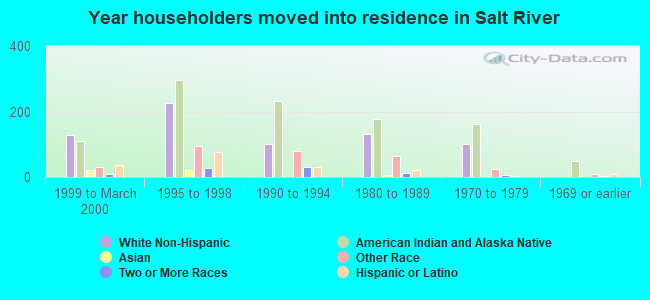
64% of Salt River residents lived in the same house 5 years ago.
Out of people who lived in different houses, 78% lived in this county.
Out of people who lived in different counties, 29% lived in Arizona.
Education attainment for males 25 years and older:
- No schooling: 11
- Nursery to 4th grade: 9
- 5th and 6th grade: 56
- 7th and 8th grade: 86
- 9th grade: 73
- 10th grade: 86
- 11th grade: 172
- 12th grade, no diploma: 159
- High school graduate (or equivalency): 573
- Less than 1 year of college: 70
- Some college more than 1 year, no degree: 273
- Associate degree: 61
- Bachelor's degree: 62
- Master's degree: 23
- Professional school degree: 7
- Doctorate degree: 11

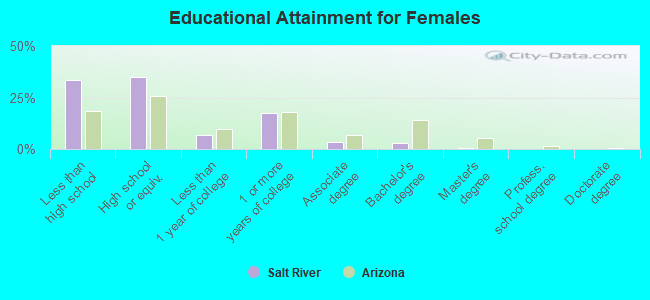
Education attainment for females 25 years and older:
- No schooling: 17
- Nursery to 4th grade: 6
- 5th and 6th grade: 21
- 7th and 8th grade: 97
- 9th grade: 54
- 10th grade: 147
- 11th grade: 182
- 12th grade, no diploma: 164
- High school graduate (or equivalency): 718
- Less than 1 year of college: 144
- Some college more than 1 year, no degree: 362
- Associate degree: 68
- Bachelor's degree: 64
- Master's degree: 9
- Professional school degree: 5
- Doctorate degree: 5
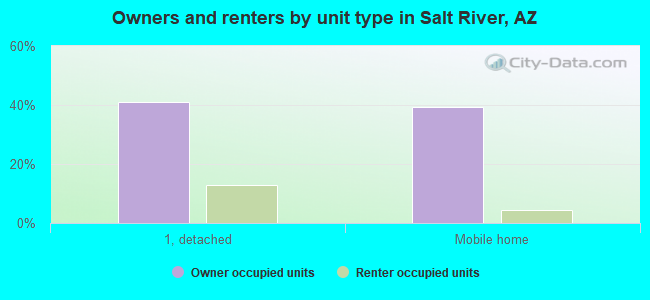
Housing units in structures:
- One, detached: 1,240
- One, attached: 29
- 5 to 9: 7
- 10 to 19: 3
- 50 or more: 5
- Mobile homes: 1,500
- Boats, RVs, vans, etc.: 23
Median worth of mobile homes: $58,149
Housing units lacking complete kitchen facilities: 3.8%
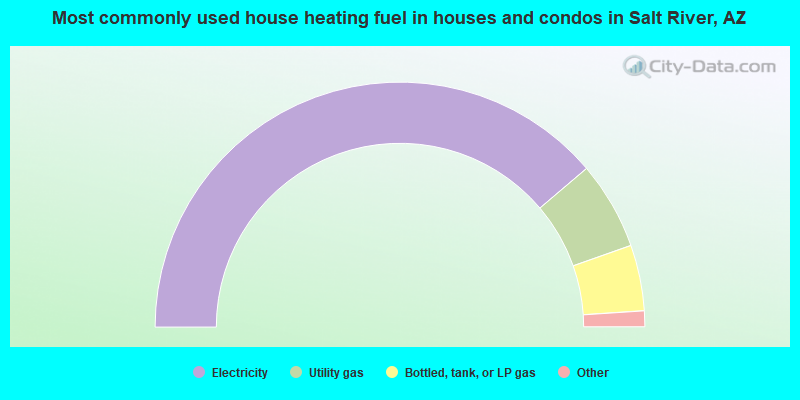
- 77.6%Electricity
- 11.6%Utility gas
- 8.7%Bottled, tank, or LP gas
- 1.3%No fuel used
- 0.5%Wood
- 0.3%Other fuel
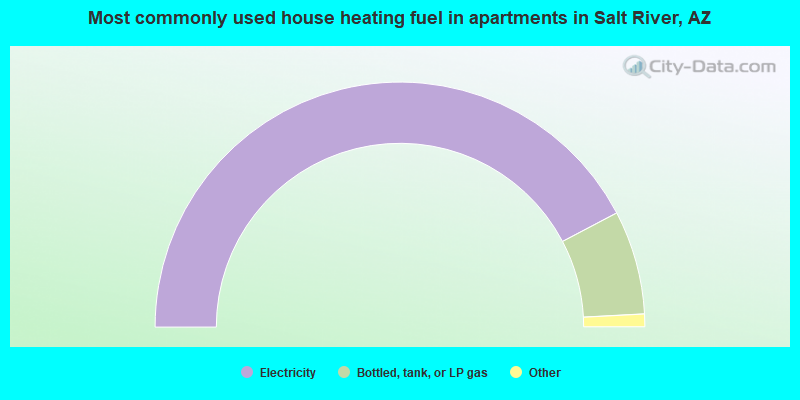
- 84.6%Electricity
- 13.7%Bottled, tank, or LP gas
- 1.0%No fuel used
- 0.7%Utility gas
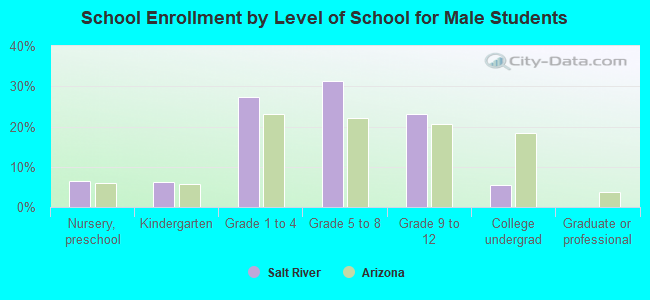
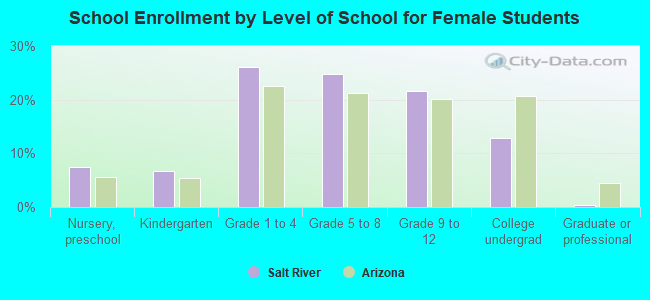
Private vs. public school enrollment:
| Here: | 1.0% |
| Arizona: | 6.1% |
| Here: | 3.4% |
| Arizona: | 6.1% |
| Here: | 6.4% |
| Arizona: | 13.2% |