Ruston, LA (Louisiana) Houses and Residents
| Ruston: | $219,433 |
| Louisiana: | $209,200 |
Total population: 22,301 (Urban population: 20,099 (all inside urban clusters), Rural population: 659 (31 farm, 628 nonfarm))
Houses: 9,295 (8,364 occupied: 2,894 owner occupied, 5,581 renter occupied)
| % of renters here: | 66% |
| State: | 32% |
Housing density: 514 houses/condos per square mile
Median price asked for vacant for-sale houses and condos in 2022: $439,751.
Median contract rent in 2022: $626 (lower quartile is $481, upper quartile is $859)
Median rent asked for vacant for-rent units in 2022: $840
Median gross rent in Ruston, LA in 2022: $822
Housing units in Ruston with a mortgage: 1,424 (86 second mortgage, 26 home equity loan, 26 both second mortgage and home equity loan)
Houses without a mortgage: 52
Median household income for houses/condos with a mortgage: $90,878
Median household income for apartments without a mortgage: $51,420
Median monthly housing costs: $803
Compare current foreclosures in Ruston, LA:
| Photo | Address | Area | Beds / Baths | Price | Details |
|---|---|---|---|---|---|

|
#1
Longstraw Rd
Ruston, LA 71270
|
2,304 sq. feet
|
2 baths 4 beds |
show details | |

|
#2
N Village Dr Lot 32
Ruston, LA 71270
|
- sq. feet
|
- baths - beds |
show details | |

|
#3
Woodstone Dr
Ruston, LA 71270
|
- sq. feet
|
- baths - beds |
show details | |

|
#4
Rich Smith Ln
Ruston, LA 71270
|
- sq. feet
|
- baths - beds |
show details | |

|
#5
Mansfield Estate Drive
Ruston, LA 71270
|
- sq. feet
|
- baths - beds |
show details | |

|
#6
Dunn Rd
Ruston, LA 71270
|
- sq. feet
|
- baths - beds |
show details | |

|
#7
Oakdale St
Ruston, LA 71270
|
- sq. feet
|
- baths - beds |
show details | |

|
#8
E Colorado Ave
Ruston, LA 71270
|
- sq. feet
|
- baths - beds |
show details | |

|
#9
Courtney Ave
Ruston, LA 71270
|
- sq. feet
|
- baths - beds |
show details | |

|
#10
Windy Pines Ln
Ruston, LA 71270
|
- sq. feet
|
- baths - beds |
show details |
| Photo | Address | Area | Beds / Baths | Price | Details |
|---|---|---|---|---|---|

|
#11
Saratoga St
Ruston, LA 71270
|
- sq. feet
|
- baths - beds |
show details | |

|
#12
E California Ave
Ruston, LA 71270
|
- sq. feet
|
- baths - beds |
show details | |

|
#13
Monrovia Dr
Ruston, LA 71270
|
- sq. feet
|
- baths - beds |
show details | |

|
#14
Clay Ansley Hwy
Ruston, LA 71270
|
- sq. feet
|
- baths - beds |
show details | |

|
#15
Tech Farm Rd
Ruston, LA 71270
|
- sq. feet
|
- baths - beds |
show details | |

|
#16
Lamar Ave
Ruston, LA 71270
|
- sq. feet
|
- baths - beds |
show details | |

|
#17
Royal Ln
Ruston, LA 71270
|
- sq. feet
|
- baths - beds |
show details | |

|
#18
Fletcher Ln Lot 32
Ruston, LA 71270
|
- sq. feet
|
- baths - beds |
show details | |

|
#19
S Bonner St
Ruston, LA 71270
|
- sq. feet
|
- baths - beds |
show details | |

|
#20
Martin L King Dr
Ruston, LA 71270
|
- sq. feet
|
- baths - beds |
show details |
| Photo | Address | Area | Beds / Baths | Price | Details |
|---|---|---|---|---|---|

|
#21
Neal St
Ruston, LA 71270
|
- sq. feet
|
- baths - beds |
show details | |

|
#22
Cassidy Ln
Ruston, LA 71270
|
- sq. feet
|
- baths - beds |
show details | |

|
#23
Havins Ave
Ruston, LA 71270
|
- sq. feet
|
- baths - beds |
show details | |

|
#24
Lauren Dr
Ruston, LA 71270
|
- sq. feet
|
- baths - beds |
show details | |

|
#25
Rosalie Dr
Ruston, LA 71270
|
- sq. feet
|
- baths - beds |
show details | |

|
#26
Lexington St
Ruston, LA 71270
|
- sq. feet
|
- baths - beds |
show details | |

|
#27
2nd Ave
Ruston, LA 71270
|
- sq. feet
|
- baths - beds |
show details | |

|
#28
Ruger Ln
Ruston, LA 71270
|
- sq. feet
|
- baths - beds |
show details | |

|
#29
Saratoga St
Ruston, LA 71270
|
- sq. feet
|
- baths - beds |
show details | |

|
#30
Elam St
Ruston, LA 71270
|
- sq. feet
|
- baths - beds |
show details |
| Photo | Address | Area | Beds / Baths | Price | Details |
|---|---|---|---|---|---|

|
#31
Highway 3061
Ruston, LA 71270
|
- sq. feet
|
- baths - beds |
show details | |

|
#32
Timberline Ct, Apt C101
Ruston, LA 71270
|
- sq. feet
|
- baths - beds |
show details | |

|
#33
Mcbride Rd
Ruston, LA 71270
|
- sq. feet
|
- baths - beds |
show details | |

|
#34
Belmont Blvd
Ruston, LA 71270
|
- sq. feet
|
- baths - beds |
show details | |

|
#35
Union Ave
Ruston, LA 71270
|
- sq. feet
|
- baths - beds |
show details | |

|
#36
N Pine Tree Rd
Ruston, LA 71270
|
- sq. feet
|
- baths - beds |
show details | |

|
#37
Taylor St
Ruston, LA 71270
|
- sq. feet
|
- baths - beds |
show details | |

|
#38
S Bernard St
Ruston, LA 71270
|
- sq. feet
|
- baths - beds |
show details | |

|
#39
Cottonwood Dr
Ruston, LA 71270
|
- sq. feet
|
- baths - beds |
show details | |

|
#40
Houston Rd
Ruston, LA 71270
|
- sq. feet
|
- baths - beds |
show details |
| Photo | Address | Area | Beds / Baths | Price | Details |
|---|---|---|---|---|---|

|
#41
Highway 146
Ruston, LA 71270
|
- sq. feet
|
- baths - beds |
show details | |

|
#42
Highway 33
Ruston, LA 71270
|
- sq. feet
|
- baths - beds |
show details | |

|
#43
E Reynolds Dr Apt 14c
Ruston, LA 71270
|
- sq. feet
|
- baths - beds |
show details | |

|
#44
Highway 80 Lot 136
Ruston, LA 71270
|
- sq. feet
|
- baths - beds |
show details | |

|
#45
Rodgers Rd
Ruston, LA 71270
|
- sq. feet
|
- baths - beds |
show details | |

|
#46
Robin St
Ruston, LA 71270
|
- sq. feet
|
- baths - beds |
show details | |

|
#47
E California Ave
Ruston, LA 71270
|
- sq. feet
|
- baths - beds |
show details | |

|
#48
Highway 80
Ruston, LA 71270
|
- sq. feet
|
- baths - beds |
show details | |

|
#49
Simmons Rd
Ruston, LA 71270
|
- sq. feet
|
- baths - beds |
show details | |

|
Check over 1 million property listings on Foreclosure.com!
|
browse all offers | |||

Latest news about housing in Ruston, LA collected exclusively by city-data.com from local newspapers, TV, and radio stations

 | RUSTON LA Questions - Relocation (0 replies) |
| Rent Houses in BC & Northern BC (15 replies) |
| Ruston Public Housing (1 reply) |
| Do you think someone who likes living in Florida would enjoy living Louisiana? (9 replies) |
| Ruston, Louisiana Neighborhoods (1 reply) |
| Wanted: Roommate or House to Rent in Northern LA (0 replies) |
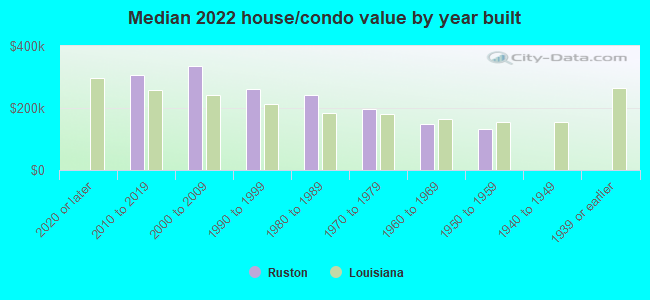
Median year apartment built: 1989
Household type by relationship:
Households: 22,040- Male householders: 3,345 (1,085 living alone), Female householders: 4,800 (1,494 living alone)
1,965 spouses (1,941 opposite-sex spouses), 768 unmarried partners, (756 opposite-sex unmarried partners), 5,099 children (4,983 natural, 33 adopted, 82 stepchildren), 346 grandchildren, 218 brothers or sisters, 296 parents, 0 foster children, 504 other relatives, 2,297 non-relatives
- In group quarters: 2,397
Size of family households: 2,002 2-persons, 1,140 3-persons, 466 4-persons, 230 5-persons, 56 6-persons, 30 7-or-more-persons.
Size of nonfamily households: 2,749 1-person, 1,456 2-persons, 411 3-persons, 99 4-persons, 14 5-persons.
1,011 married couples with children.
1,973 single-parent households (122 men, 1,851 women).
93.7% of residents of Ruston speak English at home.
1.4% of residents speak Spanish at home (76% speak English very well, 20% speak English well, 4% speak English not well).
2.0% of residents speak other Indo-European language at home (73% speak English very well, 27% speak English well).
1.3% of residents speak Asian or Pacific Island language at home (53% speak English very well, 37% speak English well, 10% speak English not well).
1.0% of residents speak other language at home (40% speak English very well, 60% speak English well).
Foreign born population: 1,022 (4.6%)
(62.9% of them are naturalized citizens)
| Here: | 6.3 |
| State: | 6.2 |
| Here: | 4.0 |
| State: | 4.4 |
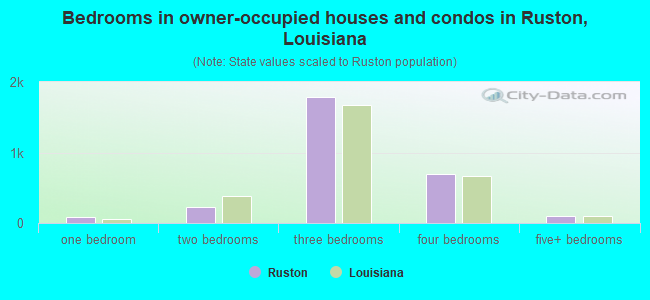
- Bedrooms in owner-occupied houses and condos in Ruston, Louisiana
- 0no bedroom
- 801 bedroom
- 2262 bedrooms
- 1,7853 bedrooms
- 6984 bedrooms
- 1055+ bedrooms
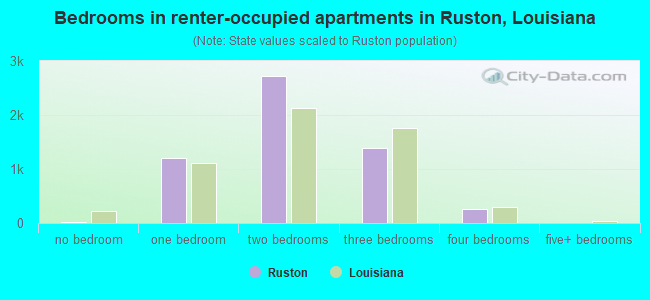
- Bedrooms in renter-occupied apartments in Ruston, Louisiana
- 19no bedroom
- 1,1981 bedroom
- 2,7132 bedrooms
- 1,3973 bedrooms
- 2554 bedrooms
- 05+ bedrooms
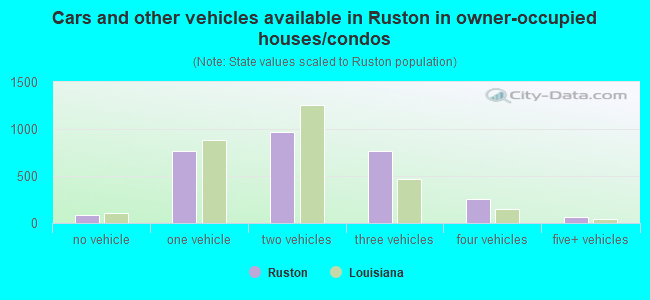
- Cars and other vehicles available in Ruston in owner-occupied houses/condos
- 90no vehicle
- 7611 vehicle
- 9632 vehicles
- 7653 vehicles
- 2524 vehicles
- 645+ vehicles
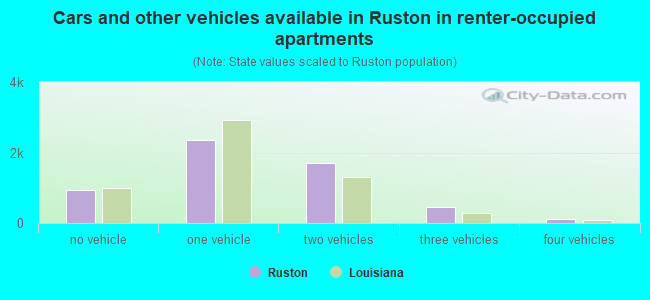
- Cars and other vehicles available in Ruston in renter-occupied apartments
- 943no vehicle
- 2,3461 vehicle
- 1,7132 vehicles
- 4463 vehicles
- 1194 vehicles
- 155+ vehicles
- Rooms in owner-occupied houses in Ruston, Louisiana
- 01 room
- 462 rooms
- 53 rooms
- 1884 rooms
- 6385 rooms
- 7386 rooms
- 4767 rooms
- 4468 rooms
- 3579+ rooms
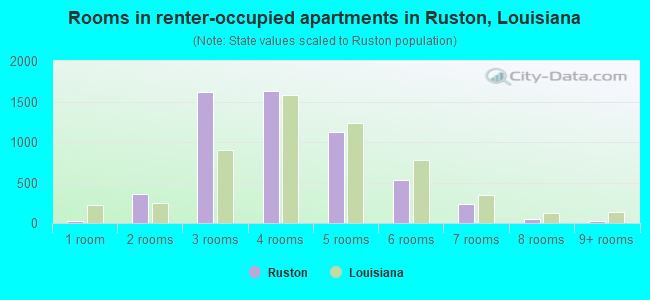
- Rooms in renter-occupied apartments in Ruston, Louisiana
- 191 room
- 3542 rooms
- 1,6153 rooms
- 1,6354 rooms
- 1,1295 rooms
- 5336 rooms
- 2317 rooms
- 458 rooms
- 219+ rooms
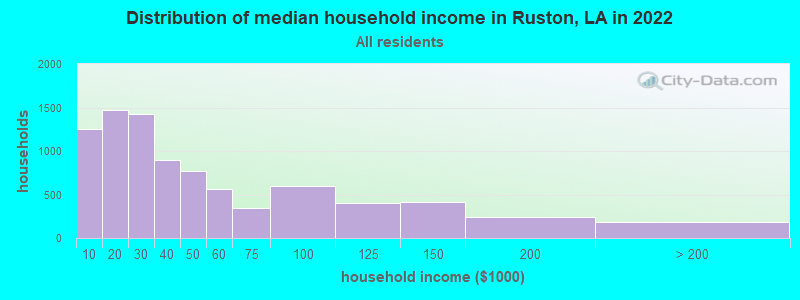
Ruston, LA household income distribution

- 1,258Less than $10,000
- 1,469$10,000 to $19,999
- 1,425$20,000 to $29,999
- 896$30,000 to $39,999
- 774$40,000 to $49,999
- 568$50,000 to $59,999
- 348$60,000 to $74,999
- 593$75,000 to $99,999
- 400$100,000 to $124,999
- 412$125,000 to $149,999
- 246$150,000 to $199,999
- 182$200,000 or more
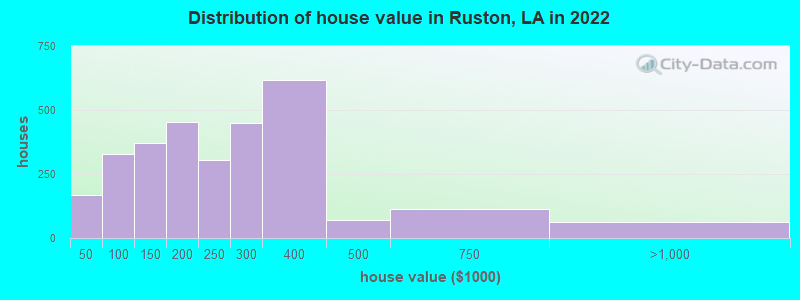
Home value of owner - occupied houses in 2022 in Ruston, LA
-
- 6Less than $10,000
- 57$15,000 to $19,999
- 89$25,000 to $29,999
- 15$30,000 to $34,999
- 0$40,000 to $49,999
- 98$50,000 to $59,999
- 73$60,000 to $69,999
- 136$70,000 to $79,999
- 21$90,000 to $99,999
- 96$100,000 to $124,999
- 274$125,000 to $149,999
- 181$150,000 to $174,999
- 273$175,000 to $199,999
- 306$200,000 to $249,999
- 448$250,000 to $299,999
- 618$300,000 to $399,999
- 70$400,000 to $499,999
- 115$500,000 to $749,999
- 60$750,000 to $999,999
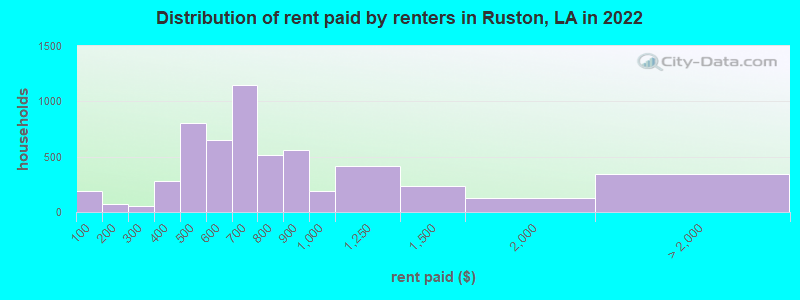
Rent paid by renters in 2022 in Ruston, LA
-
- 194Less than $100
- 21$100 to $149
- 50$150 to $199
- 20$200 to $249
- 32$250 to $299
- 189$300 to $349
- 94$350 to $399
- 448$400 to $449
- 351$450 to $499
- 211$500 to $549
- 435$550 to $599
- 682$600 to $649
- 464$650 to $699
- 147$700 to $749
- 367$750 to $799
- 563$800 to $899
- 187$900 to $999
- 419$1,000 to $1,249
- 233$1,250 to $1,499
- 125$1,500 to $1,999
- 16$2,000 to $2,499
- 52$3,500 or more
- 275No cash rent
Percentage of workers working in this county: 86.2%
Number of people working at home: 1,659 (16.2% of all workers)
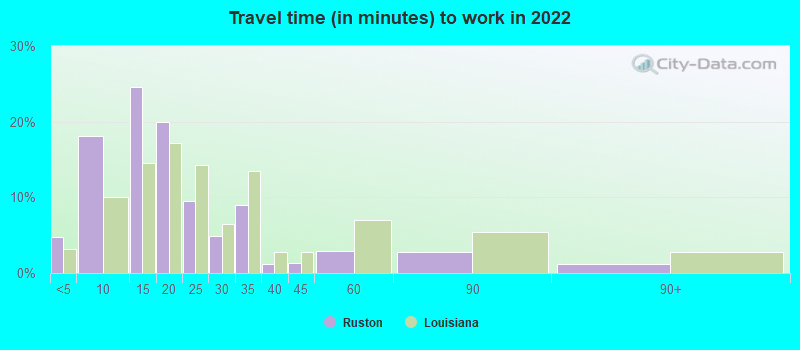
Travel time to work (commute)
- Less than 5 minutes: 623
- 5 to 9 minutes: 2,805
- 10 to 14 minutes: 2,415
- 15 to 19 minutes: 1,244
- 20 to 24 minutes: 192
- 25 to 29 minutes: 129
- 30 to 34 minutes: 711
- 35 to 39 minutes: 153
- 40 to 44 minutes: 164
- 45 to 59 minutes: 197
- 60 to 89 minutes: 96
- 90 or more minutes: 36
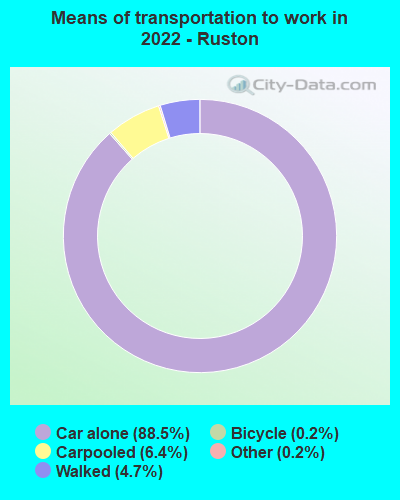
Means of transportation to work:
- Drove a car alone: 13,651 (80.1%)
- Carpooled: 990 (5.8%)
- Taxi: 33 (0.2%)
- Bicycle: 23 (0.1%)
- Walked: 836 (4.9%)
- Worked at home: 1,659 (9.7%)
- Unemployment by race in 2022
- Unemployment rate for White non-Hispanic residents
- 1.9%Males
- 1.0%Females
- Unemployment rate for Black residents
- 5.8%Males
- 2.6%Females
- Unemployment rate for two or more race residents
- 7.8%Males
- 2.7%Females
- Unemployment rate for Hispanic or Latino residents
- 3.3%Females
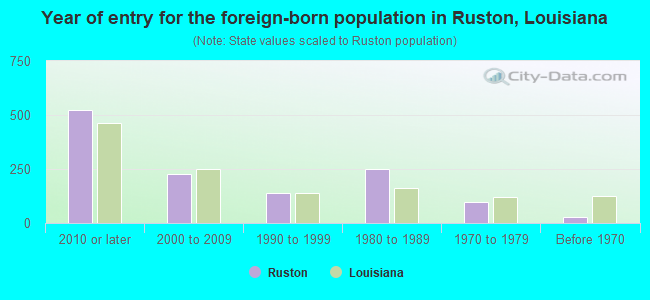
- Year of entry for the foreign-born population in Ruston, Louisiana
- 5222010 or later
- 2262000 to 2009
- 1371990 to 1999
- 2491980 to 1989
- 991970 to 1979
- 30Before 1970
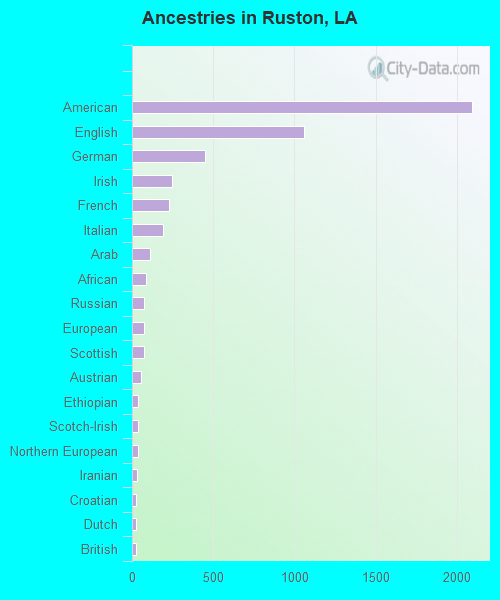
First ancestries reported:
- American: 2,094 (15.1%)
- English: 1,058 (7.6%)
- German: 448 (3.2%)
- Irish: 244 (1.8%)
- French: 228 (1.6%)
- Italian: 194 (1.4%)
- Arab: 113 (0.8%)
- African: 86 (0.6%)
- Russian: 73 (0.5%)
- European: 71 (0.5%)
- Scottish: 71 (0.5%)
- Austrian: 54 (0.4%)
- Ethiopian: 40 (0.3%)
- Scotch-Irish: 38 (0.3%)
- Northern European: 36 (0.3%)
- Iranian: 32 (0.2%)
- Croatian: 26 (0.2%)
- Dutch: 26 (0.2%)
- British: 22 (0.2%)
- Eastern European: 18 (0.1%)
- Welsh: 17 (0.1%)
- Australian: 10 (0.07%)
- Swedish: 9 (0.06%)
- Egyptian: 6 (0.04%)
- Belgian: 6 (0.04%)
- Danish: 2 (0.01%)
- French Canadian: 1 (0.01%)
Most common places of birth for foreign-born residents (%):
| Ruston: | 11.5% (122) |
| Louisiana: | 0.2% (383) |
| Ruston: | 10.8% (115) |
| Louisiana: | 9.2% (18,115) |
| Ruston: | 8.9% (95) |
| Louisiana: | 3.9% (7,741) |
| Ruston: | 8.8% (94) |
| Louisiana: | 12.1% (23,732) |
| Ruston: | 8.3% (88) |
| Louisiana: | 1.2% (2,282) |
| Ruston: | 7.0% (74) |
| Louisiana: | 0.3% (550) |
| Ruston: | 4.4% (47) |
| Louisiana: | 0.5% (935) |
| Ruston: | 4.0% (43) |
| Louisiana: | 3.4% (6,779) |
| Ruston: | 4.0% (42) |
| Louisiana: | 0.7% (1,446) |
| Ruston: | 3.9% (41) |
| Louisiana: | 1.6% (3,186) |
| Ruston: | 3.7% (39) |
| Louisiana: | 0.5% (892) |
| Ruston: | 3.4% (36) |
| Louisiana: | 0.7% (1,435) |
| Ruston: | 2.9% (31) |
| Louisiana: | 1.0% (1,951) |
| Ruston: | 2.8% (30) |
| Louisiana: | 3.1% (6,086) |
| Ruston: | 2.1% (22) |
| Louisiana: | 0.7% (1,368) |
| Ruston: | 1.8% (19) |
| Louisiana: | 0.8% (1,517) |
| Ruston: | 1.6% (17) |
| Louisiana: | 0.8% (1,613) |
| Ruston: | 1.6% (17) |
| Louisiana: | 0.4% (880) |
| Ruston: | 1.5% (16) |
| Louisiana: | 0.1% (247) |
| Ruston: | 1.5% (16) |
| Louisiana: | 0.1% (286) |
Place of birth for U.S.-born residents:
- This state: 16,221
- Other state: 4,718
- Northeast: 194
- Midwest: 586
- South: 3,288
- West: 636
79.1% of Ruston residents lived in the same house 1 years ago.
Out of people who lived in different houses, 33.5% lived in this county.
Out of people who lived in different counties, 77.2% lived in Louisiana.
| Ruston: | 79.1% |
| State average: | 88.3% |
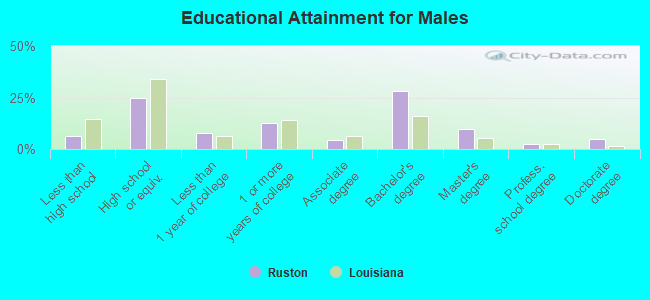
Education attainment for males 25 years and older:
- No schooling: 36
- Nursery to 4th grade: 4
- 5th and 6th grade: 4
- 7th and 8th grade: 13
- 9th grade: 4
- 10th grade: 114
- 11th grade: 94
- 12th grade, no diploma: 18
- High school graduate (or equivalency): 1,162
- Less than 1 year of college: 356
- Some college more than 1 year, no degree: 588
- Associate degree: 205
- Bachelor's degree: 1,319
- Master's degree: 451
- Professional school degree: 122
- Doctorate degree: 220
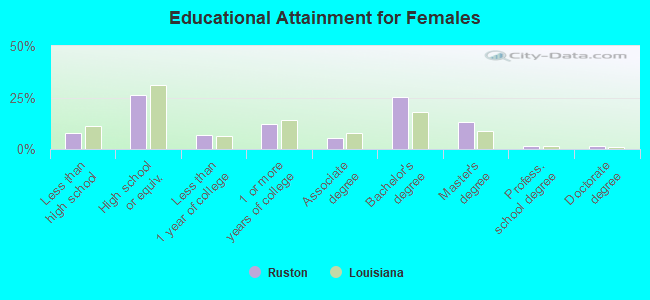
Education attainment for females 25 years and older:
- No schooling: 36
- Nursery to 4th grade: 0
- 5th and 6th grade: 10
- 7th and 8th grade: 39
- 9th grade: 89
- 10th grade: 81
- 11th grade: 93
- 12th grade, no diploma: 80
- High school graduate (or equivalency): 1,462
- Less than 1 year of college: 369
- Some college more than 1 year, no degree: 667
- Associate degree: 307
- Bachelor's degree: 1,402
- Master's degree: 733
- Professional school degree: 82
- Doctorate degree: 81
Housing units in structures:
- One, detached: 4,654
- One, attached: 163
- Two: 1,490
- 3 or 4: 774
- 5 to 9: 925
- 10 to 19: 574
- 20 to 49: 157
- 50 or more: 192
- Mobile homes: 316
- Boats, RVs, vans, etc.: 45
Median worth of mobile homes: $107,661
Housing units lacking complete kitchen facilities in 2022: 2.4%
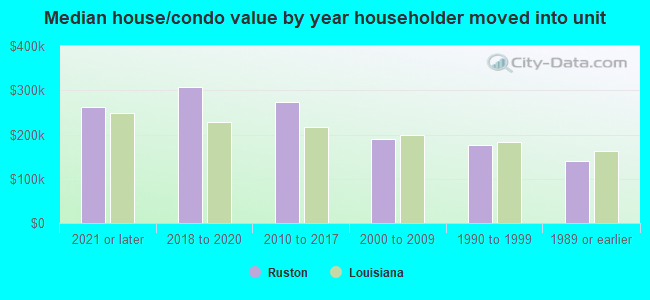
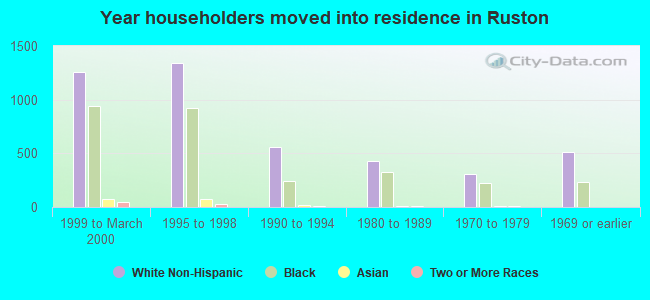
House/condo owner moved in on average 13 years ago
Renter moved in on average 2 years ago
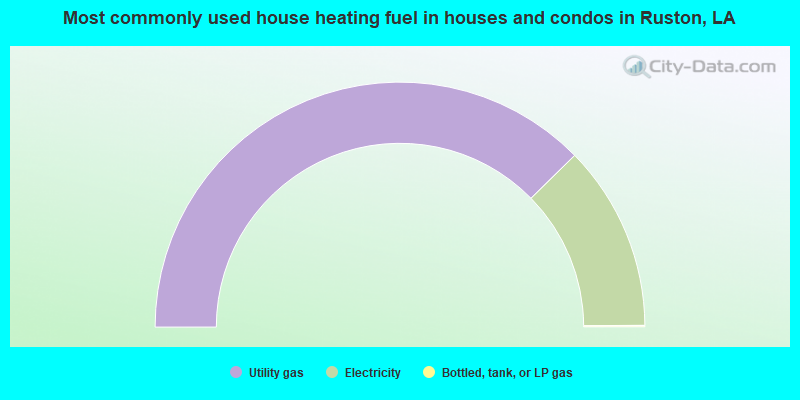
- 75.3%Utility gas
- 24.5%Electricity
- 0.2%Bottled, tank, or LP gas
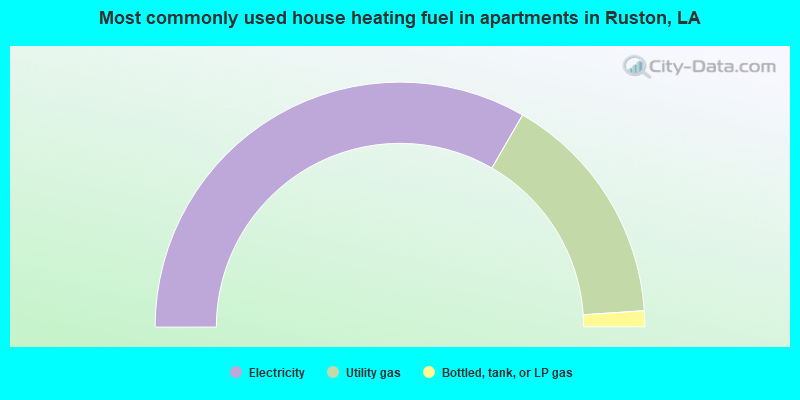
- 66.7%Electricity
- 31.2%Utility gas
- 2.1%Bottled, tank, or LP gas
Private vs. public school enrollment:
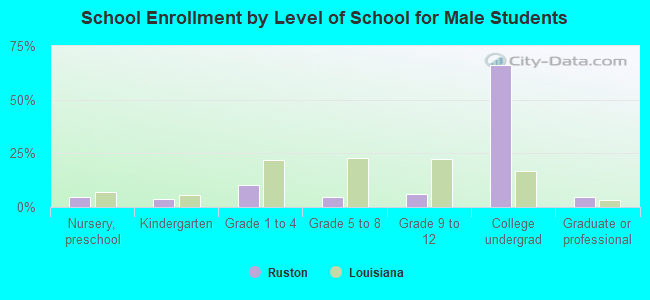
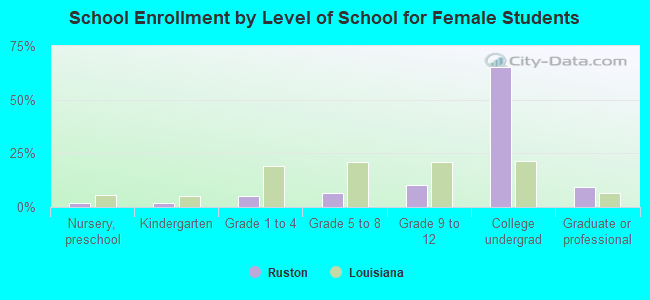
| Here: | 6.8% |
| Louisiana: | 19.6% |
| Here: | 11.9% |
| Louisiana: | 18.3% |
| Here: | 3.2% |
| Louisiana: | 17.4% |