Housing density: 494 houses/condos per square mile
Median price asked for vacant for-sale houses and condos in 2022 in this county: $3,364,178.
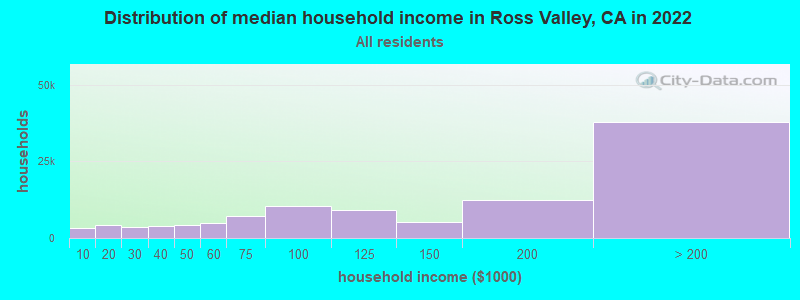
Median contract rent in 2022: over $2,000 (lower quartile is $1,764, upper quartile is over $2,000)
Median rent asked for vacant for-rent units in 2022: $2,544
Median gross rent in Ross Valley, CA in 2022: over $2,000
Housing units in Ross Valley with a mortgage: 10,173 (1,179 second mortgage, 1,734 home equity loan, 57 both second mortgage and home equity loan) Houses without a mortgage: 3,425
Compare current foreclosures near Ross Valley, CA:
In family households: 191,262 (43,203 male householders, 19,450 female householders)
49,659 spouses, 62,232 children (59,064 natural, 1,706 adopted, 1,462 stepchildren), 1,786 grandchildren, 2,214 brothers or sisters, 1,536 parents, foster children, 2,886 other relatives, 7,223 non-relatives
In nonfamily households: 52,103 (16,442 male householders (11,939 living alone)), 24,115 female householders (19,807 living alone)), 11,546 nonrelatives
In group quarters: 9,044 (6,299 institutionalized population)
36,987 married couples with children.
9,764 single-parent households (2,409 men, 7,355 women).
88.0% of residents of Ross Valley speak English at home.
3.7% of residents speak Spanish at home (69% speak English very well, 19% speak English well, 11% speak English not well, 2% don't speak English at all).
6.0% of residents speak other Indo-European language at home (80% speak English very well, 14% speak English well, 6% speak English not well).
1.8% of residents speak Asian or Pacific Island language at home (61% speak English very well, 29% speak English well, 11% speak English not well).
0.5% of residents speak other language at home (67% speak English very well, 30% speak English well, 3% speak English not well).
Foreign born population: 6,878 (11.1%)
(73.0% of them are naturalized citizens)
Percentage of workers working in this county: 76.7% Number of people working at home: 9,017 (32.7% of all workers)
Travel time to work (commute)
Less than 5 minutes: 558
5 to 9 minutes: 2,342
10 to 14 minutes: 3,158
15 to 19 minutes: 3,254
20 to 24 minutes: 2,849
25 to 29 minutes: 1,201
30 to 34 minutes: 2,594
35 to 39 minutes: 860
40 to 44 minutes: 1,123
45 to 59 minutes: 3,501
60 to 89 minutes: 3,280
90 or more minutes: 963
Means of transportation to work:
Drove a car alone: 18,768 (65.9%)
Carpooled: 2,546 (8.9%)
Bus or trolley bus: 1,747 (6.1%)
Subway or elevated: 15 (0.1%)
Ferryboat: 1,133 (4.0%)
Motorcycle: 48 (0.2%)
Bicycle: 421 (1.5%)
Walked: 882 (3.1%)
Other means: 123 (0.4%)
Worked at home: 2,779 (9.8%)
Year of entry for the foreign-born population in Ross Valley, California
8551995 to March 2000
6211990 to 1994
6181985 to 1989
6861980 to 1984
4991975 to 1979
4501970 to 1974
4181965 to 1969
1,752Before 1965
Most common places of birth for foreign-born residents (%):
United Kingdom
Ross Valley:
11.1% (655)
California:
1.5% (133,090)
Canada
Ross Valley:
7.2% (423)
California:
1.6% (141,181)
Germany
Ross Valley:
6.5% (386)
California:
1.1% (98,160)
Mexico
Ross Valley:
5.5% (323)
California:
44.3% (3,928,701)
Brazil
Ross Valley:
4.6% (271)
California:
0.3% (22,931)
Iran
Ross Valley:
4.5% (266)
California:
1.8% (158,613)
France
Ross Valley:
3.9% (233)
California:
0.4% (32,279)
Italy
Ross Valley:
3.7% (221)
California:
0.4% (38,450)
Ireland
Ross Valley:
2.8% (164)
California:
0.2% (20,388)
Korea
Ross Valley:
2.7% (158)
California:
3.0% (268,452)
India
Ross Valley:
2.5% (145)
California:
2.2% (198,201)
Australia
Ross Valley:
2.4% (139)
California:
0.2% (15,391)
Russia
Ross Valley:
2.2% (130)
California:
0.6% (54,660)
Netherlands
Ross Valley:
2.1% (126)
California:
0.3% (22,311)
China, excluding Hong Kong and Taiwan
Ross Valley:
2.1% (123)
California:
3.7% (327,611)
Israel
Ross Valley:
1.8% (109)
California:
0.3% (26,552)
Other Northern Europe
Ross Valley:
1.8% (106)
California:
0.2% (18,478)
Philippines
Ross Valley:
1.8% (104)
California:
7.5% (664,935)
Japan
Ross Valley:
1.7% (103)
California:
1.3% (112,212)
Place of birth for U.S.-born residents:
This state: 32,231
Other state: 20,954
Northeast: 6,494
Midwest: 8,062
South: 3,454
West: 2,944
56% of Ross Valley residents lived in the same house 5 years ago. Out of people who lived in different houses, 53% lived in this county. Out of people who lived in different counties, 74% lived in California.
Education attainment for males 25 years and older:
No schooling: 74
Nursery to 4th grade: 20
5th and 6th grade: 43
7th and 8th grade: 197
9th grade: 103
10th grade: 565
11th grade: 1,580
12th grade, no diploma: 897
High school graduate (or equivalency): 2,499
Less than 1 year of college: 907
Some college more than 1 year, no degree: 3,836
Associate degree: 1,268
Bachelor's degree: 6,400
Master's degree: 2,698
Professional school degree: 2,100
Doctorate degree: 621
Education attainment for females 25 years and older:
No schooling: 80
Nursery to 4th grade: 55
5th and 6th grade: 45
7th and 8th grade: 135
9th grade: 66
10th grade: 72
11th grade: 38
12th grade, no diploma: 311
High school graduate (or equivalency): 2,397
Less than 1 year of college: 885
Some college more than 1 year, no degree: 3,357
Associate degree: 1,527
Bachelor's degree: 8,109
Master's degree: 3,044
Professional school degree: 1,057
Doctorate degree: 484
Housing units in structures:
One, detached: 15,660
One, attached: 1,256
Two: 1,077
3 or 4: 818
5 to 9: 1,401
10 to 19: 1,608
20 to 49: 782
50 or more: 1,103
Mobile homes: 222
Boats, RVs, vans, etc.: 64
Median worth of mobile homes: $121,455
Housing units lacking complete plumbing facilities: 0.5%
Housing units lacking complete kitchen facilities: 0.6%