Rosedale, CA (California) Houses and Residents
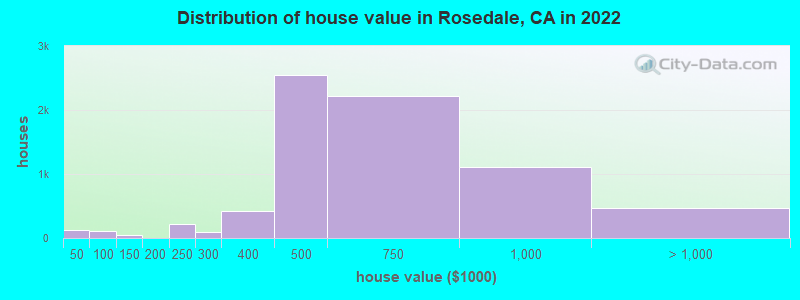
Estimated median house or condo value in 2022: $605,972 (it was $191,000 in 2000 )
Rosedale:
$605,972California:
$715,900
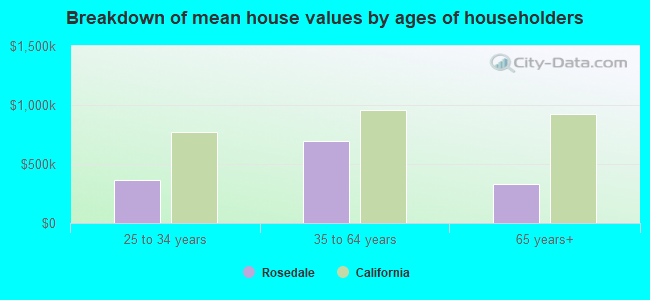
Lower value quartile - upper value quartile: $475,461 - $829,532Mean price in 2022: Detached houses: $716,638 Here:
$716,638State:
$988,808
Townhouses or other attached units: $662,493 Here:
$662,493State:
$838,546
Mobile homes: $160,580 Here:
$160,580State:
$184,506
Occupied boats, RVs, vans, etc.: $18,217 Here:
$18,217State:
$204,957
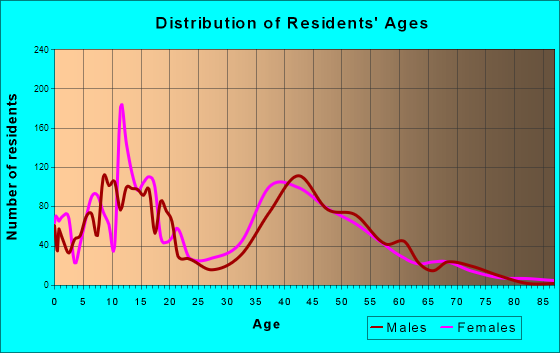
Total population: 14,058 (Urban population: 7,405, Rural population: 1,111 (all nonfarm) )
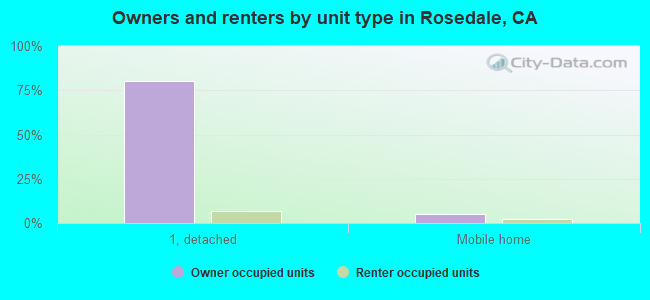
Houses: 6,540 (6,345 occupied: 5,516 owner occupied, 870 renter occupied )
% of renters here:
14%State:
44%
Housing density: 173 houses/condos per square mile
Median price asked for vacant for-sale houses and condos in 2022: $453,831.
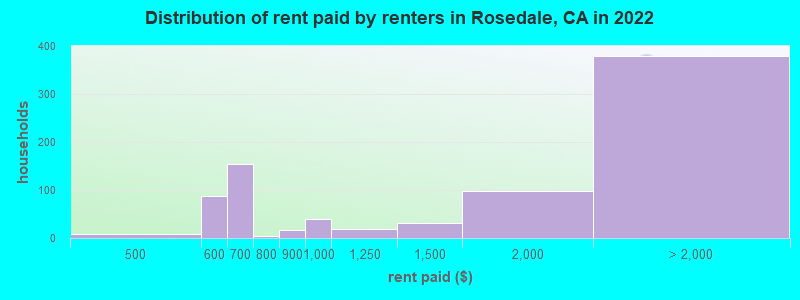
Median contract rent in 2022: $973 (lower quartile is $629, upper quartile is over $2,000)
Median rent asked for vacant for-rent units in 2022: $1,312
Median gross rent in Rosedale, CA in 2022: $1,192
Housing units in Rosedale with a mortgage: 4,349 (201 second mortgage, 0 home equity loan, 95 both second mortgage and home equity loan )Houses without a mortgage: 0
Median household income for houses/condos with a mortgage: $153,692
Median household income for apartments without a mortgage: $107,050
Median monthly housing costs: $2,395
Data:
Median house or condo value ($)
Median house or condo value ($ change since 2000)
Median house or condo value ($) - White
Median house or condo value ($) - Black or African American
Median house or condo value ($) - Asian
Median house or condo value ($) - Hispanic or Latino
Median house or condo value ($) - American Indian and Alaska Native
Median house or condo value ($) - Multirace
Median house or condo value ($) - Other Race
Median price asked for mobile homes ($)
Household density (households per square mile)
Mean house or condo value by units in structure - 1, detached ($)
Mean house or condo value by units in structure - 1, attached ($)
Mean house or condo value by units in structure - 2 ($)
Mean house or condo value by units in structure by units in structure - 3 or 4 ($)
Mean house or condo value by units in structure - 5 or more ($)
Mean house or condo value by units in structure - Boat, RV, van, etc. ($)
Mean house or condo value by units in structure - Mobile home ($)
Median contract rent ($)
Median contract rent - Lower quartile ($)
Median contract rent - Upper quartile ($)
Median gross rent ($)
Urban houses (%)
Rural houses (%)
Houses occupied (%)
Houses occupied (% change since 2000)
Houses owner occupied (%)
Houses owner occupied (% change since 2000)
Houses renter occupied (%)
Houses renter occupied (% change since 2000)
Vacant housing units - For rent (%)
Vacant housing units - For rent (% change since 2000)
Vacant housing units - For sale only (%)
Vacant housing units - For sale only (% change since 2000)
Vacant housing units - Rented or sold, not occupied (%)
Vacant housing units - Rented or sold, not occupied (% change since 2000)
Vacant housing units - For seasonal, recreational, or occasional use (%)
Vacant housing units - For seasonal, recreational, or occasional use (% change since 2000)
Vacant housing units - For migrant workers (%)
Vacant housing units - For migrant workers (% change since 2000)
Vacant housing units - Other vacant (%)
Vacant housing units - Other vacant (% change since 2000)
Median monthly housing costs ($)
Median household income for houses/condos with a mortgage ($)
Median household income for houses/condos without a mortgage ($)
Median household income ($)
Median household income ($) - White
Median household income ($) - Black or African American
Median household income ($) - Asian
Median household income ($) - Hispanic or Latino
Median household income ($) - American Indian and Alaska Native
Median household income ($) - Multirace
Median household income ($) - Other Race
Mortgage status - with mortgage (%)
Mortgage status - with second mortgage (%)
Mortgage status - with home equity loan (%)
Mortgage status - with both second mortgage and home equity loan (%)
Mortgage status - without a mortgage (%)
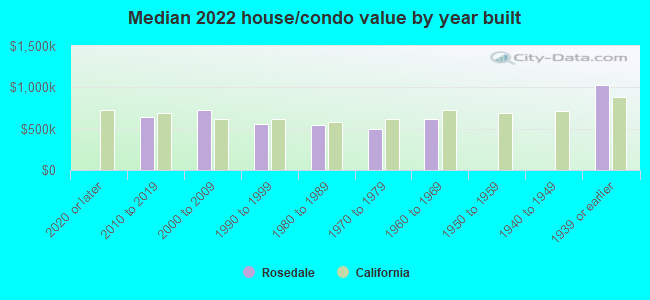
Median year house/condo built
Median year apartment built
Household type by relationship - Male householder living alone (%)
Household type by relationship - Male householder not living alone (%)
Household type by relationship - Female householder living alone (%)
Household type by relationship - Female householder not living alone (%)
Household type by relationship - Opposite-Sex spouse (%)
Household type by relationship - Same-Sex spouse (%)
Household type by relationship - Opposite-Sex unmarried partner (%)
Household type by relationship - Same-Sex unmarried partner (%)
Household type by relationship - In group quarters (%)
Size of family households - 2-person household (%)
Size of family households - 3-person household (%)
Size of family households - 4-person household (%)
Size of family households - 5-person household (%)
Size of family households - 6-person household (%)
Size of family households - 7-or-more-person household (%)
Size of nonfamily households - 1-person household (%)
Size of nonfamily households - 2-person household (%)
Size of nonfamily households - 3-person household (%)
Size of nonfamily households - 4-person household (%)
Size of nonfamily households - 5-person household (%)
Size of nonfamily households - 6-person household (%)
Size of nonfamily households - 7-or-moreperson household (%)
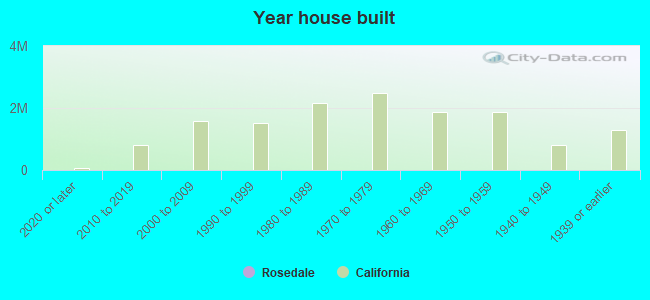
Year house built - Built 2010 or later (%)
Year house built - Built 2000 to 2009 (%)
Year house built - Built 1990 to 1999 (%)
Year house built - Built 1980 to 1989 (%)
Year house built - Built 1970 to 1979 (%)
Year house built - Built 1960 to 1969 (%)
Year house built - Built 1950 to 1959 (%)
Year house built - Built 1940 to 1949 (%)
Year house built - Built 1939 or earlier (%)
Median number of rooms in houses and condos
Median number of rooms in apartments
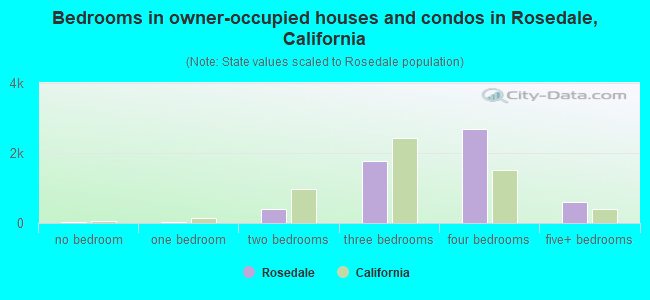
Median number of bedrooms in owner occupied houses
Mean number of bedrooms in owner occupied houses
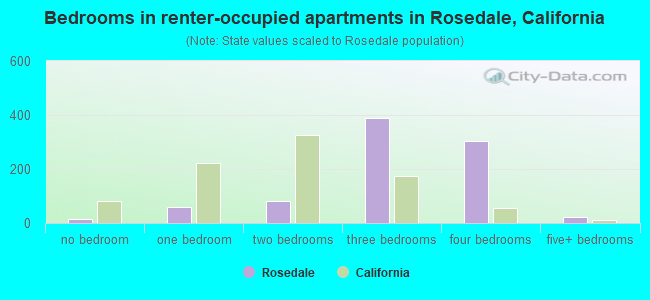
Median number of bedrooms in renter occupied houses
Mean number of bedrooms in renter occupied houses
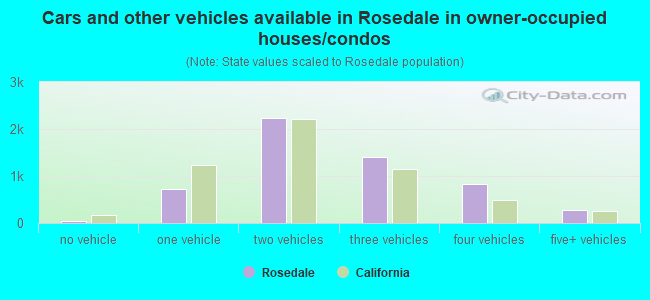
Median number of vehichles in owner occupied houses
Mean number of vehichles in owner occupied houses
Median number of vehichles in renter occupied houses
Mean number of vehichles in renter occupied houses
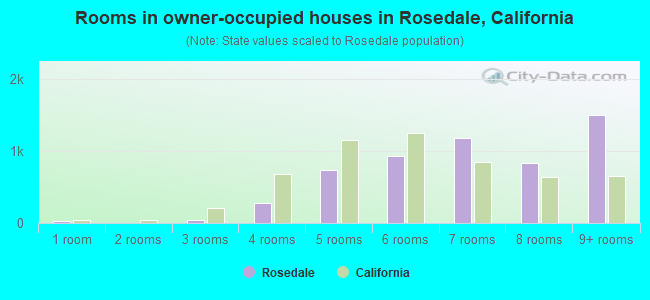
Rooms in owner-occupied houses - 1 room (%)
Rooms in owner-occupied houses - 2 rooms (%)
Rooms in owner-occupied houses - 3 rooms (%)
Rooms in owner-occupied houses - 4 rooms (%)
Rooms in owner-occupied houses - 5 rooms (%)
Rooms in owner-occupied houses - 6 rooms (%)
Rooms in owner-occupied houses - 7 rooms (%)
Rooms in owner-occupied houses - 8 rooms (%)
Rooms in owner-occupied houses - 9+ rooms (%)
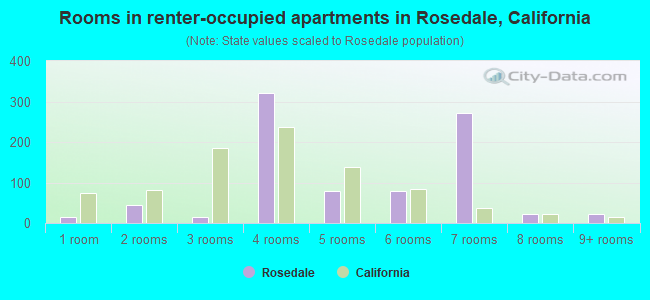
Rooms in renter-occupied houses - 1 room (%)
Rooms in renter-occupied houses - 2 rooms (%)
Rooms in renter-occupied houses - 3 rooms (%)
Rooms in renter-occupied houses - 4 rooms (%)
Rooms in renter-occupied houses - 5 rooms (%)
Rooms in renter-occupied houses - 6 rooms (%)
Rooms in renter-occupied houses - 7 rooms (%)
Rooms in renter-occupied houses - 8 rooms (%)
Rooms in renter-occupied houses - 9+ rooms (%)
Bedrooms in owner-occupied houses - no bedrooms (%)
Bedrooms in owner-occupied houses - 1 bedroom (%)
Bedrooms in owner-occupied houses - 2 bedrooms (%)
Bedrooms in owner-occupied houses - 3 bedrooms (%)
Bedrooms in owner-occupied houses - 4 bedrooms (%)
Bedrooms in owner-occupied houses - 5+ bedrooms (%)
Bedrooms in renter-occupied houses - no bedrooms (%)
Bedrooms in renter-occupied houses - 1 bedroom (%)
Bedrooms in renter-occupied houses - 2 bedrooms (%)
Bedrooms in renter-occupied houses - 3 bedrooms (%)
Bedrooms in renter-occupied houses - 4 bedrooms (%)
Bedrooms in renter-occupied houses - 5+ bedrooms (%)
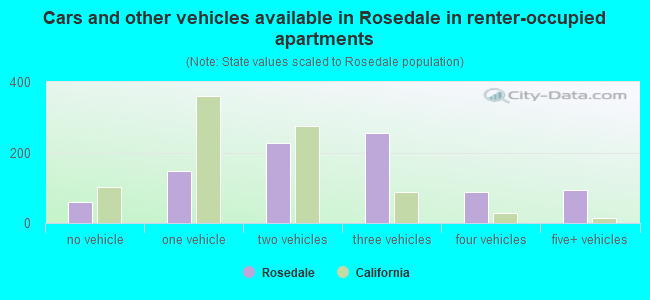
Vehicles available in owner-occupied houses - no vehicle available (%)
Vehicles available in owner-occupied houses - 1 vehicle available(%)
Vehicles available in owner-occupied houses - 2 Vehicles available (%)
Vehicles available in owner-occupied houses - 3 Vehicles available (%)
Vehicles available in owner-occupied houses - 4 Vehicles available (%)
Vehicles available in owner-occupied houses - 5+ Vehicles available (%)
Vehicles available in renter-occupied houses - no vehicle available (%)
Vehicles available in renter-occupied houses - 1 vehicle available (%)
Vehicles available in renter-occupied houses - 2 Vehicles available (%)
Vehicles available in renter-occupied houses - 3 Vehicles available (%)
Vehicles available in renter-occupied houses - 4 Vehicles available (%)
Vehicles available in renter-occupied houses - 5+ Vehicles available (%)
Housing units in structures - 1, detached (%)
Housing units in structures - 1, attached (%)
Housing units in structures - 2 (%)
Housing units in structures - 3 or 4 (%)
Housing units in structures - 5 to 9 (%)
Housing units in structures - 10 to 19 (%)
Housing units in structures - 20 to 49 (%)
Housing units in structures - 50 or more (%)
Housing units in structures - Mobile home (%)
Housing units in structures - Boat, RV, van, etc. (%)
Housing units in structures - Owners - 1, detached (%)
Housing units in structures - Owners - 1, attached (%)
Housing units in structures - Owners - 2 (%)
Housing units in structures - Owners - 3 or 4 (%)
Housing units in structures - Owners - 5 to 9 (%)
Housing units in structures - Owners - 10 to 19 (%)
Housing units in structures - Owners - 20 to 49 (%)
Housing units in structures - Owners - 50 or more (%)
Housing units in structures - Owners - Mobile home (%)
Housing units in structures - Owners - Boat, RV, van, etc. (%)
Housing units in structures - Renters - 1, detached (%)
Housing units in structures - Renters - 1, attached (%)
Housing units in structures - Renters - 2 (%)
Housing units in structures - Renters - 3 or 4 (%)
Housing units in structures - Renters - 5 to 9 (%)
Housing units in structures - Renters - 10 to 19 (%)
Housing units in structures - Renters - 20 to 49 (%)
Housing units in structures - Renters - 50 or more (%)
Housing units in structures - Renters - Mobile home (%)
Housing units in structures - Renters - Boat, RV, van, etc. (%)
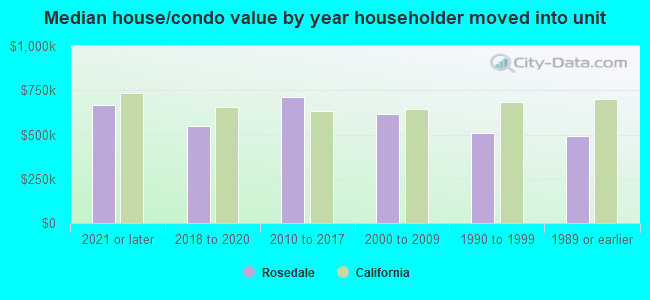
House/condo owner moved in on average (years ago)
Renter moved in on average (years ago)
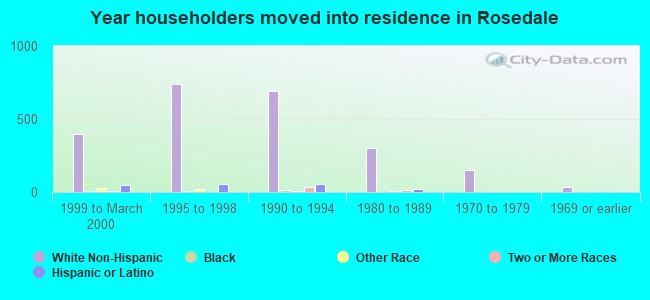
Year householder moved into unit - Moved in 1999 to March 2000 (%)
Year householder moved into unit - Moved in 1999 to March 2000 (%) - White
Year householder moved into unit - Moved in 1999 to March 2000 (%) - Black or African American
Year householder moved into unit - Moved in 1999 to March 2000 (%) - Asian
Year householder moved into unit - Moved in 1999 to March 2000 (%) - Hispanic or Latino
Year householder moved into unit - Moved in 1999 to March 2000 (%) - American Indian and Alaska Native
Year householder moved into unit - Moved in 1999 to March 2000 (%) - Multirace
Year householder moved into unit - Moved in 1999 to March 2000 (%) - Other Race
Year householder moved into unit - Moved in 1995 to 1998 (%)
Year householder moved into unit - Moved in 1995 to 1998 (%) - White
Year householder moved into unit - Moved in 1995 to 1998 (%) - Black or African American
Year householder moved into unit - Moved in 1995 to 1998 (%) - Asian
Year householder moved into unit - Moved in 1995 to 1998 (%) - Hispanic or Latino
Year householder moved into unit - Moved in 1995 to 1998 (%) - American Indian and Alaska Native
Year householder moved into unit - Moved in 1995 to 1998 (%) - Multirace
Year householder moved into unit - Moved in 1995 to 1998 (%) - Other Race
Year householder moved into unit - Moved in 1990 to 1994 (%)
Year householder moved into unit - Moved in 1990 to 1994 (%) - White
Year householder moved into unit - Moved in 1990 to 1994 (%) - Black or African American
Year householder moved into unit - Moved in 1990 to 1994 (%) - Asian
Year householder moved into unit - Moved in 1990 to 1994 (%) - Hispanic or Latino
Year householder moved into unit - Moved in 1990 to 1994 (%) - American Indian and Alaska Native
Year householder moved into unit - Moved in 1990 to 1994 (%) - Multirace
Year householder moved into unit - Moved in 1990 to 1994 (%) - Other Race
Year householder moved into unit - Moved in 1980 to 1989 (%)
Year householder moved into unit - Moved in 1980 to 1989 (%) - White
Year householder moved into unit - Moved in 1980 to 1989 (%) - Black or African American
Year householder moved into unit - Moved in 1980 to 1989 (%) - Asian
Year householder moved into unit - Moved in 1980 to 1989 (%) - Hispanic or Latino
Year householder moved into unit - Moved in 1980 to 1989 (%) - American Indian and Alaska Native
Year householder moved into unit - Moved in 1980 to 1989 (%) - Multirace
Year householder moved into unit - Moved in 1980 to 1989 (%) - Other Race
Year householder moved into unit - Moved in 1970 to 1979 (%)
Year householder moved into unit - Moved in 1970 to 1979 (%) - White
Year householder moved into unit - Moved in 1970 to 1979 (%) - Black or African American
Year householder moved into unit - Moved in 1970 to 1979 (%) - Asian
Year householder moved into unit - Moved in 1970 to 1979 (%) - Hispanic or Latino
Year householder moved into unit - Moved in 1970 to 1979 (%) - American Indian and Alaska Native
Year householder moved into unit - Moved in 1970 to 1979 (%) - Multirace
Year householder moved into unit - Moved in 1970 to 1979 (%) - Other Race
Year householder moved into unit - Moved in 1969 or earlier (%)
Year householder moved into unit - Moved in 1969 or earlier (%) - White
Year householder moved into unit - Moved in 1969 or earlier (%) - Black or African American
Year householder moved into unit - Moved in 1969 or earlier (%) - Asian
Year householder moved into unit - Moved in 1969 or earlier (%) - Hispanic or Latino
Year householder moved into unit - Moved in 1969 or earlier (%) - American Indian and Alaska Native
Year householder moved into unit - Moved in 1969 or earlier (%) - Multirace
Year householder moved into unit - Moved in 1969 or earlier (%) - Other Race
Housing units lacking complete plumbing facilities (%)
Housing units lacking complete kitchen facilities (%)
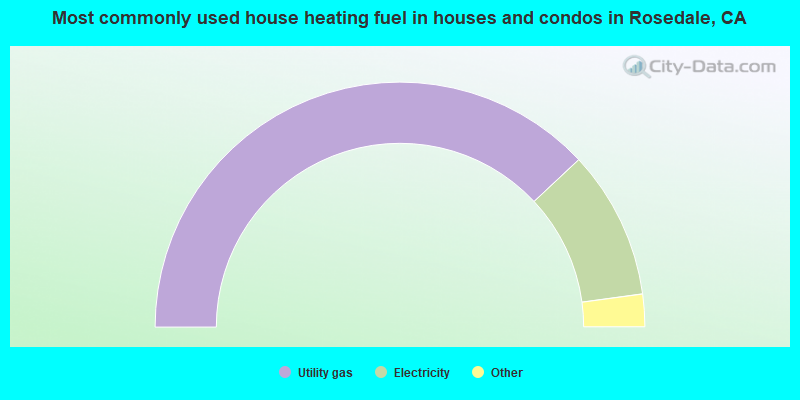
House heating fuel used in houses and condos - Utility gas (%)
House heating fuel used in houses and condos - Bottled, tank, or LP gas (%)
House heating fuel used in houses and condos - Electricity (%)
House heating fuel used in houses and condos - Fuel oil, kerosene, etc. (%)
House heating fuel used in houses and condos - Coal or coke (%)
House heating fuel used in houses and condos - Wood (%)
House heating fuel used in houses and condos - Solar energy (%)
House heating fuel used in houses and condos - Other fuel (%)
House heating fuel used in houses and condos - No fuel used (%)
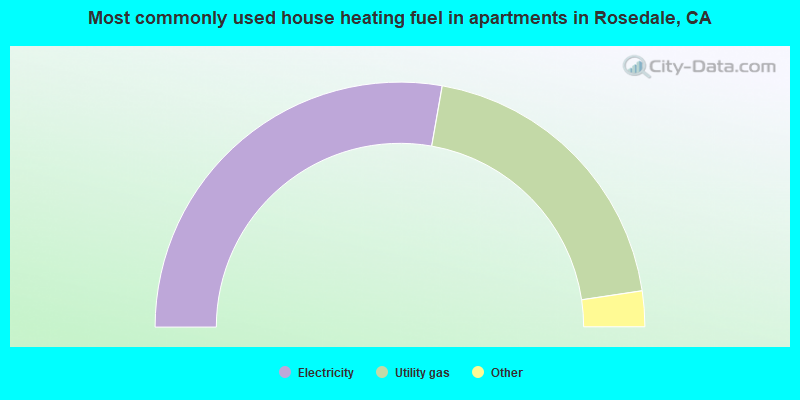
House heating fuel used in apartments - Utility gas (%)
House heating fuel used in apartments - Bottled, tank, or LP gas (%)
House heating fuel used in apartments - Electricity (%)
House heating fuel used in apartments - Fuel oil, kerosene, etc. (%)
House heating fuel used in apartments - Coal or coke (%)
House heating fuel used in apartments - Wood (%)
House heating fuel used in apartments - Solar energy (%)
House heating fuel used in apartments - Other fuel (%)
House heating fuel used in apartments - No fuel used (%)
Latest news about housing in Rosedale, CA collected exclusively by city-data.com from local newspapers, TV, and radio stations
Median year house/condo built: 1999Median year apartment built: 2003Household type by relationship:
Households: 19,369
Male householders: 3,500 (584 living alone ), Female householders: 2,815 (531 living alone )4,393 spouses (4,370 opposite-sex spouses ), 254 unmarried partners , (242 opposite-sex unmarried partners ), 7,422 children (7,096 natural , 53 adopted , 272 stepchildren ), 208 grandchildren , 49 brothers or sisters , 212 parents , 0 foster children , 251 other relatives , 247 non-relatives In group quarters: 14
Size of family households: 1,849 2-persons , 941 3-persons , 1,187 4-persons , 568 5-persons , 401 6-persons , 63 7-or-more-persons .
Size of nonfamily households: 1,117 1-person , 157 2-persons , 23 3-persons , 10 4-persons .
3,966 married couples with children. single-parent households (237 men , 313 women ).
85.4% of residents of Rosedale speak English at home. of residents speak Spanish at home (84% speak English very well , 7% speak English well , 2% speak English not well , 8% don't speak English at all ).of residents speak other Indo-European language at home (69% speak English very well , 28% speak English well , 3% speak English not well ).of residents speak Asian or Pacific Island language at home (88% speak English very well , 7% speak English not well , 6% don't speak English at all ).of residents speak other language at home (62% speak English very well , 38% speak English well ).
Foreign born population: 1,296 (6.7%)of them are naturalized citizens )
Median number of rooms in houses and condos:
Median number of rooms in apartments
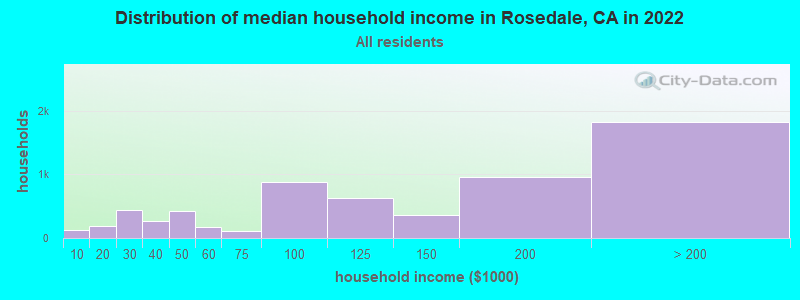
Rosedale, CA household income distribution 131 Less than $10,000181 $10,000 to $19,999439 $20,000 to $29,999268 $30,000 to $39,999420 $40,000 to $49,999167 $50,000 to $59,999115 $60,000 to $74,999885 $75,000 to $99,999630 $100,000 to $124,999358 $125,000 to $149,999955 $150,000 to $199,9991,821 $200,000 or more
Home value of owner - occupied houses in 2022 in Rosedale, CA 9 Less than $10,00024 $20,000 to $24,99932 $35,000 to $39,99960 $40,000 to $49,9998 $60,000 to $69,99921 $70,000 to $79,99916 $80,000 to $89,9992 $90,000 to $99,99940 $100,000 to $124,9994 $150,000 to $174,999225 $200,000 to $249,99994 $250,000 to $299,999419 $300,000 to $399,9992,554 $400,000 to $499,9992,224 $500,000 to $749,9991,113 $750,000 to $999,999120 $1,000,000 to $1,499,99956 $1,500,000 to $1,999,999295 $2,000,000 or moreRent paid by renters in 2022 in Rosedale, CA 7 $400 to $44987 $550 to $599119 $600 to $64934 $650 to $6994 $700 to $74915 $800 to $89940 $900 to $99917 $1,000 to $1,24931 $1,250 to $1,49997 $1,500 to $1,999114 $2,000 to $2,49952 $2,500 to $2,999212 No cash rent
Percentage of workers working in this county: 96.7%Number of people working at home: 869 (9.6% of all workers )
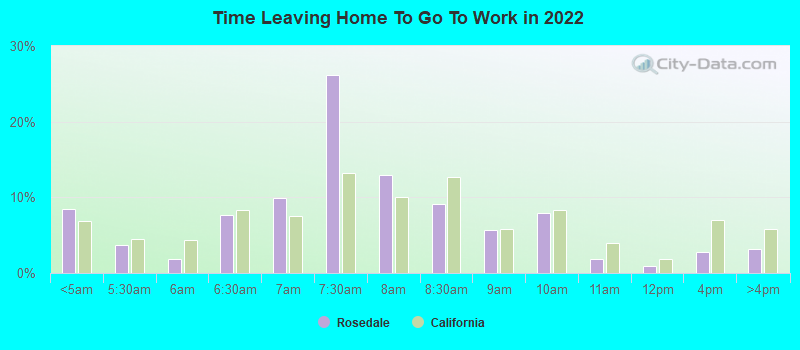
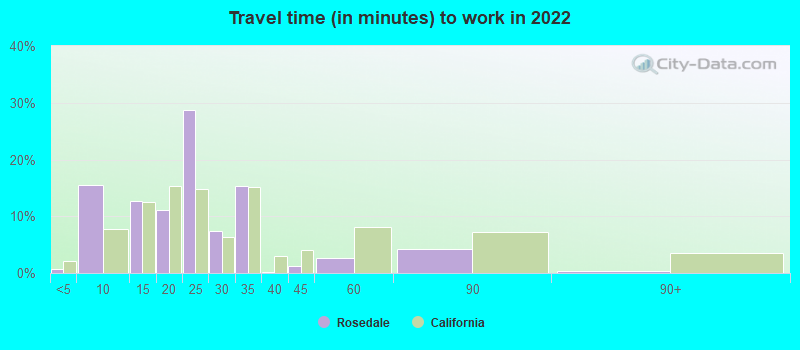
Travel time to work (commute)
Less than 5 minutes: 705 to 9 minutes: 43410 to 14 minutes: 1,06015 to 19 minutes: 1,33020 to 24 minutes: 1,93825 to 29 minutes: 97630 to 34 minutes: 1,03735 to 39 minutes: 14240 to 44 minutes: 28645 to 59 minutes: 53560 to 89 minutes: 10590 or more minutes: 327
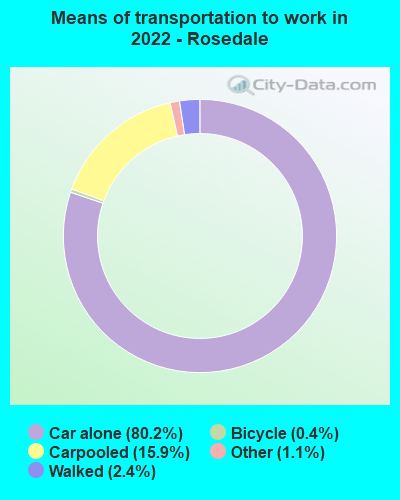
Means of transportation to work:
Drove a car alone: 2,415 (63.3%)Carpooled: 478 (12.5%)Taxi: 43 (1.1%)Bicycle: 7 (0.2%)Walked: 82 (2.1%)Worked at home: 869 (22.8%)
Unemployment by race in 2022
Unemployment rate for White non-Hispanic residents 0.7% Males4.4% FemalesUnemployment rate for Black residents 17.2% FemalesUnemployment rate for Asian residents 11.3% MalesUnemployment rate for two or more race residents 1.3% Males9.2% FemalesUnemployment rate for Hispanic or Latino residents 2.7% Males2.6% Females
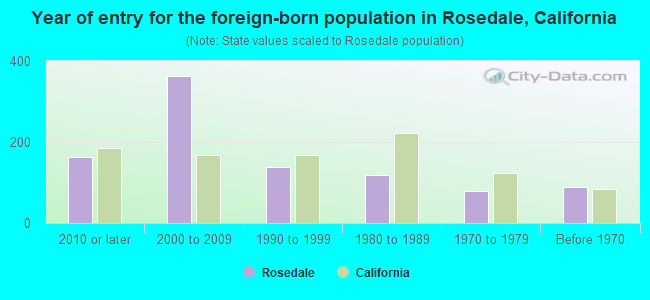
Year of entry for the foreign-born population in Rosedale, California
164 2010 or later 362 2000 to 2009 138 1990 to 1999 119 1980 to 1989 78 1970 to 1979 88 Before 1970
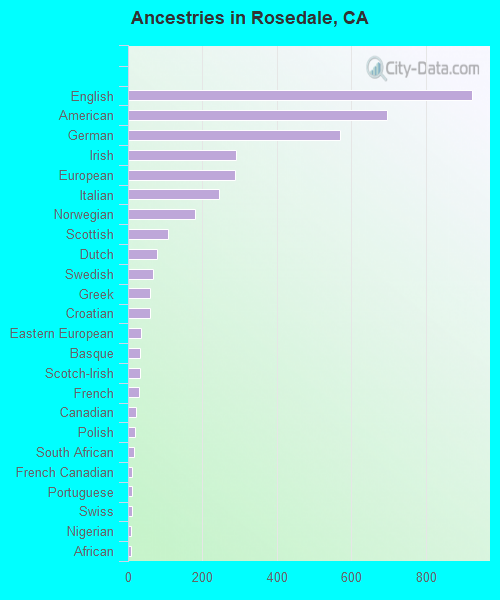
First ancestries reported:
English: 923 (10.2%)
American: 696 (7.7%)
German: 568 (6.3%)
Irish: 289 (3.2%)
European: 286 (3.2%)
Italian: 243 (2.7%)
Norwegian: 179 (2.0%)
Scottish: 107 (1.2%)
Dutch: 77 (0.9%)
Swedish: 66 (0.7%)
Greek: 60 (0.7%)
Croatian: 58 (0.6%)
Eastern European: 35 (0.4%)
Basque: 31 (0.3%)
Scotch-Irish: 31 (0.3%)
French: 30 (0.3%)
Canadian: 22 (0.2%)
Polish: 19 (0.2%)
South African: 17 (0.2%)
French Canadian: 12 (0.1%)
Portuguese: 12 (0.1%)
Swiss: 11 (0.1%)
Nigerian: 9 (0.10%)
African: 9 (0.10%)
Scandinavian: 7 (0.08%)
Finnish: 6 (0.07%)
British: 4 (0.04%)
Northern European: 3 (0.03%)
Welsh: 3 (0.03%)
Danish: 1 (0.01%) Most common places of birth for foreign-born residents (%): Mexico Rosedale:
46.1% (610)California:
37.2% (3,881,193)
Canada Rosedale:
9.1% (121)California:
1.2% (127,477)
China, excluding Hong Kong and Taiwan Rosedale:
6.6% (87)California:
6.6% (684,672)
Philippines Rosedale:
5.1% (68)California:
7.8% (818,297)
India Rosedale:
4.1% (54)California:
5.2% (539,184)
Thailand Rosedale:
3.9% (52)California:
0.6% (65,335)
Burma (Myanmar) Rosedale:
3.5% (46)California:
0.3% (28,176)
Greece Rosedale:
3.1% (41)California:
0.1% (10,538)
Ecuador Rosedale:
2.6% (35)California:
0.2% (21,276)
Kenya Rosedale:
2.6% (34)California:
0.1% (12,503)
Honduras Rosedale:
1.7% (23)California:
0.6% (66,590)
South Africa Rosedale:
1.6% (21)California:
0.2% (20,614)
Place of birth for U.S.-born residents:
This state: 15,452Other state: 2,477Northeast: 305Midwest: 738South: 839West: 536 96.7% of Rosedale residents lived in the same house 1 years ago.
Out of people who lived in different houses, 42.3% lived in this county.
Out of people who lived in different counties, 75.9% lived in California.
Rosedale:
96.7%State average:
88.9%
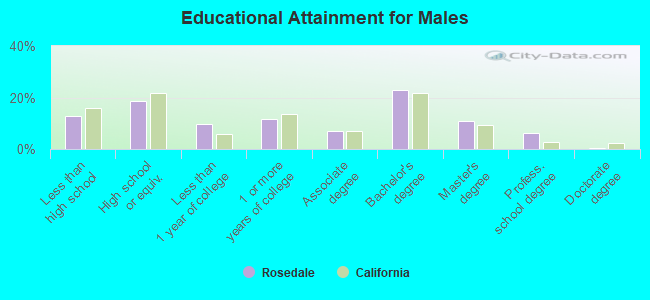
Education attainment for males 25 years and older:
No schooling: 271Nursery to 4th grade: 05th and 6th grade: 417th and 8th grade: 1679th grade: 010th grade: 17211th grade: 3812th grade, no diploma: 152High school graduate (or equivalency): 1,213Less than 1 year of college: 644Some college more than 1 year, no degree: 768Associate degree: 451Bachelor's degree: 1,495Master's degree: 713Professional school degree: 411Doctorate degree: 15
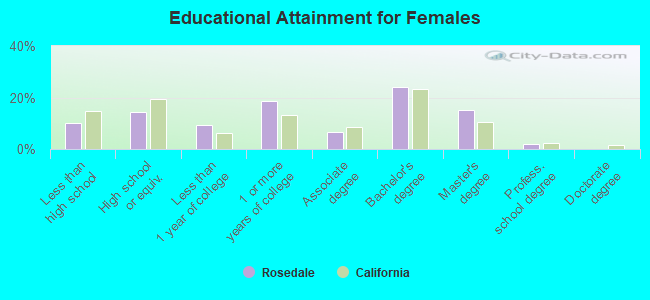
Education attainment for females 25 years and older:
No schooling: 56Nursery to 4th grade: 475th and 6th grade: 947th and 8th grade: 1329th grade: 710th grade: 4111th grade: 17912th grade, no diploma: 82High school graduate (or equivalency): 912Less than 1 year of college: 591Some college more than 1 year, no degree: 1,197Associate degree: 426Bachelor's degree: 1,531Master's degree: 979Professional school degree: 135Doctorate degree: 0
Housing units in structures:
One, detached: 5,949One, attached: 157Two: 263 or 4: 6510 to 19: 1620 to 49: 750 or more: 28Mobile homes: 260Boats, RVs, vans, etc.: 28Median worth of mobile homes: $48,219
House/condo owner moved in on average 10 years ago
Renter moved in on average 8 years ago
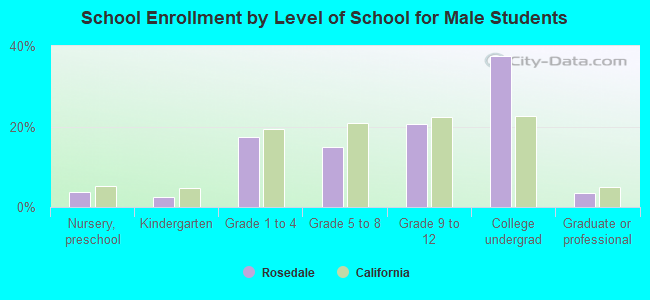
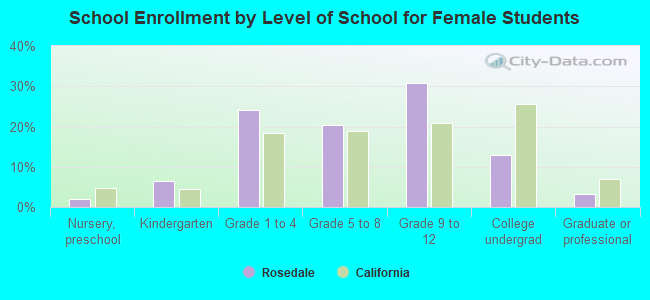
Private vs. public school enrollment:
Students in private schools in grades 1 to 8 (elementary and middle school): 454 Here:
21.5%California:
10.5%
Students in private schools in grades 9 to 12 (high school): 130 Students in private undergraduate colleges: 70 Here:
4.8%California:
15.9%