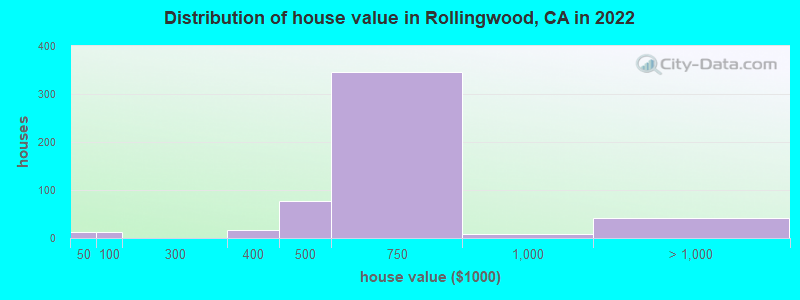
Housing density: 4,230 houses/condos per square mile
Median price asked for vacant for-sale houses and condos in 2022 in this county: $378,161.
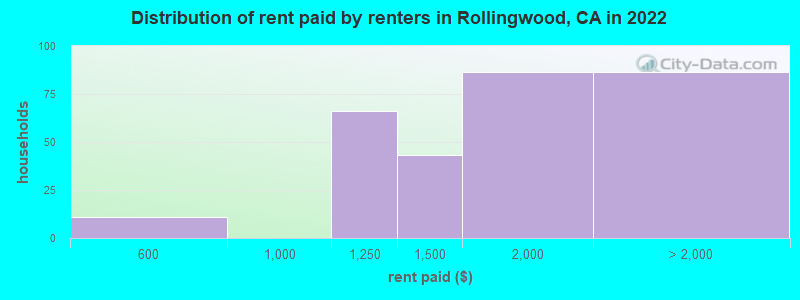
Median contract rent in 2022: $1,630 (lower quartile is $1,254, upper quartile is over $2,000)
Median rent asked for vacant for-rent units in 2022: $1,142
Median gross rent in Rollingwood, CA in 2022: $1,771
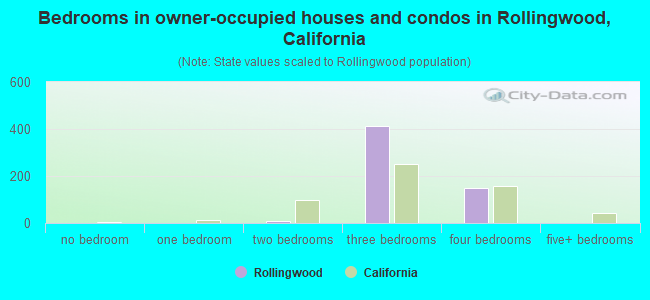
Housing units in Rollingwood with a mortgage: 426 (0 second mortgage, 0 home equity loan, 0 both second mortgage and home equity loan) Houses without a mortgage: 18
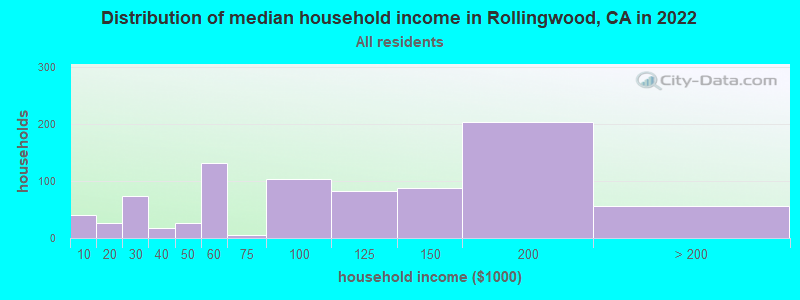
Median household income for houses/condos with a mortgage: $97,867
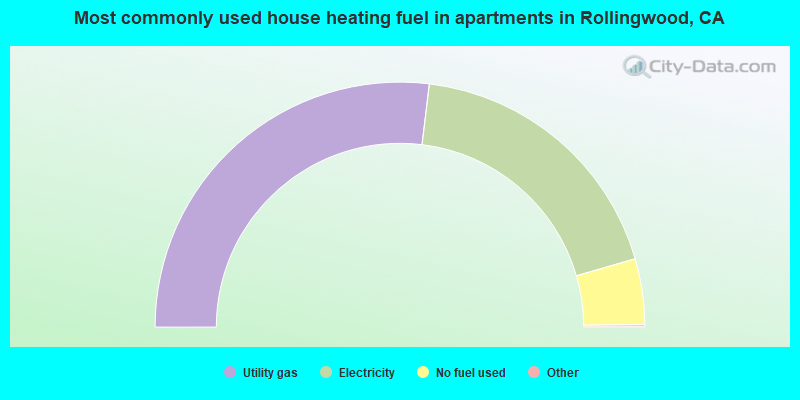
Median household income for apartments without a mortgage: $103,056
Median monthly housing costs: $1,465
Compare current foreclosures near Rollingwood, CA:
#1
$556,400
Seminary Ave
Oakland, CA 94605
1,552
sq. feet
1
baths
3
beds
#2
$529,000
Hastings Ave
Vallejo, CA 94589
1,104
sq. feet
2
baths
3
beds
#3
$868,400
Catalina Dr
Hercules, CA 94547
2,518
sq. feet
3
baths
5
beds
#4
$609,000
Limestone Dr
Vallejo, CA 94589
1,677
sq. feet
2
baths
4
beds
#5
$149,900
Thorndale Dr Apt 435
San Rafael, CA 94903
1,096
sq. feet
2
baths
2
beds
#6
$349,900
2nd St
Richmond, CA 94801
887
sq. feet
1
baths
3
beds
#7
$350,000
Christie Ave
Emeryville, CA 94608
634
sq. feet
1
baths
1
beds
#8
Mohr Ln Apt C
Concord, CA 94518
870
sq. feet
1
baths
2
beds
#9
El Portal Dr Apt D
San Pablo, CA 94806
1,058
sq. feet
2
baths
2
beds
#10
Kelsey St
Richmond, CA 94801
1,080
sq. feet
3
baths
4
beds
#11
21st St
San Pablo, CA 94806
1,665
sq. feet
2
baths
3
beds
#12
Davis St
Oakland, CA 94601
1,408
sq. feet
2
baths
3
beds
#13
83rd Ave
Oakland, CA 94621
1,304
sq. feet
1
baths
3
beds
#14
$62,950
Overland Ave
Emeryville, CA 94608
-
sq. feet
-
baths
-
beds
#15
N Camino Alto Unit 136
Vallejo, CA 94589
441
sq. feet
1
baths
1
beds
#16
Sunnyside Ct
Orinda, CA 94563
2,700
sq. feet
3
baths
5
beds
#17
Duperu Dr
Crockett, CA 94525
2,476
sq. feet
3
baths
4
beds
#18
Greenwich St Apt 3
San Francisco, CA 94109
998
sq. feet
1
baths
1
beds
#19
82nd Ave
Oakland, CA 94621
926
sq. feet
1
baths
2
beds
#20
S 37th St
Richmond, CA 94804
1,352
sq. feet
1
baths
2
beds
#21
Rancho Rd
El Sobrante, CA 94803
1,644
sq. feet
2
baths
4
beds
#22
Grant St
Vallejo, CA 94590
929
sq. feet
2
baths
3
beds
#23
Outlook Ave
Oakland, CA 94605
1,305
sq. feet
3
baths
4
beds
#24
Los Angeles St
Emeryville, CA 94608
803
sq. feet
1
baths
2
beds
#25
Warford Ave
Vallejo, CA 94591
1,015
sq. feet
1
baths
3
beds
#26
Weld St
Oakland, CA 94621
864
sq. feet
1
baths
2
beds
#27
Bryant St San Francisco, Ca 94105 Aka 38 Bryant St #809
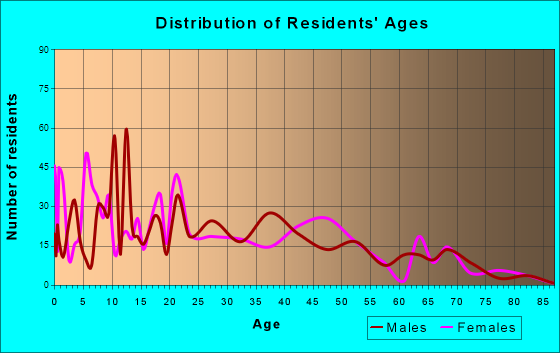
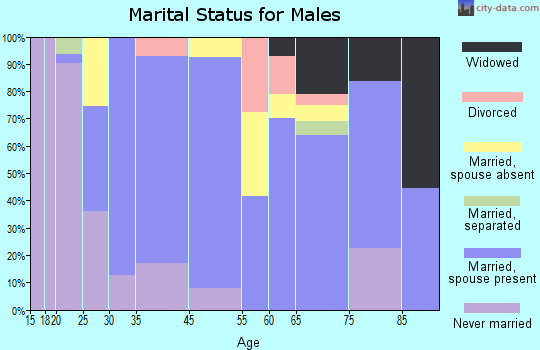
690 married couples with children.
45 single-parent households (17 men, 28 women).
16.8% of residents of Rollingwood speak English at home.
64.1% of residents speak Spanish at home (49% speak English very well, 29% speak English well, 15% speak English not well, 6% don't speak English at all).
6.7% of residents speak other Indo-European language at home (45% speak English very well, 52% speak English well, 3% speak English not well).
16.2% of residents speak Asian or Pacific Island language at home (17% speak English very well, 28% speak English well, 55% speak English not well).
Foreign born population: 1,791 (51.7%)
(67.8% of them are naturalized citizens)
Percentage of workers working in this county: 46.2% Number of people working at home: 41 (2.7% of all workers)
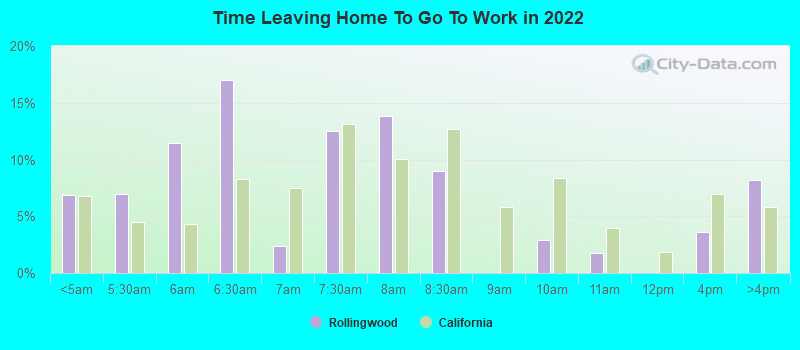
Travel time to work (commute)
Less than 5 minutes: 24
5 to 9 minutes: 12
10 to 14 minutes: 158
15 to 19 minutes: 328
20 to 24 minutes: 157
25 to 29 minutes: 46
30 to 34 minutes: 95
35 to 39 minutes: 102
40 to 44 minutes: 99
45 to 59 minutes: 138
60 to 89 minutes: 235
90 or more minutes: 46
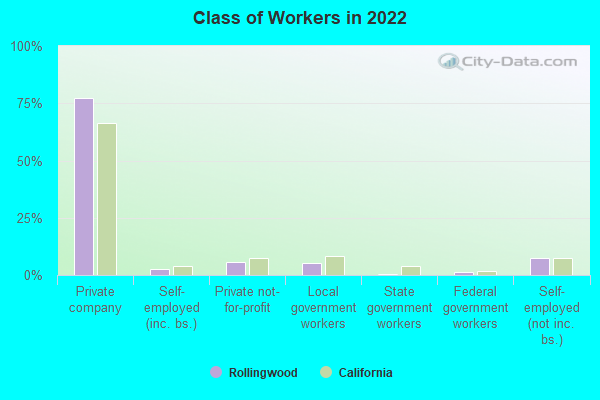
Means of transportation to work:
Drove a car alone: 626 (61.9%)
Carpooled: 301 (29.7%)
Bus or trolley bus: 27 (2.7%)
Subway or elevated: 25 (2.5%)
Railroad: 9 (0.9%)
Bicycle: 6 (0.6%)
Other means: 13 (1.3%)
Worked at home: 5 (0.5%)
Unemployment by race in 2022
Unemployment rate for White non-Hispanic residents
33.5%Males
Unemployment rate for Asian residents
4.7%Males
43.6%Females
Unemployment rate for other race residents
12.9%Females
Unemployment rate for two or more race residents
11.3%Females
Unemployment rate for Hispanic or Latino residents
2.1%Males
11.5%Females
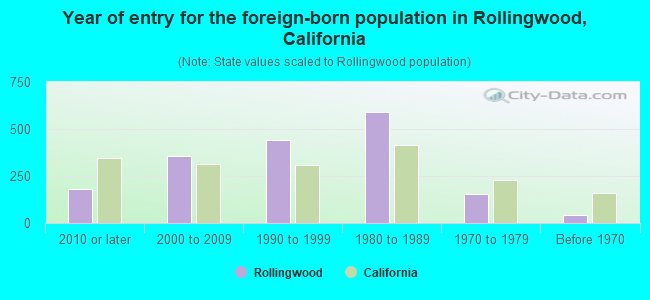
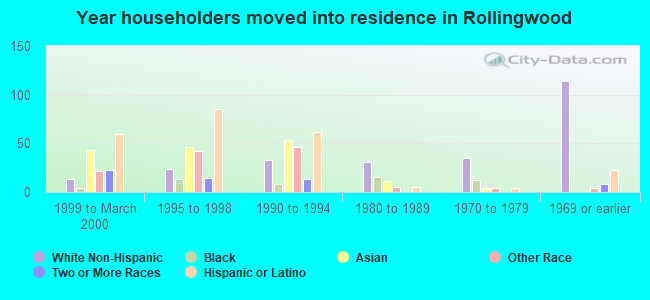
Year of entry for the foreign-born population in Rollingwood, California
1832010 or later
3542000 to 2009
4441990 to 1999
5921980 to 1989
1561970 to 1979
42Before 1970
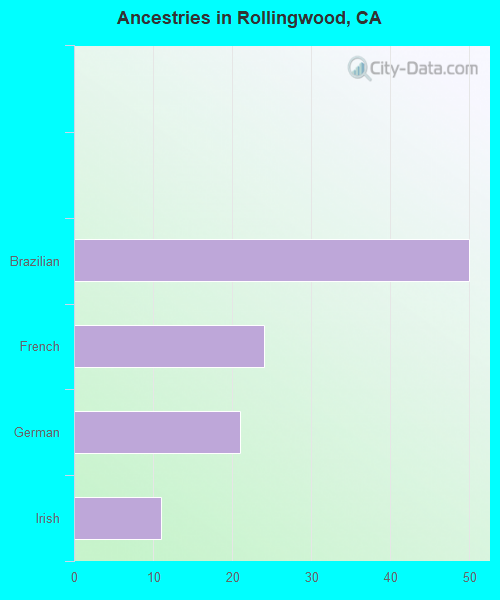
First ancestries reported:
Brazilian: 50 (1.8%)
French: 24 (0.9%)
German: 21 (0.8%)
Irish: 11 (0.4%)
Most common places of birth for foreign-born residents (%):
Mexico
Rollingwood:
34.0% (576)
California:
37.2% (3,881,193)
Vietnam
Rollingwood:
16.4% (277)
California:
4.9% (512,335)
El Salvador
Rollingwood:
15.3% (259)
California:
4.2% (440,287)
Guatemala
Rollingwood:
6.7% (114)
California:
2.8% (290,436)
Nicaragua
Rollingwood:
5.2% (88)
California:
0.6% (58,161)
Philippines
Rollingwood:
5.1% (87)
California:
7.8% (818,297)
India
Rollingwood:
3.8% (64)
California:
5.2% (539,184)
Nepal
Rollingwood:
2.7% (46)
California:
0.2% (16,541)
Cambodia
Rollingwood:
2.7% (46)
California:
0.5% (51,974)
Laos
Rollingwood:
2.4% (41)
California:
0.5% (48,911)
Honduras
Rollingwood:
2.2% (37)
California:
0.6% (66,590)
Brazil
Rollingwood:
1.9% (32)
California:
0.5% (53,222)
Place of birth for U.S.-born residents:
This state: 1,557
Other state: 99
Northeast: 6
Midwest: 36
South: 52
West: 4
97.7% of Rollingwood residents lived in the same house 1 years ago. Out of people who lived in different houses, 34.7% lived in this county. Out of people who lived in different counties, 79.5% lived in California.
Rollingwood:
97.7%
State average:
88.9%
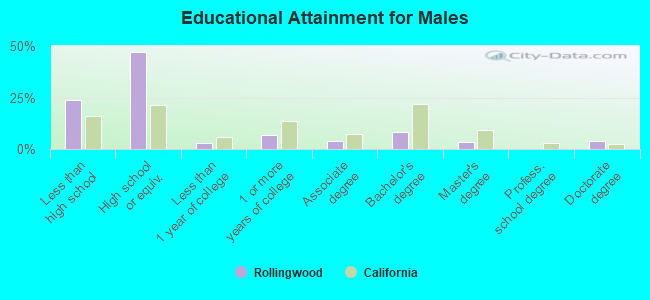
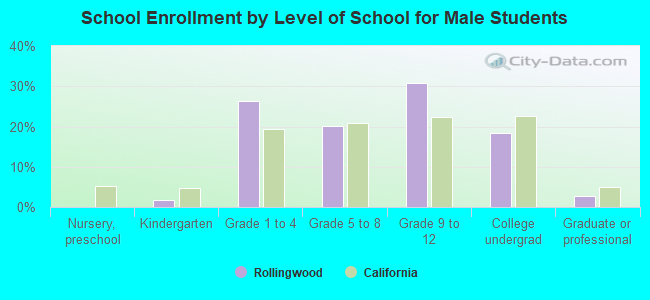
Education attainment for males 25 years and older:
No schooling: 61
Nursery to 4th grade: 19
5th and 6th grade: 88
7th and 8th grade: 33
9th grade: 39
10th grade: 0
11th grade: 31
12th grade, no diploma: 6
High school graduate (or equivalency): 549
Less than 1 year of college: 36
Some college more than 1 year, no degree: 79
Associate degree: 48
Bachelor's degree: 96
Master's degree: 38
Professional school degree: 0
Doctorate degree: 43
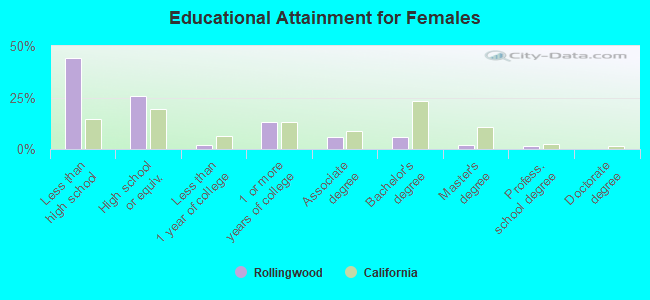
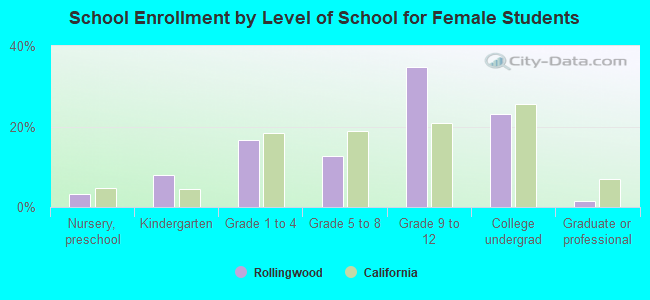
Education attainment for females 25 years and older:
No schooling: 45
Nursery to 4th grade: 0
5th and 6th grade: 92
7th and 8th grade: 19
9th grade: 31
10th grade: 0
11th grade: 35
12th grade, no diploma: 229
High school graduate (or equivalency): 264
Less than 1 year of college: 22
Some college more than 1 year, no degree: 132
Associate degree: 58
Bachelor's degree: 60
Master's degree: 21
Professional school degree: 13
Doctorate degree: 0
Housing units in structures:
One, detached: 765
One, attached: 45
20 to 49: 62
Housing units lacking complete plumbing facilities in 2022: 2.8%
Housing units lacking complete kitchen facilities in 2022: 2.4%
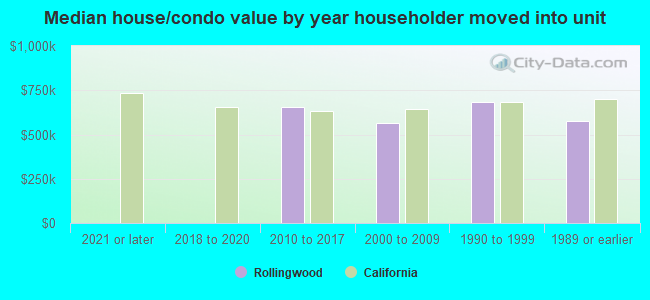
House/condo owner moved in on average 16 years ago