Housing density: 1,346 houses/condos per square mile
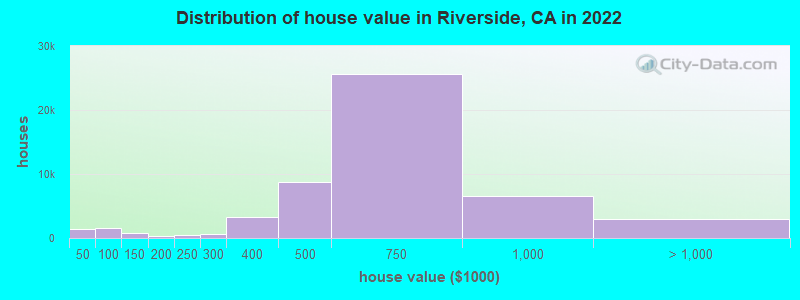
Median price asked for vacant for-sale houses and condos in 2022: $601,182.
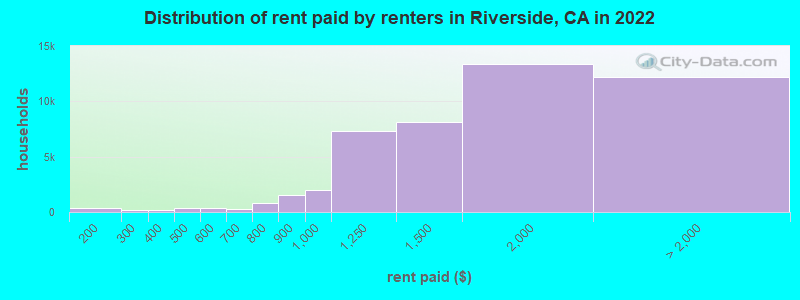
Median contract rent in 2022: $1,552 (lower quartile is $1,182, upper quartile is $1,984)
Median rent asked for vacant for-rent units in 2022: $1,853
Median gross rent in Riverside, CA in 2022: $1,747
Housing units in Riverside with a mortgage: 36,617 (2,207 second mortgage, 0 home equity loan, 1,782 both second mortgage and home equity loan) Houses without a mortgage: 429
Median household income for houses/condos with a mortgage: $122,396
Median household income for apartments without a mortgage: $82,535
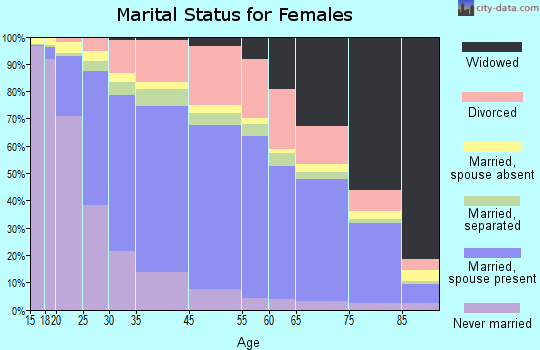
38,113 married couples with children.
20,966 single-parent households (7,039 men, 13,927 women).
55.8% of residents of Riverside speak English at home.
35.3% of residents speak Spanish at home (65% speak English very well, 14% speak English well, 13% speak English not well, 8% don't speak English at all).
2.8% of residents speak other Indo-European language at home (80% speak English very well, 12% speak English well, 5% speak English not well, 3% don't speak English at all).
4.4% of residents speak Asian or Pacific Island language at home (53% speak English very well, 32% speak English well, 13% speak English not well, 2% don't speak English at all).
1.7% of residents speak other language at home (60% speak English very well, 24% speak English well, 9% speak English not well, 6% don't speak English at all).
Foreign born population: 68,829 (21.5%)
(54.6% of them are naturalized citizens)
Percentage of workers working in this county: 72.2% Number of people working at home: 15,984 (10.3% of all workers)
Travel time to work (commute)
Less than 5 minutes: 1,474
5 to 9 minutes: 10,721
10 to 14 minutes: 16,323
15 to 19 minutes: 18,666
20 to 24 minutes: 23,729
25 to 29 minutes: 6,369
30 to 34 minutes: 20,378
35 to 39 minutes: 4,227
40 to 44 minutes: 5,641
45 to 59 minutes: 12,978
60 to 89 minutes: 14,126
90 or more minutes: 4,864
Means of transportation to work:
Drove a car alone: 133,197 (76.0%)
Carpooled: 17,871 (10.2%)
Bus: 1,428 (0.8%)
Long-distance train or commuter rail: 48 (0.0%)
Taxi: 2,432 (1.4%)
Bicycle: 1,624 (0.9%)
Walked: 2,717 (1.5%)
Worked at home: 15,984 (9.1%)
Unemployment by race in 2022
Unemployment rate for White non-Hispanic residents
4.5%Males
5.1%Females
Unemployment rate for Black residents
10.1%Males
6.2%Females
Unemployment rate for American Indian and Alaska Native residents
4.6%Males
12.5%Females
Unemployment rate for Asian residents
6.4%Males
3.6%Females
Unemployment rate for other race residents
3.4%Males
7.5%Females
Unemployment rate for two or more race residents
2.2%Males
1.2%Females
Unemployment rate for Hispanic or Latino residents
3.8%Males
6.0%Females
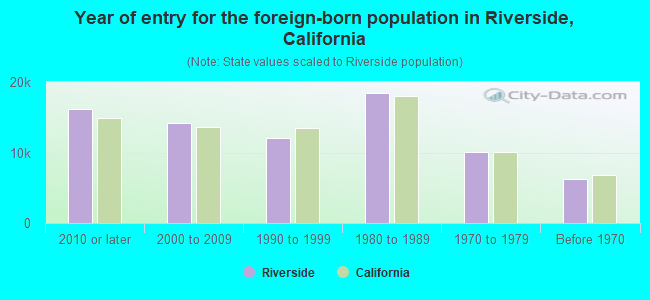
Year of entry for the foreign-born population in Riverside, California
16,1922010 or later
14,1282000 to 2009
12,0421990 to 1999
18,4481980 to 1989
10,0101970 to 1979
6,220Before 1970
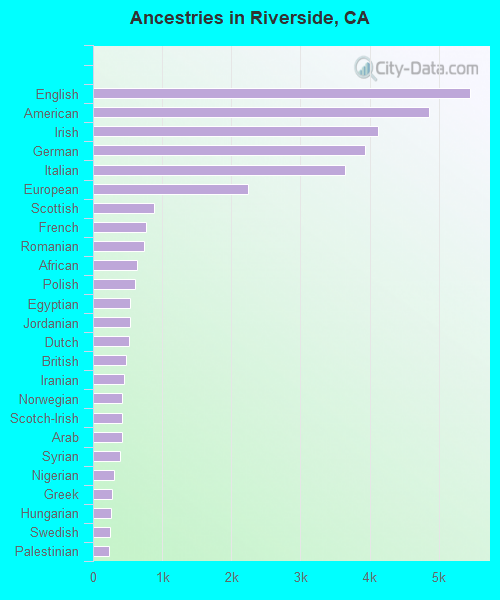
First ancestries reported:
English: 5,454 (2.6%)
American: 4,852 (2.3%)
Irish: 4,119 (1.9%)
German: 3,934 (1.9%)
Italian: 3,638 (1.7%)
European: 2,243 (1.1%)
Scottish: 887 (0.4%)
French: 766 (0.4%)
Romanian: 738 (0.3%)
African: 631 (0.3%)
Polish: 613 (0.3%)
Egyptian: 531 (0.3%)
Jordanian: 530 (0.2%)
Dutch: 519 (0.2%)
British: 483 (0.2%)
Iranian: 444 (0.2%)
Norwegian: 417 (0.2%)
Scotch-Irish: 415 (0.2%)
Arab: 414 (0.2%)
Syrian: 385 (0.2%)
Nigerian: 305 (0.1%)
Greek: 276 (0.1%)
Hungarian: 263 (0.1%)
Swedish: 246 (0.1%)
Palestinian: 231 (0.1%)
Canadian: 225 (0.1%)
Russian: 208 (0.10%)
Eastern European: 204 (0.10%)
Belgian: 195 (0.09%)
Turkish: 184 (0.09%)
Danish: 172 (0.08%)
Czech: 170 (0.08%)
Yugoslavian: 167 (0.08%)
Lebanese: 162 (0.08%)
French Canadian: 162 (0.08%)
Ethiopian: 159 (0.07%)
Brazilian: 157 (0.07%)
Scandinavian: 146 (0.07%)
Croatian: 124 (0.06%)
Jamaican: 123 (0.06%)
Ukrainian: 117 (0.06%)
Portuguese: 109 (0.05%)
Welsh: 108 (0.05%)
Austrian: 81 (0.04%)
Serbian: 81 (0.04%)
Sudanese: 76 (0.04%)
Iraqi: 71 (0.03%)
Armenian: 63 (0.03%)
Northern European: 50 (0.02%)
South African: 42 (0.02%)
Australian: 37 (0.02%)
West Indian: 37 (0.02%)
Belizean: 35 (0.02%)
Bulgarian: 34 (0.02%)
Zimbabwean: 31 (0.01%)
Czechoslovakian: 30 (0.01%)
Lithuanian: 28 (0.01%)
Latvian: 26 (0.01%)
Celtic: 25 (0.01%)
Basque: 24 (0.01%)
Afghan: 22 (0.01%)
Swiss: 17 (0.01%)
Pennsylvania German: 15 (0.01%)
Ghanaian: 12 (0.01%)
Most common places of birth for foreign-born residents (%):
Mexico
Riverside:
52.5% (38,123)
California:
37.2% (3,881,193)
Guatemala
Riverside:
5.0% (3,599)
California:
2.8% (290,436)
Philippines
Riverside:
4.5% (3,288)
California:
7.8% (818,297)
China, excluding Hong Kong and Taiwan
Riverside:
3.6% (2,604)
California:
6.6% (684,672)
India
Riverside:
3.5% (2,514)
California:
5.2% (539,184)
El Salvador
Riverside:
3.4% (2,457)
California:
4.2% (440,287)
Vietnam
Riverside:
2.9% (2,131)
California:
4.9% (512,335)
Korea
Riverside:
2.2% (1,583)
California:
3.0% (315,248)
Colombia
Riverside:
1.8% (1,290)
California:
0.5% (55,249)
Place of birth for U.S.-born residents:
This state: 214,354
Other state: 32,763
Northeast: 6,385
Midwest: 9,466
South: 8,894
West: 8,018
88.4% of Riverside residents lived in the same house 1 years ago. Out of people who lived in different houses, 33.5% lived in this county. Out of people who lived in different counties, 92.6% lived in California.
Riverside:
88.4%
State average:
88.9%
Education attainment for males 25 years and older:
No schooling: 4,193
Nursery to 4th grade: 853
5th and 6th grade: 2,581
7th and 8th grade: 785
9th grade: 1,419
10th grade: 1,606
11th grade: 1,258
12th grade, no diploma: 2,695
High school graduate (or equivalency): 30,944
Less than 1 year of college: 7,315
Some college more than 1 year, no degree: 15,683
Associate degree: 7,093
Bachelor's degree: 14,995
Master's degree: 5,390
Professional school degree: 1,487
Doctorate degree: 2,348
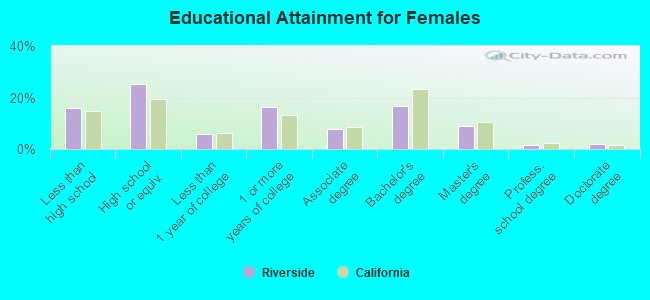
Education attainment for females 25 years and older:
No schooling: 3,586
Nursery to 4th grade: 1,985
5th and 6th grade: 1,778
7th and 8th grade: 1,327
9th grade: 1,676
10th grade: 1,513
11th grade: 2,175
12th grade, no diploma: 2,969
High school graduate (or equivalency): 26,752
Less than 1 year of college: 6,312
Some college more than 1 year, no degree: 17,223
Associate degree: 8,353
Bachelor's degree: 17,903
Master's degree: 9,418
Professional school degree: 1,573
Doctorate degree: 2,152
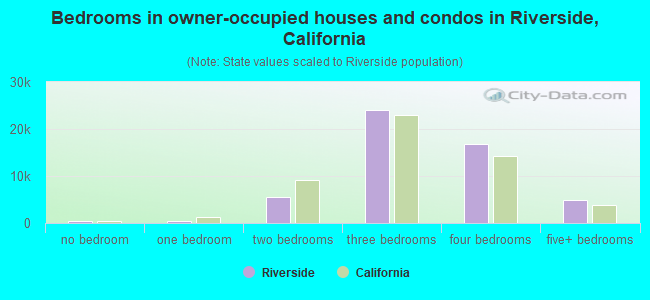
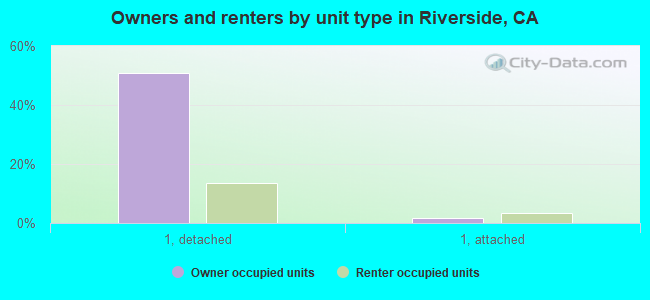
Housing units in structures:
One, detached: 64,128
One, attached: 5,372
Two: 1,544
3 or 4: 5,456
5 to 9: 5,203
10 to 19: 6,223
20 to 49: 6,200
50 or more: 8,374
Mobile homes: 2,645
Median worth of mobile homes: $125,400
Housing units lacking complete plumbing facilities in 2022: 0.0%
Housing units lacking complete kitchen facilities in 2022: 2.5%
House/condo owner moved in on average 12 years ago