Richmond Heights, FL (Florida) Houses and Residents
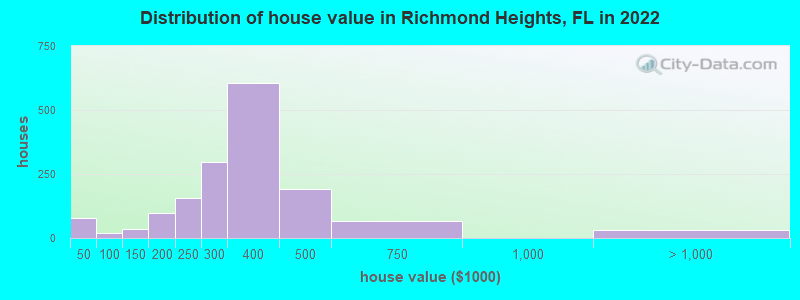
Estimated median house or condo value in 2022: $343,430 (it was $83,600 in 2000 )
Richmond Heights:
$343,430Florida:
$354,100
Lower value quartile - upper value quartile: $282,103 - $439,079Mean price in 2022: Detached houses: $377,429 Here:
$377,429State:
$500,941
Townhouses or other attached units: $315,080 Here:
$315,080State:
$370,869
Total population: 8,541 (Urban population: 8,432, Rural population: 0)
Houses: 2,988 (2,818 occupied: 2,002 owner occupied, 852 renter occupied )
% of renters here:
30%State:
33%
Housing density: 1,806 houses/condos per square mile
Median price asked for vacant for-sale houses and condos in 2022: $369,402.
Median contract rent in 2022: $1,424 (lower quartile is $1,236, upper quartile is $1,594)
Median gross rent in Richmond Heights, FL in 2022: $1,640
Housing units in Richmond Heights with a mortgage: 1,155 (76 second mortgage, 0 home equity loan, 48 both second mortgage and home equity loan )Houses without a mortgage: 0
Median household income for houses/condos with a mortgage: $90,708
Median household income for apartments without a mortgage: $59,476
Median monthly housing costs: $1,447
Data:
Median house or condo value ($)
Median house or condo value ($ change since 2000)
Median house or condo value ($) - White
Median house or condo value ($) - Black or African American
Median house or condo value ($) - Asian
Median house or condo value ($) - Hispanic or Latino
Median house or condo value ($) - American Indian and Alaska Native
Median house or condo value ($) - Multirace
Median house or condo value ($) - Other Race
Median price asked for mobile homes ($)
Household density (households per square mile)
Mean house or condo value by units in structure - 1, detached ($)
Mean house or condo value by units in structure - 1, attached ($)
Mean house or condo value by units in structure - 2 ($)
Mean house or condo value by units in structure by units in structure - 3 or 4 ($)
Mean house or condo value by units in structure - 5 or more ($)
Mean house or condo value by units in structure - Boat, RV, van, etc. ($)
Mean house or condo value by units in structure - Mobile home ($)
Median contract rent ($)
Median contract rent - Lower quartile ($)
Median contract rent - Upper quartile ($)
Median gross rent ($)
Urban houses (%)
Rural houses (%)
Houses occupied (%)
Houses occupied (% change since 2000)
Houses owner occupied (%)
Houses owner occupied (% change since 2000)
Houses renter occupied (%)
Houses renter occupied (% change since 2000)
Vacant housing units - For rent (%)
Vacant housing units - For rent (% change since 2000)
Vacant housing units - For sale only (%)
Vacant housing units - For sale only (% change since 2000)
Vacant housing units - Rented or sold, not occupied (%)
Vacant housing units - Rented or sold, not occupied (% change since 2000)
Vacant housing units - For seasonal, recreational, or occasional use (%)
Vacant housing units - For seasonal, recreational, or occasional use (% change since 2000)
Vacant housing units - For migrant workers (%)
Vacant housing units - For migrant workers (% change since 2000)
Vacant housing units - Other vacant (%)
Vacant housing units - Other vacant (% change since 2000)
Median monthly housing costs ($)
Median household income for houses/condos with a mortgage ($)
Median household income for houses/condos without a mortgage ($)
Median household income ($)
Median household income ($) - White
Median household income ($) - Black or African American
Median household income ($) - Asian
Median household income ($) - Hispanic or Latino
Median household income ($) - American Indian and Alaska Native
Median household income ($) - Multirace
Median household income ($) - Other Race
Mortgage status - with mortgage (%)
Mortgage status - with second mortgage (%)
Mortgage status - with home equity loan (%)
Mortgage status - with both second mortgage and home equity loan (%)
Mortgage status - without a mortgage (%)
Median year house/condo built
Median year apartment built
Household type by relationship - Male householder living alone (%)
Household type by relationship - Male householder not living alone (%)
Household type by relationship - Female householder living alone (%)
Household type by relationship - Female householder not living alone (%)
Household type by relationship - Opposite-Sex spouse (%)
Household type by relationship - Same-Sex spouse (%)
Household type by relationship - Opposite-Sex unmarried partner (%)
Household type by relationship - Same-Sex unmarried partner (%)
Household type by relationship - In group quarters (%)
Size of family households - 2-person household (%)
Size of family households - 3-person household (%)
Size of family households - 4-person household (%)
Size of family households - 5-person household (%)
Size of family households - 6-person household (%)
Size of family households - 7-or-more-person household (%)
Size of nonfamily households - 1-person household (%)
Size of nonfamily households - 2-person household (%)
Size of nonfamily households - 3-person household (%)
Size of nonfamily households - 4-person household (%)
Size of nonfamily households - 5-person household (%)
Size of nonfamily households - 6-person household (%)
Size of nonfamily households - 7-or-moreperson household (%)
Year house built - Built 2010 or later (%)
Year house built - Built 2000 to 2009 (%)
Year house built - Built 1990 to 1999 (%)
Year house built - Built 1980 to 1989 (%)
Year house built - Built 1970 to 1979 (%)
Year house built - Built 1960 to 1969 (%)
Year house built - Built 1950 to 1959 (%)
Year house built - Built 1940 to 1949 (%)
Year house built - Built 1939 or earlier (%)
Median number of rooms in houses and condos
Median number of rooms in apartments
Median number of bedrooms in owner occupied houses
Mean number of bedrooms in owner occupied houses
Median number of bedrooms in renter occupied houses
Mean number of bedrooms in renter occupied houses
Median number of vehichles in owner occupied houses
Mean number of vehichles in owner occupied houses
Median number of vehichles in renter occupied houses
Mean number of vehichles in renter occupied houses
Rooms in owner-occupied houses - 1 room (%)
Rooms in owner-occupied houses - 2 rooms (%)
Rooms in owner-occupied houses - 3 rooms (%)
Rooms in owner-occupied houses - 4 rooms (%)
Rooms in owner-occupied houses - 5 rooms (%)
Rooms in owner-occupied houses - 6 rooms (%)
Rooms in owner-occupied houses - 7 rooms (%)
Rooms in owner-occupied houses - 8 rooms (%)
Rooms in owner-occupied houses - 9+ rooms (%)
Rooms in renter-occupied houses - 1 room (%)
Rooms in renter-occupied houses - 2 rooms (%)
Rooms in renter-occupied houses - 3 rooms (%)
Rooms in renter-occupied houses - 4 rooms (%)
Rooms in renter-occupied houses - 5 rooms (%)
Rooms in renter-occupied houses - 6 rooms (%)
Rooms in renter-occupied houses - 7 rooms (%)
Rooms in renter-occupied houses - 8 rooms (%)
Rooms in renter-occupied houses - 9+ rooms (%)
Bedrooms in owner-occupied houses - no bedrooms (%)
Bedrooms in owner-occupied houses - 1 bedroom (%)
Bedrooms in owner-occupied houses - 2 bedrooms (%)
Bedrooms in owner-occupied houses - 3 bedrooms (%)
Bedrooms in owner-occupied houses - 4 bedrooms (%)
Bedrooms in owner-occupied houses - 5+ bedrooms (%)
Bedrooms in renter-occupied houses - no bedrooms (%)
Bedrooms in renter-occupied houses - 1 bedroom (%)
Bedrooms in renter-occupied houses - 2 bedrooms (%)
Bedrooms in renter-occupied houses - 3 bedrooms (%)
Bedrooms in renter-occupied houses - 4 bedrooms (%)
Bedrooms in renter-occupied houses - 5+ bedrooms (%)
Vehicles available in owner-occupied houses - no vehicle available (%)
Vehicles available in owner-occupied houses - 1 vehicle available(%)
Vehicles available in owner-occupied houses - 2 Vehicles available (%)
Vehicles available in owner-occupied houses - 3 Vehicles available (%)
Vehicles available in owner-occupied houses - 4 Vehicles available (%)
Vehicles available in owner-occupied houses - 5+ Vehicles available (%)
Vehicles available in renter-occupied houses - no vehicle available (%)
Vehicles available in renter-occupied houses - 1 vehicle available (%)
Vehicles available in renter-occupied houses - 2 Vehicles available (%)
Vehicles available in renter-occupied houses - 3 Vehicles available (%)
Vehicles available in renter-occupied houses - 4 Vehicles available (%)
Vehicles available in renter-occupied houses - 5+ Vehicles available (%)
Housing units in structures - 1, detached (%)
Housing units in structures - 1, attached (%)
Housing units in structures - 2 (%)
Housing units in structures - 3 or 4 (%)
Housing units in structures - 5 to 9 (%)
Housing units in structures - 10 to 19 (%)
Housing units in structures - 20 to 49 (%)
Housing units in structures - 50 or more (%)
Housing units in structures - Mobile home (%)
Housing units in structures - Boat, RV, van, etc. (%)
Housing units in structures - Owners - 1, detached (%)
Housing units in structures - Owners - 1, attached (%)
Housing units in structures - Owners - 2 (%)
Housing units in structures - Owners - 3 or 4 (%)
Housing units in structures - Owners - 5 to 9 (%)
Housing units in structures - Owners - 10 to 19 (%)
Housing units in structures - Owners - 20 to 49 (%)
Housing units in structures - Owners - 50 or more (%)
Housing units in structures - Owners - Mobile home (%)
Housing units in structures - Owners - Boat, RV, van, etc. (%)
Housing units in structures - Renters - 1, detached (%)
Housing units in structures - Renters - 1, attached (%)
Housing units in structures - Renters - 2 (%)
Housing units in structures - Renters - 3 or 4 (%)
Housing units in structures - Renters - 5 to 9 (%)
Housing units in structures - Renters - 10 to 19 (%)
Housing units in structures - Renters - 20 to 49 (%)
Housing units in structures - Renters - 50 or more (%)
Housing units in structures - Renters - Mobile home (%)
Housing units in structures - Renters - Boat, RV, van, etc. (%)
House/condo owner moved in on average (years ago)
Renter moved in on average (years ago)
Year householder moved into unit - Moved in 1999 to March 2000 (%)
Year householder moved into unit - Moved in 1999 to March 2000 (%) - White
Year householder moved into unit - Moved in 1999 to March 2000 (%) - Black or African American
Year householder moved into unit - Moved in 1999 to March 2000 (%) - Asian
Year householder moved into unit - Moved in 1999 to March 2000 (%) - Hispanic or Latino
Year householder moved into unit - Moved in 1999 to March 2000 (%) - American Indian and Alaska Native
Year householder moved into unit - Moved in 1999 to March 2000 (%) - Multirace
Year householder moved into unit - Moved in 1999 to March 2000 (%) - Other Race
Year householder moved into unit - Moved in 1995 to 1998 (%)
Year householder moved into unit - Moved in 1995 to 1998 (%) - White
Year householder moved into unit - Moved in 1995 to 1998 (%) - Black or African American
Year householder moved into unit - Moved in 1995 to 1998 (%) - Asian
Year householder moved into unit - Moved in 1995 to 1998 (%) - Hispanic or Latino
Year householder moved into unit - Moved in 1995 to 1998 (%) - American Indian and Alaska Native
Year householder moved into unit - Moved in 1995 to 1998 (%) - Multirace
Year householder moved into unit - Moved in 1995 to 1998 (%) - Other Race
Year householder moved into unit - Moved in 1990 to 1994 (%)
Year householder moved into unit - Moved in 1990 to 1994 (%) - White
Year householder moved into unit - Moved in 1990 to 1994 (%) - Black or African American
Year householder moved into unit - Moved in 1990 to 1994 (%) - Asian
Year householder moved into unit - Moved in 1990 to 1994 (%) - Hispanic or Latino
Year householder moved into unit - Moved in 1990 to 1994 (%) - American Indian and Alaska Native
Year householder moved into unit - Moved in 1990 to 1994 (%) - Multirace
Year householder moved into unit - Moved in 1990 to 1994 (%) - Other Race
Year householder moved into unit - Moved in 1980 to 1989 (%)
Year householder moved into unit - Moved in 1980 to 1989 (%) - White
Year householder moved into unit - Moved in 1980 to 1989 (%) - Black or African American
Year householder moved into unit - Moved in 1980 to 1989 (%) - Asian
Year householder moved into unit - Moved in 1980 to 1989 (%) - Hispanic or Latino
Year householder moved into unit - Moved in 1980 to 1989 (%) - American Indian and Alaska Native
Year householder moved into unit - Moved in 1980 to 1989 (%) - Multirace
Year householder moved into unit - Moved in 1980 to 1989 (%) - Other Race
Year householder moved into unit - Moved in 1970 to 1979 (%)
Year householder moved into unit - Moved in 1970 to 1979 (%) - White
Year householder moved into unit - Moved in 1970 to 1979 (%) - Black or African American
Year householder moved into unit - Moved in 1970 to 1979 (%) - Asian
Year householder moved into unit - Moved in 1970 to 1979 (%) - Hispanic or Latino
Year householder moved into unit - Moved in 1970 to 1979 (%) - American Indian and Alaska Native
Year householder moved into unit - Moved in 1970 to 1979 (%) - Multirace
Year householder moved into unit - Moved in 1970 to 1979 (%) - Other Race
Year householder moved into unit - Moved in 1969 or earlier (%)
Year householder moved into unit - Moved in 1969 or earlier (%) - White
Year householder moved into unit - Moved in 1969 or earlier (%) - Black or African American
Year householder moved into unit - Moved in 1969 or earlier (%) - Asian
Year householder moved into unit - Moved in 1969 or earlier (%) - Hispanic or Latino
Year householder moved into unit - Moved in 1969 or earlier (%) - American Indian and Alaska Native
Year householder moved into unit - Moved in 1969 or earlier (%) - Multirace
Year householder moved into unit - Moved in 1969 or earlier (%) - Other Race
Housing units lacking complete plumbing facilities (%)
Housing units lacking complete kitchen facilities (%)
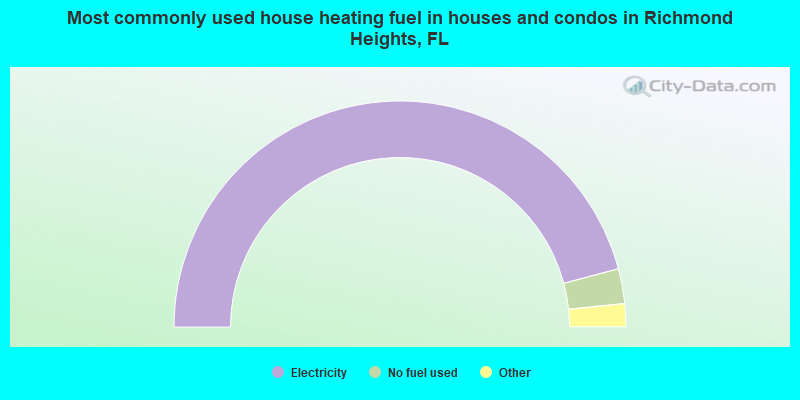
House heating fuel used in houses and condos - Utility gas (%)
House heating fuel used in houses and condos - Bottled, tank, or LP gas (%)
House heating fuel used in houses and condos - Electricity (%)
House heating fuel used in houses and condos - Fuel oil, kerosene, etc. (%)
House heating fuel used in houses and condos - Coal or coke (%)
House heating fuel used in houses and condos - Wood (%)
House heating fuel used in houses and condos - Solar energy (%)
House heating fuel used in houses and condos - Other fuel (%)
House heating fuel used in houses and condos - No fuel used (%)
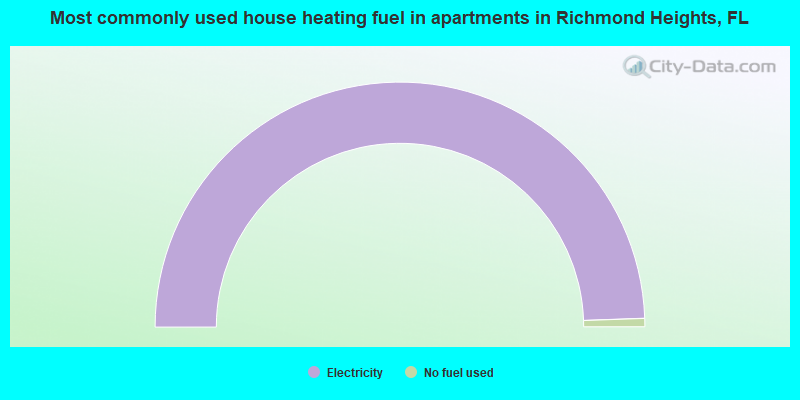
House heating fuel used in apartments - Utility gas (%)
House heating fuel used in apartments - Bottled, tank, or LP gas (%)
House heating fuel used in apartments - Electricity (%)
House heating fuel used in apartments - Fuel oil, kerosene, etc. (%)
House heating fuel used in apartments - Coal or coke (%)
House heating fuel used in apartments - Wood (%)
House heating fuel used in apartments - Solar energy (%)
House heating fuel used in apartments - Other fuel (%)
House heating fuel used in apartments - No fuel used (%)
Median year house/condo built: 1968Median year apartment built: 1980Household type by relationship:
Households: 9,810
Male householders: 1,277 (113 living alone ), Female householders: 1,474 (330 living alone )1,210 spouses (1,210 opposite-sex spouses ), 289 unmarried partners , (277 opposite-sex unmarried partners ), 2,937 children (2,881 natural , 6 adopted , 48 stepchildren ), 661 grandchildren , 340 brothers or sisters , 450 parents , 0 foster children , 614 other relatives , 340 non-relatives In group quarters: 214
Size of family households: 433 2-persons , 571 3-persons , 633 4-persons , 188 5-persons , 252 6-persons , 100 7-or-more-persons .
Size of nonfamily households: 475 1-person , 95 2-persons , 121 3-persons .
894 married couples with children. single-parent households (94 men , 415 women ).
54.6% of residents of Richmond Heights speak English at home. of residents speak Spanish at home (42% speak English very well , 23% speak English well , 17% speak English not well , 18% don't speak English at all ).of residents speak other Indo-European language at home (62% speak English very well , 32% speak English well , 6% speak English not well ).of residents speak Asian or Pacific Island language at home (100% speak English very well ).of residents speak other language at home (18% speak English very well , 82% speak English well ).
Foreign born population: 3,618 (36.9%)of them are naturalized citizens )
Median number of rooms in houses and condos:
Median number of rooms in apartments
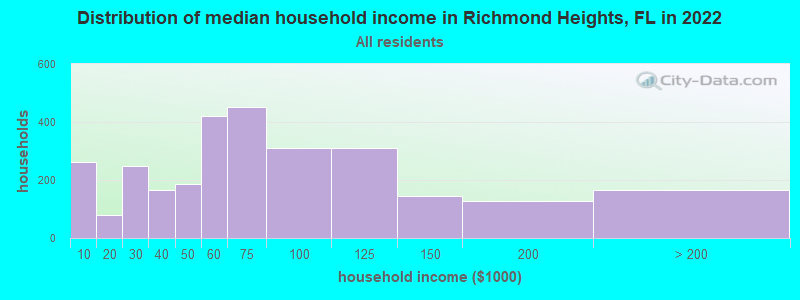
Richmond Heights, FL household income distribution 261 Less than $10,00078 $10,000 to $19,999250 $20,000 to $29,999165 $30,000 to $39,999186 $40,000 to $49,999421 $50,000 to $59,999451 $60,000 to $74,999309 $75,000 to $99,999310 $100,000 to $124,999145 $125,000 to $149,999129 $150,000 to $199,999167 $200,000 or more
Home value of owner - occupied houses in 2022 in Richmond Heights, FL 57 Less than $10,0005 $20,000 to $24,99916 $25,000 to $29,99917 $60,000 to $69,9993 $90,000 to $99,99936 $125,000 to $149,99979 $150,000 to $174,99919 $175,000 to $199,999157 $200,000 to $249,999294 $250,000 to $299,999604 $300,000 to $399,999192 $400,000 to $499,99966 $500,000 to $749,99929 $1,000,000 to $1,499,999Rent paid by renters in 2022 in Richmond Heights, FL 14 $900 to $999194 $1,000 to $1,249268 $1,250 to $1,499188 $1,500 to $1,999165 No cash rent
Percentage of workers working in this county: 98.8%Number of people working at home: 247 (5.5% of all workers )
Travel time to work (commute)
Less than 5 minutes: 05 to 9 minutes: 22410 to 14 minutes: 15815 to 19 minutes: 31520 to 24 minutes: 50725 to 29 minutes: 31130 to 34 minutes: 93635 to 39 minutes: 16640 to 44 minutes: 26445 to 59 minutes: 35560 to 89 minutes: 70290 or more minutes: 73
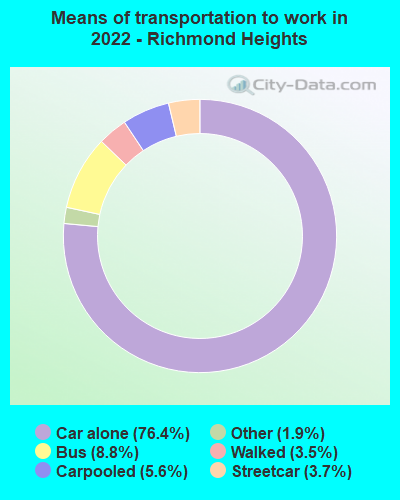
Means of transportation to work:
Drove a car alone: 721 (65.3%)Carpooled: 50 (4.5%)Bus or trolley bus : 63 (5.7%)Streetcar or trolley car : 20 (1.8%)Taxi: 21 (1.9%)Walked: 31 (2.8%)Worked at home: 226 (20.5%)
Unemployment by race in 2022
Unemployment rate for Black residents 8.9% Males7.0% FemalesUnemployment rate for American Indian and Alaska Native residents 100.0% FemalesUnemployment rate for two or more race residents 3.3% FemalesUnemployment rate for Hispanic or Latino residents 3.8% Females
Year of entry for the foreign-born population in Richmond Heights, Florida
838 2010 or later 889 2000 to 2009 548 1990 to 1999 245 1980 to 1989 266 1970 to 1979 143 Before 1970
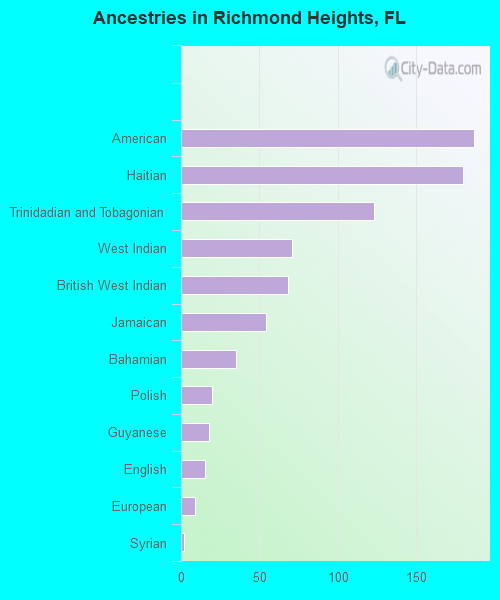
First ancestries reported:
American: 187 (2.9%)
Haitian: 180 (2.8%)
Trinidadian and Tobagonian: 123 (1.9%)
West Indian: 71 (1.1%)
British West Indian: 68 (1.0%)
Jamaican: 54 (0.8%)
Bahamian: 35 (0.5%)
Polish: 20 (0.3%)
Guyanese: 18 (0.3%)
English: 15 (0.2%)
European: 9 (0.1%)
Syrian: 2 (0.03%) Most common places of birth for foreign-born residents (%): Cuba Richmond Heights:
47.0% (1,702)Florida:
22.0% (1,006,576)
Nicaragua Richmond Heights:
9.1% (330)Florida:
2.3% (105,066)
Peru Richmond Heights:
8.7% (316)Florida:
2.1% (96,693)
Dominican Republic Richmond Heights:
8.0% (289)Florida:
3.0% (137,727)
Trinidad and Tobago Richmond Heights:
3.8% (138)Florida:
1.0% (43,642)
Guyana Richmond Heights:
3.3% (118)Florida:
0.7% (33,556)
Haiti Richmond Heights:
3.1% (112)Florida:
7.5% (342,375)
Honduras Richmond Heights:
2.4% (87)Florida:
2.3% (107,160)
Colombia Richmond Heights:
2.3% (83)Florida:
6.5% (298,669)
Mexico Richmond Heights:
1.7% (63)Florida:
5.6% (257,152)
St. Vincent and the Grenadines Richmond Heights:
1.6% (59)Florida:
0.1% (2,578)
Panama Richmond Heights:
1.6% (59)Florida:
0.5% (22,972)
Place of birth for U.S.-born residents:
This state: 5,133Other state: 877Northeast: 278Midwest: 19South: 554West: 0 96.9% of Richmond Heights residents lived in the same house 1 years ago.
Out of people who lived in different houses, 48.9% lived in this county.
Richmond Heights:
96.9%State average:
86.3%
Education attainment for males 25 years and older:
No schooling: 7Nursery to 4th grade: 75th and 6th grade: 337th and 8th grade: 259th grade: 110th grade: 1011th grade: 14012th grade, no diploma: 384High school graduate (or equivalency): 1,299Less than 1 year of college: 99Some college more than 1 year, no degree: 325Associate degree: 248Bachelor's degree: 298Master's degree: 121Professional school degree: 20Doctorate degree: 0
Education attainment for females 25 years and older:
No schooling: 118Nursery to 4th grade: 75th and 6th grade: 947th and 8th grade: 1029th grade: 2110th grade: 011th grade: 1512th grade, no diploma: 315High school graduate (or equivalency): 1,388Less than 1 year of college: 300Some college more than 1 year, no degree: 324Associate degree: 318Bachelor's degree: 659Master's degree: 210Professional school degree: 16Doctorate degree: 32
Housing units in structures:
One, detached: 2,404One, attached: 1885 to 9: 910 to 19: 11220 to 49: 15650 or more: 74Mobile homes: 42House/condo owner moved in on average 15 years ago
Renter moved in on average 5 years ago
Private vs. public school enrollment:
Students in private schools in grades 1 to 8 (elementary and middle school): 81 Students in private schools in grades 9 to 12 (high school): 59 Students in private undergraduate colleges: 100