Richland, MI (Michigan) Houses and Residents
| Richland: | $266,612 |
| Michigan: | $224,400 |
Total population: 774 (Urban population: 411 (all inside urban clusters), Rural population: 151 (all nonfarm))
Houses: 403 (397 occupied: 308 owner occupied, 96 renter occupied)
| % of renters here: | 24% |
| State: | 27% |
Housing density: 336 houses/condos per square mile
Median price asked for vacant for-sale houses and condos in 2022 in this county: $148,399.
Median contract rent in 2022: $963 (lower quartile is $835, upper quartile is $1,660)
Median gross rent in Richland, MI in 2022: $1,072
Housing units in Richland with a mortgage: 158 (29 second mortgage, 0 home equity loan, 27 both second mortgage and home equity loan)
Houses without a mortgage: 2
Median household income for houses/condos with a mortgage: $109,195
Median household income for apartments without a mortgage: $66,193
Median monthly housing costs: $1,015
Compare current foreclosures near Richland, MI:
| Photo | Address | Area | Beds / Baths | Price | Details |
|---|---|---|---|---|---|

|
#1
N 35th St
Richland, MI 49083
|
- sq. feet
|
- baths - beds |
show details | |

|
#2
E D Ave Apt 4
Richland, MI 49083
|
- sq. feet
|
- baths - beds |
show details | |

|
#3
Clark St
Battle Creek, MI 49014
|
1,096 sq. feet
|
1 baths 2 beds |
$161,500
|
show details |

|
#4
Glenwood St
Battle Creek, MI 49017
|
- sq. feet
|
4 baths 7 beds |
$50,400
|
show details |

|
#5
Lyons Ave
Kalamazoo, MI 49048
|
1,560 sq. feet
|
2 baths 3 beds |
$255,000
|
show details |

|
#6
E C Ave
Richland, MI 49083
|
- sq. feet
|
- baths - beds |
show details | |

|
#7
Geiser Grv
Richland, MI 49083
|
- sq. feet
|
- baths - beds |
show details | |

|
#8
Sturtevant Ave
Richland, MI 49083
|
- sq. feet
|
- baths - beds |
show details | |

|
#9
Dearborn Ave
Kalamazoo, MI 49048
|
735 sq. feet
|
1 baths 2 beds |
show details | |

|
#10
Stoney Creek Dr
Augusta, MI 49012
|
1,977 sq. feet
|
2 baths 3 beds |
show details |
| Photo | Address | Area | Beds / Baths | Price | Details |
|---|---|---|---|---|---|

|
#11
Territorial Rd W
Battle Creek, MI 49015
|
1,894 sq. feet
|
1 baths 3 beds |
show details | |

|
#12
C Dr S
Climax, MI 49034
|
1,100 sq. feet
|
1 baths 2 beds |
show details | |

|
#13
Francis St
Kalamazoo, MI 49048
|
1,102 sq. feet
|
1 baths 3 beds |
show details | |

|
#14
Elkerton Ave
Kalamazoo, MI 49048
|
972 sq. feet
|
1 baths 2 beds |
show details | |

|
#15
Oakland Pl
Battle Creek, MI 49015
|
1,152 sq. feet
|
1 baths 3 beds |
show details | |

|
#16
Thorncroft Ave
Battle Creek, MI 49017
|
1,292 sq. feet
|
1 baths 3 beds |
show details | |

|
#17
Review Ave
Battle Creek, MI 49037
|
1,394 sq. feet
|
1 baths 2 beds |
show details | |

|
#18
N La Vista Blvd
Battle Creek, MI 49015
|
1,729 sq. feet
|
1 baths 3 beds |
show details | |

|
#19
Bluegrass St
Portage, MI 49024
|
999 sq. feet
|
1 baths 3 beds |
show details | |

|
#20
Eldred St
Battle Creek, MI 49015
|
1,283 sq. feet
|
1 baths 3 beds |
show details |
| Photo | Address | Area | Beds / Baths | Price | Details |
|---|---|---|---|---|---|

|
#21
River Rd
Otsego, MI 49078
|
1,024 sq. feet
|
1 baths 3 beds |
show details | |

|
#22
Upton Ave
Battle Creek, MI 49037
|
1,632 sq. feet
|
2 baths 4 beds |
show details | |

|
#23
Pinetree Ln
Battle Creek, MI 49017
|
1,025 sq. feet
|
1 baths 3 beds |
show details | |

|
#24
Hamblin Ave W
Battle Creek, MI 49037
|
851 sq. feet
|
1 baths 2 beds |
show details | |

|
#25
116th Ave
Martin, MI 49070
|
1,596 sq. feet
|
2 baths 4 beds |
show details | |

|
#26
E Q Ave
Kalamazoo, MI 49048
|
1,452 sq. feet
|
1 baths 3 beds |
show details | |

|
#27
Avery Ave
Battle Creek, MI 49037
|
1,018 sq. feet
|
1 baths 2 beds |
show details | |

|
#28
W South St
Kalamazoo, MI 49006
|
1,610 sq. feet
|
1 baths 2 beds |
show details | |

|
#29
Byrd Dr
Portage, MI 49002
|
- sq. feet
|
1 baths 3 beds |
show details | |

|
#30
Bronson Ave
Plainwell, MI 49080
|
832 sq. feet
|
1 baths 4 beds |
show details |
| Photo | Address | Area | Beds / Baths | Price | Details |
|---|---|---|---|---|---|

|
#31
N 20th St
Kalamazoo, MI 49004
|
832 sq. feet
|
1 baths 2 beds |
show details | |

|
#32
12th St
Martin, MI 49070
|
1,518 sq. feet
|
2 baths 4 beds |
show details | |

|
#33
Magnolia Ave
Battle Creek, MI 49017
|
1,489 sq. feet
|
1 baths 3 beds |
show details | |

|
#34
Ludington Ave
Portage, MI 49002
|
2,202 sq. feet
|
2 baths 4 beds |
show details | |

|
#35
Brahms Ave
Portage, MI 49024
|
1,040 sq. feet
|
1 baths 3 beds |
show details | |

|
#36
N 42nd St
Augusta, MI 49012
|
1,289 sq. feet
|
1 baths 3 beds |
show details | |

|
#37
Bard Ave
Kalamazoo, MI 49004
|
1,404 sq. feet
|
2 baths 3 beds |
show details | |

|
#38
Academy St
Battle Creek, MI 49014
|
1,008 sq. feet
|
1 baths 3 beds |
show details | |

|
#39
Aspen Dr
Kalamazoo, MI 49006
|
936 sq. feet
|
1 baths 3 beds |
show details | |

|
#40
Parchmount Ave
Kalamazoo, MI 49004
|
1,154 sq. feet
|
1 baths 3 beds |
show details |
| Photo | Address | Area | Beds / Baths | Price | Details |
|---|---|---|---|---|---|

|
#41
Stadium Dr
Kalamazoo, MI 49009
|
576 sq. feet
|
1 baths 2 beds |
show details | |

|
#42
Shagbark Ct
Portage, MI 49024
|
1,787 sq. feet
|
2 baths - beds |
show details | |

|
#43
G Ave
Kalamazoo, MI 49048
|
- sq. feet
|
1 baths 3 beds |
show details | |

|
#44
Saddler Rd
Plainwell, MI 49080
|
1,176 sq. feet
|
2 baths 3 beds |
show details | |

|
#45
Kirkwood Ave
Battle Creek, MI 49037
|
- sq. feet
|
1 baths 3 beds |
show details | |

|
#46
S Burdick St
Kalamazoo, MI 49001
|
- sq. feet
|
- baths - beds |
$27,900
|
show details |

|
#47
5th St
Plainwell, MI 49080
|
1,232 sq. feet
|
1 baths 3 beds |
show details | |

|
#48
Haveman Ct
Kalamazoo, MI 49001
|
- sq. feet
|
1 baths 3 beds |
show details | |

|
#49
Henning St
Kalamazoo, MI 49048
|
- sq. feet
|
1 baths 2 beds |
show details | |

|
Check over 1 million property listings on Foreclosure.com!
|
browse all offers | |||

Latest news about housing in Richland, MI collected exclusively by city-data.com from local newspapers, TV, and radio stations

 | Saginaw, Kalamazoo, Flint ranked by influence (22 replies) |
| Kalamazoo housing? (9 replies) |
| Possible Battle Creek Relocation (5 replies) |
| High-end housing around Kalamazoo (12 replies) |
| school districts and communities in Kalamazoo County (6 replies) |
| Family planning on moving to MI (136 replies) |

Median year apartment built: 1995
Household type by relationship:
Households: 978- Male householders: 167 (17 living alone), Female householders: 226 (92 living alone)
222 spouses (219 opposite-sex spouses), 14 unmarried partners, (12 opposite-sex unmarried partners), 303 children (236 natural, 20 adopted, 45 stepchildren), 16 grandchildren, 3 brothers or sisters, 4 parents, 0 foster children, 8 other relatives, 6 non-relatives
Size of family households: 155 2-persons, 31 3-persons, 29 4-persons, 36 5-persons, 1 6-persons, 9 7-or-more-persons.
Size of nonfamily households: 122 1-person, 24 2-persons.
135 married couples with children.
48 single-parent households (9 men, 39 women).
99.5% of residents of Richland speak English at home.
0.3% of residents speak other Indo-European language at home (67% speak English very well, 33% speak English well).
0.4% of residents speak other language at home (50% speak English very well, 50% speak English not well).
Foreign born population: 18 (1.8%)
(116.7% of them are naturalized citizens)
| Here: | 7.4 |
| State: | 6.5 |
| Here: | 4.5 |
| State: | 4.3 |

- Bedrooms in owner-occupied houses and condos in Richland, Michigan
- 0no bedroom
- 21 bedroom
- 352 bedrooms
- 1633 bedrooms
- 724 bedrooms
- 375+ bedrooms

- Bedrooms in renter-occupied apartments in Richland, Michigan
- 0no bedroom
- 01 bedroom
- 692 bedrooms
- 23 bedrooms
- 264 bedrooms
- 05+ bedrooms

- Cars and other vehicles available in Richland in owner-occupied houses/condos
- 7no vehicle
- 921 vehicle
- 1662 vehicles
- 243 vehicles
- 104 vehicles
- 95+ vehicles

- Cars and other vehicles available in Richland in renter-occupied apartments
- 0no vehicle
- 611 vehicle
- 302 vehicles
- 53 vehicles
- 04 vehicles
- 05+ vehicles

- Rooms in owner-occupied houses in Richland, Michigan
- 01 room
- 02 rooms
- 103 rooms
- 54 rooms
- 475 rooms
- 476 rooms
- 647 rooms
- 498 rooms
- 869+ rooms

- Rooms in renter-occupied apartments in Richland, Michigan
- 01 room
- 02 rooms
- 73 rooms
- 444 rooms
- 65 rooms
- 156 rooms
- 197 rooms
- 28 rooms
- 29+ rooms


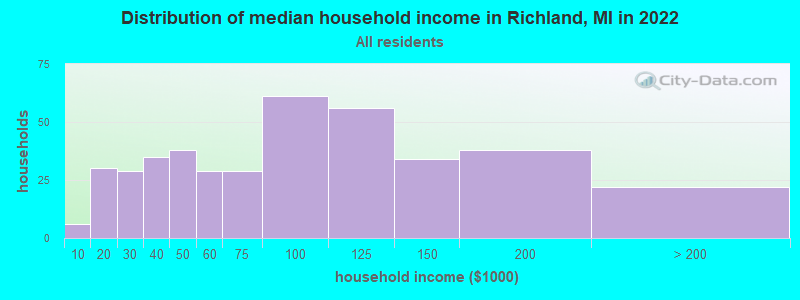
Richland, MI household income distribution

- 6Less than $10,000
- 30$10,000 to $19,999
- 29$20,000 to $29,999
- 35$30,000 to $39,999
- 38$40,000 to $49,999
- 29$50,000 to $59,999
- 29$60,000 to $74,999
- 61$75,000 to $99,999
- 56$100,000 to $124,999
- 34$125,000 to $149,999
- 38$150,000 to $199,999
- 22$200,000 or more
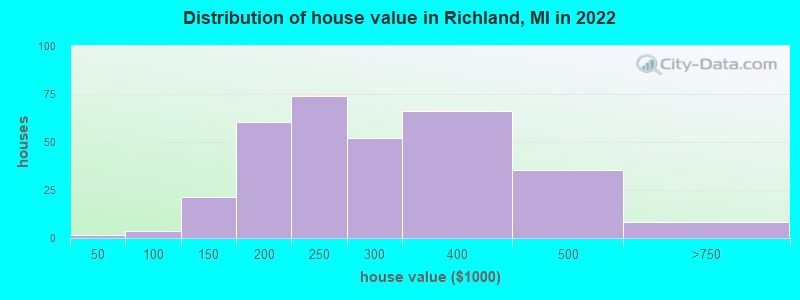
Home value of owner - occupied houses in 2022 in Richland, MI
-
- 1$15,000 to $19,999
- 0$80,000 to $89,999
- 2$90,000 to $99,999
- 5$100,000 to $124,999
- 15$125,000 to $149,999
- 13$150,000 to $174,999
- 46$175,000 to $199,999
- 73$200,000 to $249,999
- 52$250,000 to $299,999
- 66$300,000 to $399,999
- 35$400,000 to $499,999
- 8$500,000 to $749,999
Rent paid by renters in 2022 in Richland, MI
-
- 2$700 to $749
- 17$750 to $799
- 22$800 to $899
- 3$900 to $999
- 10$1,250 to $1,499
- 28$1,500 to $1,999
- 8$2,000 to $2,499


Percentage of workers working in this county: 85.6%
Number of people working at home: 70 (18.4% of all workers)
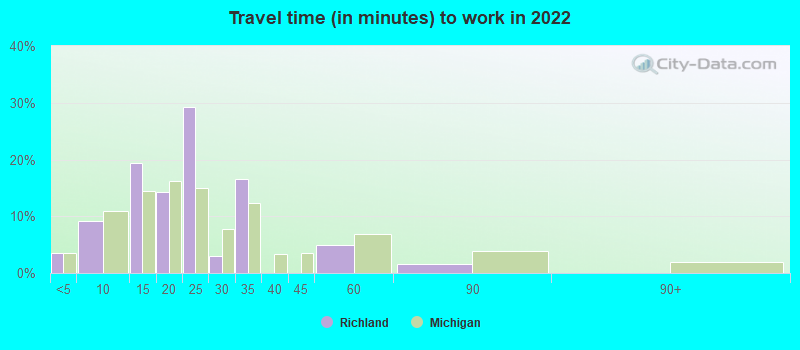
Travel time to work (commute)
- Less than 5 minutes: 21
- 5 to 9 minutes: 30
- 10 to 14 minutes: 31
- 15 to 19 minutes: 49
- 20 to 24 minutes: 55
- 25 to 29 minutes: 14
- 30 to 34 minutes: 47
- 35 to 39 minutes: 2
- 40 to 44 minutes: 18
- 45 to 59 minutes: 28
- 60 to 89 minutes: 11
- 90 or more minutes: 9
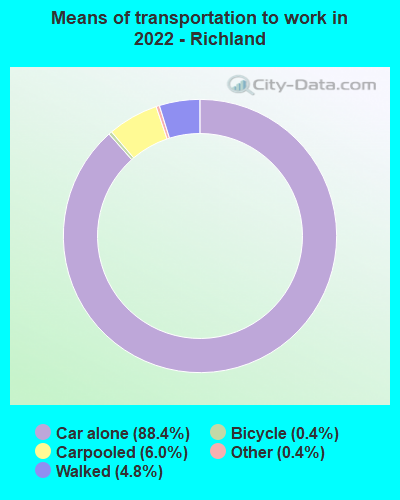
Means of transportation to work:
- Drove a car alone: 615 (79.8%)
- Carpooled: 41 (5.3%)
- Taxi: 5 (0.6%)
- Bicycle: 1 (0.1%)
- Walked: 37 (4.8%)
- Worked at home: 70 (9.1%)

- Unemployment by race in 2022
- Unemployment rate for White non-Hispanic residents
- 1.4%Males
- Unemployment rate for American Indian and Alaska Native residents
- 30.2%Males
- 15.6%Females
- Unemployment rate for Hispanic or Latino residents
- 43.7%Males
- 23.5%Females

- Year of entry for the foreign-born population in Richland, Michigan
- 82010 or later
- 02000 to 2009
- 21990 to 1999
- 01980 to 1989
- 61970 to 1979
- 8Before 1970

First ancestries reported:
- English: 129 (32.6%)
- German: 78 (19.7%)
- Dutch: 46 (11.6%)
- Irish: 40 (10.1%)
- American: 17 (4.3%)
- Italian: 14 (3.5%)
- Polish: 14 (3.5%)
- European: 8 (2.0%)
- Scandinavian: 7 (1.8%)
- Eastern European: 5 (1.3%)
- Danish: 4 (1.0%)
- Scottish: 4 (1.0%)
- Northern European: 3 (0.8%)
- Scotch-Irish: 3 (0.8%)
- Serbian: 3 (0.8%)
- Swedish: 3 (0.8%)
- Swiss: 3 (0.8%)
- British: 2 (0.5%)
- Hungarian: 2 (0.5%)
- French: 1 (0.3%)
- French Canadian: 1 (0.3%)
- Slovak: 1 (0.3%)
Most common places of birth for foreign-born residents (%):
| Richland: | 31.6% (6) |
| Michigan: | 3.1% (21,538) |
| Richland: | 15.8% (3) |
| Michigan: | 4.9% (34,295) |
| Richland: | 10.5% (2) |
| Michigan: | 0.2% (1,144) |
| Richland: | 10.5% (2) |
| Michigan: | 0.5% (3,681) |
| Richland: | 10.5% (2) |
| Michigan: | 2.3% (16,126) |
| Richland: | 10.5% (2) |
| Michigan: | 0.2% (1,346) |
Place of birth for U.S.-born residents:
- This state: 626
- Other state: 347
- Northeast: 58
- Midwest: 137
- South: 129
- West: 29
88.3% of Richland residents lived in the same house 1 years ago.
Out of people who lived in different houses, 35.5% lived in this county.
Out of people who lived in different counties, 24.5% lived in Michigan.
| Richland: | 88.3% |
| State average: | 88.4% |
Education attainment for males 25 years and older:
- No schooling: 0
- Nursery to 4th grade: 0
- 5th and 6th grade: 0
- 7th and 8th grade: 0
- 9th grade: 0
- 10th grade: 2
- 11th grade: 0
- 12th grade, no diploma: 15
- High school graduate (or equivalency): 43
- Less than 1 year of college: 12
- Some college more than 1 year, no degree: 44
- Associate degree: 22
- Bachelor's degree: 86
- Master's degree: 39
- Professional school degree: 0
- Doctorate degree: 5

Education attainment for females 25 years and older:
- No schooling: 0
- Nursery to 4th grade: 0
- 5th and 6th grade: 0
- 7th and 8th grade: 0
- 9th grade: 0
- 10th grade: 0
- 11th grade: 0
- 12th grade, no diploma: 0
- High school graduate (or equivalency): 99
- Less than 1 year of college: 30
- Some college more than 1 year, no degree: 46
- Associate degree: 60
- Bachelor's degree: 106
- Master's degree: 41
- Professional school degree: 10
- Doctorate degree: 12


Housing units in structures:
- One, detached: 283
- One, attached: 49
- Two: 8
- 3 or 4: 42
- 5 to 9: 12
- 50 or more: 8
House/condo owner moved in on average 10 years ago
Renter moved in on average 0 years ago

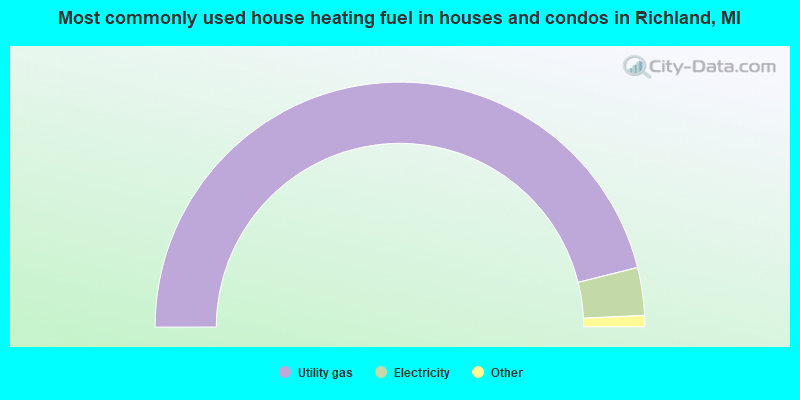
- 92.4%Utility gas
- 6.3%Electricity
- 0.7%Bottled, tank, or LP gas
- 0.7%Fuel oil, kerosene, etc.
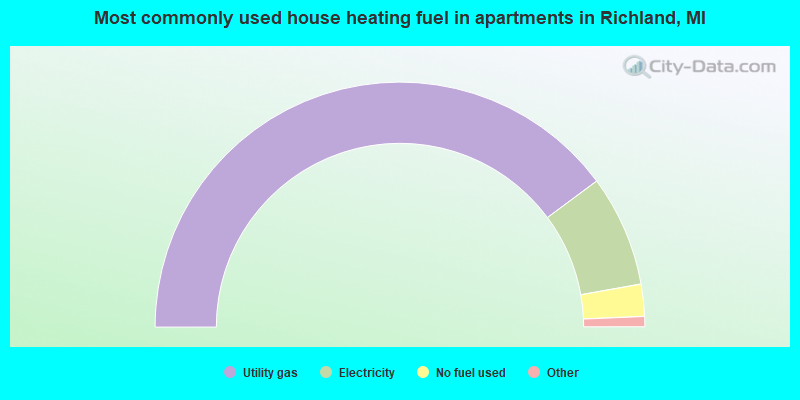
- 80.9%Utility gas
- 14.9%Electricity
- 4.3%No fuel used
Private vs. public school enrollment:
| Here: | 0.0% |
| Michigan: | 12.4% |
| Here: | 0.0% |
| Michigan: | 9.8% |
| Here: | 17.3% |
| Michigan: | 14.9% |


