Richgrove, CA (California) Houses and Residents
| Richgrove: | $198,986 |
| California: | $715,900 |
Mean price in 2022:
Detached houses: $186,601
Here: $186,601 State: $988,808
Total population: 2,882 (Urban population: 2,728 (all inside urban clusters), Rural population: 0)
Houses: 545 (519 occupied: 193 owner occupied, 324 renter occupied)
| % of renters here: | 63% |
| State: | 44% |
Housing density: 1,162 houses/condos per square mile
Median price asked for vacant for-sale houses and condos in 2022 in this county: $413,164.
Median contract rent in 2022: $652 (lower quartile is $505, upper quartile is $849)
Median gross rent in Richgrove, CA in 2022: $864
Housing units in Richgrove with a mortgage: 87 (0 second mortgage, 0 home equity loan, 0 both second mortgage and home equity loan)
Houses without a mortgage: 0
Median household income for houses/condos with a mortgage: $27,068
Median household income for apartments without a mortgage: $50,372
Median monthly housing costs: $799
Compare current foreclosures near Richgrove, CA:
| Photo | Address | Area | Beds / Baths | Price | Details |
|---|---|---|---|---|---|

|
#1
13th Ave
Delano, CA 93215
|
1,324 sq. feet
|
1 baths 2 beds |
show details | |

|
#2
N Mariposa Rd
Earlimart, CA 93219
|
1,232 sq. feet
|
2 baths 4 beds |
show details | |

|
#3
San Marco Ct
Delano, CA 93215
|
2,809 sq. feet
|
3 baths 5 beds |
show details | |

|
#4
Avenue 96
Terra Bella, CA 93270
|
1,480 sq. feet
|
2 baths 3 beds |
show details | |

|
#5
Road 248
Terra Bella, CA 93270
|
1,014 sq. feet
|
1 baths 2 beds |
show details | |

|
#6
Cherrywood St
Mc Farland, CA 93250
|
1,261 sq. feet
|
2 baths 4 beds |
show details | |

|
#7
Cliff Ave
Mc Farland, CA 93250
|
1,040 sq. feet
|
2 baths 3 beds |
show details | |

|
#8
N Cabrillo Way
Delano, CA 93215
|
1,109 sq. feet
|
2 baths 3 beds |
show details | |

|
#9
Franciscan Plz
Delano, CA 93215
|
1,434 sq. feet
|
2 baths 4 beds |
show details | |

|
#10
W 13th Ave
Delano, CA 93215
|
955 sq. feet
|
2 baths 3 beds |
show details |
| Photo | Address | Area | Beds / Baths | Price | Details |
|---|---|---|---|---|---|

|
#11
Catalina Pl
Delano, CA 93215
|
1,434 sq. feet
|
2 baths 4 beds |
show details | |

|
#12
Clinton St
Delano, CA 93215
|
858 sq. feet
|
1 baths 2 beds |
show details | |

|
#13
7th Ave
Delano, CA 93215
|
1,396 sq. feet
|
2 baths 3 beds |
show details | |

|
#14
18th Ave
Delano, CA 93215
|
1,553 sq. feet
|
2 baths 4 beds |
show details | |

|
#15
College Dr
Delano, CA 93215
|
1,202 sq. feet
|
2 baths 4 beds |
show details | |

|
#16
York St
Delano, CA 93215
|
1,382 sq. feet
|
2 baths 4 beds |
show details | |

|
#17
Belmont St Apt 41
Delano, CA 93215
|
- sq. feet
|
- baths - beds |
show details | |

|
#18
Belmont St Apt 67
Delano, CA 93215
|
- sq. feet
|
- baths - beds |
show details | |

|
#19
Chaparral Dr
Delano, CA 93215
|
- sq. feet
|
- baths - beds |
show details | |

|
#20
18th Ave Apt A
Delano, CA 93215
|
- sq. feet
|
- baths - beds |
show details |
| Photo | Address | Area | Beds / Baths | Price | Details |
|---|---|---|---|---|---|

|
#21
Rio Santana Ct
Mc Farland, CA 93250
|
- sq. feet
|
- baths - beds |
show details | |

|
#22
Kensington St
Delano, CA 93215
|
- sq. feet
|
- baths - beds |
show details | |

|
#23
W Sherwood Ave Apt 4
Mc Farland, CA 93250
|
- sq. feet
|
- baths - beds |
show details | |

|
#24
Terra Bella
Terra Bella, CA 93270
|
- sq. feet
|
- baths - beds |
show details | |

|
#25
Avenue 104
Terra Bella, CA 93270
|
- sq. feet
|
- baths - beds |
show details | |

|
#26
N Park Dr Spc 30
Pixley, CA 93256
|
- sq. feet
|
- baths - beds |
show details | |

|
#27
Avenue 112
Pixley, CA 93256
|
- sq. feet
|
- baths - beds |
show details | |

|
Check over 1 million property listings on Foreclosure.com!
|
browse all offers | |||

Latest news about housing in Richgrove, CA collected exclusively by city-data.com from local newspapers, TV, and radio stations

 | 10 most boring places in California (46 replies) |
| Is California's Poverty Worse Than Mississipi? (16 replies) |
| Best city in Central Valley (21 replies) |
| Future growth in the Central Valley (64 replies) |
| Need Help! may relocate, best place to live that is commutable to Delano (32 replies) |
| Nonwhite youth population growing in California and nation, report finds (30 replies) |

Median year apartment built: 1983
Household type by relationship:
Households: 1,852- Male householders: 316 (59 living alone), Female householders: 196 (10 living alone)
235 spouses (235 opposite-sex spouses), 69 unmarried partners, (69 opposite-sex unmarried partners), 673 children (650 natural, 0 adopted, 23 stepchildren), 259 grandchildren, 23 brothers or sisters, 29 parents, 0 foster children, 16 other relatives, 33 non-relatives
Size of family households: 132 2-persons, 43 3-persons, 110 4-persons, 108 5-persons, 10 6-persons, 16 7-or-more-persons.
Size of nonfamily households: 73 1-person, 25 2-persons.
114 married couples with children.
308 single-parent households (27 men, 281 women).
13.8% of residents of Richgrove speak English at home.
85.1% of residents speak Spanish at home (46% speak English very well, 10% speak English well, 24% speak English not well, 19% don't speak English at all).
4.1% of residents speak other language at home (57% speak English very well, 17% speak English well, 26% speak English not well).
Foreign born population: 812 (43.8%)
(22.8% of them are naturalized citizens)
| Here: | 5.3 |
| State: | 6.0 |
| Here: | 4.2 |
| State: | 3.9 |

- Bedrooms in owner-occupied houses and condos in Richgrove, California
- 0no bedroom
- 01 bedroom
- 282 bedrooms
- 1223 bedrooms
- 434 bedrooms
- 05+ bedrooms

- Bedrooms in renter-occupied apartments in Richgrove, California
- 10no bedroom
- 861 bedroom
- 1302 bedrooms
- 583 bedrooms
- 404 bedrooms
- 05+ bedrooms

- Cars and other vehicles available in Richgrove in owner-occupied houses/condos
- 23no vehicle
- 391 vehicle
- 882 vehicles
- 213 vehicles
- 54 vehicles
- 175+ vehicles

- Cars and other vehicles available in Richgrove in renter-occupied apartments
- 21no vehicle
- 1721 vehicle
- 992 vehicles
- 213 vehicles
- 04 vehicles
- 115+ vehicles

- Rooms in owner-occupied houses in Richgrove, California
- 01 room
- 02 rooms
- 03 rooms
- 404 rooms
- 685 rooms
- 856 rooms
- 07 rooms
- 08 rooms
- 09+ rooms

- Rooms in renter-occupied apartments in Richgrove, California
- 101 room
- 322 rooms
- 603 rooms
- 974 rooms
- 785 rooms
- 486 rooms
- 07 rooms
- 08 rooms
- 09+ rooms


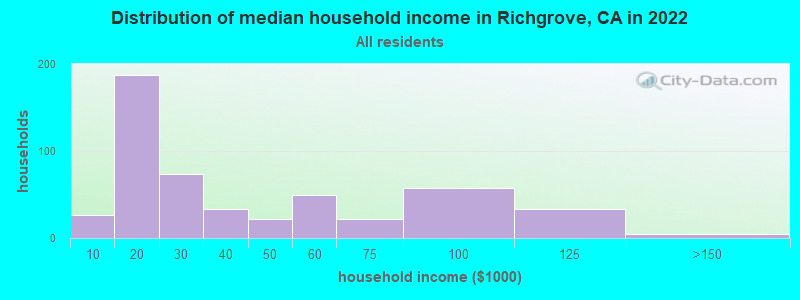
Richgrove, CA household income distribution

- 27Less than $10,000
- 187$10,000 to $19,999
- 73$20,000 to $29,999
- 33$30,000 to $39,999
- 22$40,000 to $49,999
- 50$50,000 to $59,999
- 22$60,000 to $74,999
- 58$75,000 to $99,999
- 33$100,000 to $124,999
- 5$125,000 to $149,999
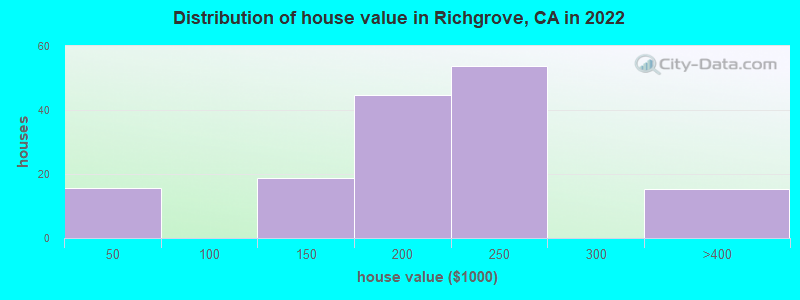
Home value of owner - occupied houses in 2022 in Richgrove, CA
-
- 15$10,000 to $14,999
- 18$100,000 to $124,999
- 35$150,000 to $174,999
- 9$175,000 to $199,999
- 53$200,000 to $249,999
- 15$300,000 to $399,999
Rent paid by renters in 2022 in Richgrove, CA
-
- 27$300 to $349
- 46$350 to $399
- 14$450 to $499
- 17$500 to $549
- 12$550 to $599
- 79$600 to $649
- 21$650 to $699
- 34$700 to $749
- 8$750 to $799
- 24$800 to $899
- 18$900 to $999
- 36$1,000 to $1,249
- 10$1,500 to $1,999


Percentage of workers working in this county: 32.1%
Number of people working at home: 0 (0.0% of all workers)
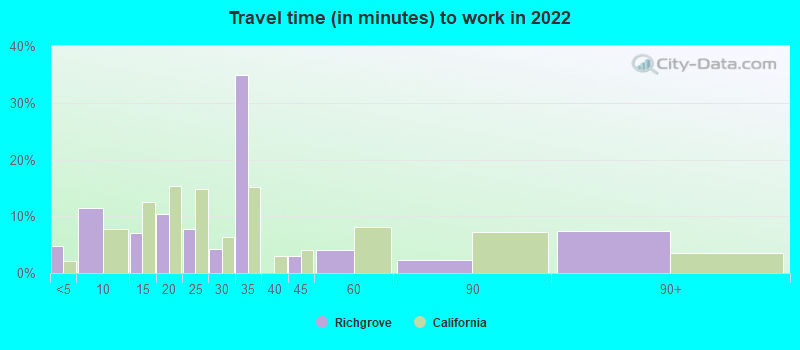
Travel time to work (commute)
- Less than 5 minutes: 15
- 5 to 9 minutes: 40
- 10 to 14 minutes: 59
- 15 to 19 minutes: 166
- 20 to 24 minutes: 43
- 25 to 29 minutes: 55
- 30 to 34 minutes: 133
- 35 to 39 minutes: 12
- 40 to 44 minutes: 29
- 45 to 59 minutes: 51
- 60 to 89 minutes: 25
- 90 or more minutes: 25
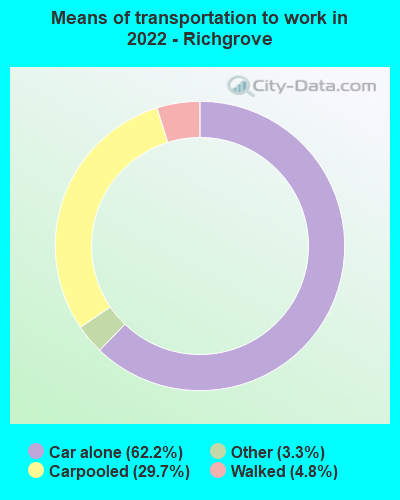
Means of transportation to work:
- Drove a car alone: 406 (56.9%)
- Carpooled: 158 (22.1%)
- Taxi: 23 (3.2%)
- Walked: 27 (3.8%)
- Worked at home: 76 (10.6%)

- Unemployment by race in 2022
- Unemployment rate for other race residents
- 23.0%Males
- Unemployment rate for two or more race residents
- 12.8%Females
- Unemployment rate for Hispanic or Latino residents
- 12.8%Males
- 23.7%Females

- Year of entry for the foreign-born population in Richgrove, California
- 1532010 or later
- 1942000 to 2009
- 1891990 to 1999
- 4441980 to 1989
- 2891970 to 1979
- 95Before 1970
Most common places of birth for foreign-born residents (%):
| Richgrove: | 90.9% (700) |
| California: | 37.2% (3,881,193) |
| Richgrove: | 6.2% (48) |
| California: | 0.1% (10,349) |
Place of birth for U.S.-born residents:
- This state: 992
- Other state: 37
- Northeast: 0
- Midwest: 0
- South: 33
- West: 0
92.1% of Richgrove residents lived in the same house 1 years ago.
Out of people who lived in different houses, 38.6% lived in this county.
Out of people who lived in different counties, 100.0% lived in California.
| Richgrove: | 92.1% |
| State average: | 88.9% |
Education attainment for males 25 years and older:
- No schooling: 69
- Nursery to 4th grade: 27
- 5th and 6th grade: 179
- 7th and 8th grade: 40
- 9th grade: 21
- 10th grade: 19
- 11th grade: 0
- 12th grade, no diploma: 0
- High school graduate (or equivalency): 163
- Less than 1 year of college: 0
- Some college more than 1 year, no degree: 74
- Associate degree: 7
- Bachelor's degree: 0
- Master's degree: 0
- Professional school degree: 0
- Doctorate degree: 0

Education attainment for females 25 years and older:
- No schooling: 56
- Nursery to 4th grade: 40
- 5th and 6th grade: 103
- 7th and 8th grade: 47
- 9th grade: 16
- 10th grade: 0
- 11th grade: 0
- 12th grade, no diploma: 8
- High school graduate (or equivalency): 76
- Less than 1 year of college: 5
- Some college more than 1 year, no degree: 51
- Associate degree: 56
- Bachelor's degree: 0
- Master's degree: 0
- Professional school degree: 0
- Doctorate degree: 0


Housing units in structures:
- One, detached: 403
- One, attached: 17
- Two: 10
- 3 or 4: 32
- 5 to 9: 49
- 10 to 19: 11
- 20 to 49: 6
- 50 or more: 5
- Mobile homes: 9
Housing units lacking complete kitchen facilities in 2022: 2.6%
House/condo owner moved in on average 23 years ago
Renter moved in on average 6 years ago

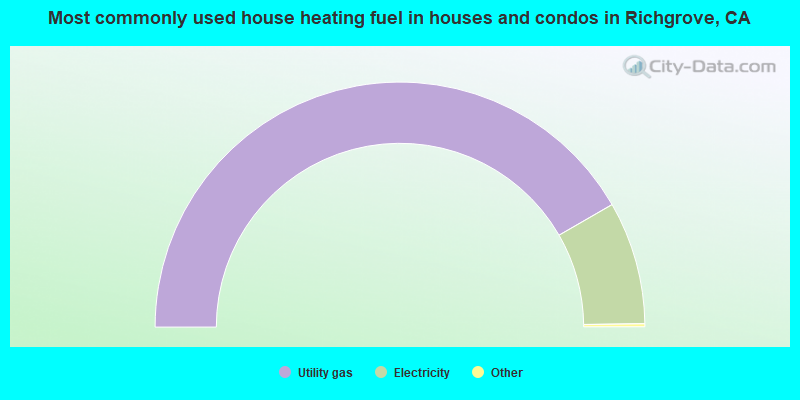
- 83.7%Utility gas
- 16.3%Electricity

- 69.0%Utility gas
- 28.2%Electricity
- 2.8%Bottled, tank, or LP gas
Private vs. public school enrollment:
| Here: | 0.0% |
| California: | 10.5% |
| Here: | 0.0% |
| California: | 8.5% |
| Here: | 0.0% |
| California: | 15.9% |


