Richardson, TX (Texas) Houses and Residents
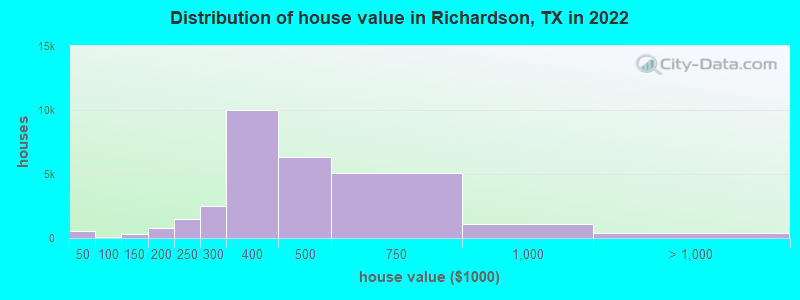
Estimated median house or condo value in 2022: $411,300 (it was $130,500 in 2000 )
Richardson:
$411,300Texas:
$275,400
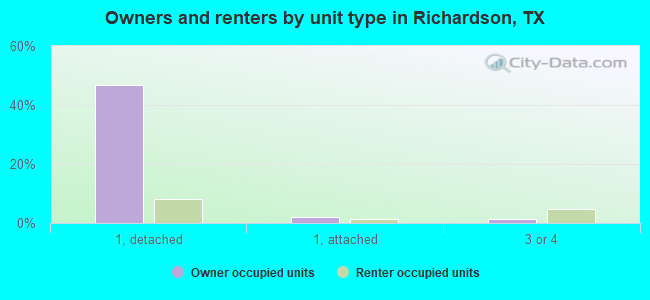
Lower value quartile - upper value quartile: $318,600 - $531,400Mean price in 2022: Detached houses: $492,777 Here:
$492,777State:
$369,058
Townhouses or other attached units: $303,749 Here:
$303,749State:
$327,631
In 3-to-4-unit structures: $212,539 Here:
$212,539State:
$209,652
In 5-or-more-unit structures: $350,487 Here:
$350,487State:
$413,944
Mobile homes: $153,170 Here:
$153,170State:
$124,413
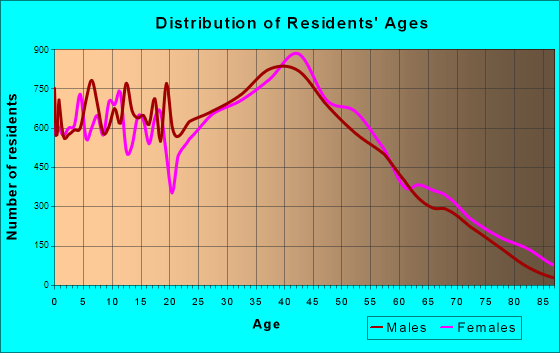
Total population: 108,617 (Urban population: 91,635, Rural population: 0)
Houses: 49,838 (48,057 occupied: 23,871 owner occupied, 24,186 renter occupied )
% of renters here:
50%State:
38%
Housing density: 1,745 houses/condos per square mile
Median price asked for vacant for-sale houses and condos in 2022: $269,942.
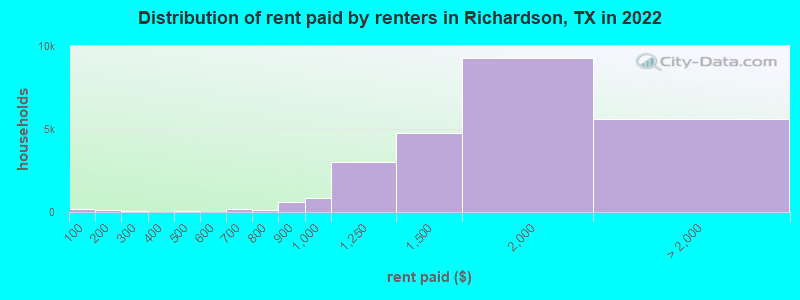
Median contract rent in 2022: $1,560 (lower quartile is $1,240, upper quartile is $1,898)
Median rent asked for vacant for-rent units in 2022: $1,114
Median gross rent in Richardson, TX in 2022: $1,725
Housing units in Richardson with a mortgage: 13,791 (1,465 second mortgage, 0 home equity loan, 1,385 both second mortgage and home equity loan )Houses without a mortgage: 446
Median household income for houses/condos with a mortgage: $137,487
Median household income for apartments without a mortgage: $100,403
Median monthly housing costs: $1,670
Data:
Median house or condo value ($)
Median house or condo value ($ change since 2000)
Median house or condo value ($) - White
Median house or condo value ($) - Black or African American
Median house or condo value ($) - Asian
Median house or condo value ($) - Hispanic or Latino
Median house or condo value ($) - American Indian and Alaska Native
Median house or condo value ($) - Multirace
Median house or condo value ($) - Other Race
Median price asked for mobile homes ($)
Household density (households per square mile)
Mean house or condo value by units in structure - 1, detached ($)
Mean house or condo value by units in structure - 1, attached ($)
Mean house or condo value by units in structure - 2 ($)
Mean house or condo value by units in structure by units in structure - 3 or 4 ($)
Mean house or condo value by units in structure - 5 or more ($)
Mean house or condo value by units in structure - Boat, RV, van, etc. ($)
Mean house or condo value by units in structure - Mobile home ($)
Median contract rent ($)
Median contract rent - Lower quartile ($)
Median contract rent - Upper quartile ($)
Median gross rent ($)
Urban houses (%)
Rural houses (%)
Houses occupied (%)
Houses occupied (% change since 2000)
Houses owner occupied (%)
Houses owner occupied (% change since 2000)
Houses renter occupied (%)
Houses renter occupied (% change since 2000)
Vacant housing units - For rent (%)
Vacant housing units - For rent (% change since 2000)
Vacant housing units - For sale only (%)
Vacant housing units - For sale only (% change since 2000)
Vacant housing units - Rented or sold, not occupied (%)
Vacant housing units - Rented or sold, not occupied (% change since 2000)
Vacant housing units - For seasonal, recreational, or occasional use (%)
Vacant housing units - For seasonal, recreational, or occasional use (% change since 2000)
Vacant housing units - For migrant workers (%)
Vacant housing units - For migrant workers (% change since 2000)
Vacant housing units - Other vacant (%)
Vacant housing units - Other vacant (% change since 2000)
Median monthly housing costs ($)
Median household income for houses/condos with a mortgage ($)
Median household income for houses/condos without a mortgage ($)
Median household income ($)
Median household income ($) - White
Median household income ($) - Black or African American
Median household income ($) - Asian
Median household income ($) - Hispanic or Latino
Median household income ($) - American Indian and Alaska Native
Median household income ($) - Multirace
Median household income ($) - Other Race
Mortgage status - with mortgage (%)
Mortgage status - with second mortgage (%)
Mortgage status - with home equity loan (%)
Mortgage status - with both second mortgage and home equity loan (%)
Mortgage status - without a mortgage (%)
Median year house/condo built
Median year apartment built
Household type by relationship - Male householder living alone (%)
Household type by relationship - Male householder not living alone (%)
Household type by relationship - Female householder living alone (%)
Household type by relationship - Female householder not living alone (%)
Household type by relationship - Opposite-Sex spouse (%)
Household type by relationship - Same-Sex spouse (%)
Household type by relationship - Opposite-Sex unmarried partner (%)
Household type by relationship - Same-Sex unmarried partner (%)
Household type by relationship - In group quarters (%)
Size of family households - 2-person household (%)
Size of family households - 3-person household (%)
Size of family households - 4-person household (%)
Size of family households - 5-person household (%)
Size of family households - 6-person household (%)
Size of family households - 7-or-more-person household (%)
Size of nonfamily households - 1-person household (%)
Size of nonfamily households - 2-person household (%)
Size of nonfamily households - 3-person household (%)
Size of nonfamily households - 4-person household (%)
Size of nonfamily households - 5-person household (%)
Size of nonfamily households - 6-person household (%)
Size of nonfamily households - 7-or-moreperson household (%)
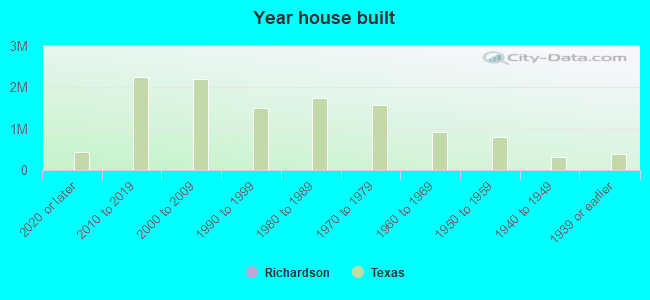
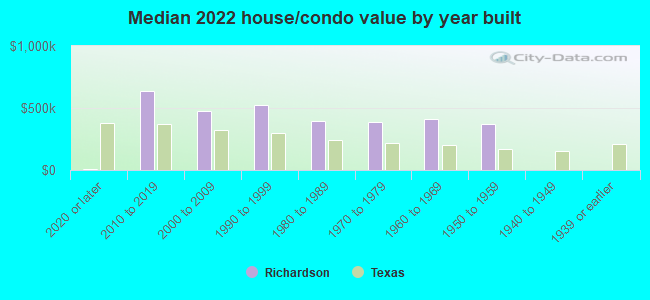
Year house built - Built 2010 or later (%)
Year house built - Built 2000 to 2009 (%)
Year house built - Built 1990 to 1999 (%)
Year house built - Built 1980 to 1989 (%)
Year house built - Built 1970 to 1979 (%)
Year house built - Built 1960 to 1969 (%)
Year house built - Built 1950 to 1959 (%)
Year house built - Built 1940 to 1949 (%)
Year house built - Built 1939 or earlier (%)
Median number of rooms in houses and condos
Median number of rooms in apartments
Median number of bedrooms in owner occupied houses
Mean number of bedrooms in owner occupied houses
Median number of bedrooms in renter occupied houses
Mean number of bedrooms in renter occupied houses
Median number of vehichles in owner occupied houses
Mean number of vehichles in owner occupied houses
Median number of vehichles in renter occupied houses
Mean number of vehichles in renter occupied houses
Rooms in owner-occupied houses - 1 room (%)
Rooms in owner-occupied houses - 2 rooms (%)
Rooms in owner-occupied houses - 3 rooms (%)
Rooms in owner-occupied houses - 4 rooms (%)
Rooms in owner-occupied houses - 5 rooms (%)
Rooms in owner-occupied houses - 6 rooms (%)
Rooms in owner-occupied houses - 7 rooms (%)
Rooms in owner-occupied houses - 8 rooms (%)
Rooms in owner-occupied houses - 9+ rooms (%)
Rooms in renter-occupied houses - 1 room (%)
Rooms in renter-occupied houses - 2 rooms (%)
Rooms in renter-occupied houses - 3 rooms (%)
Rooms in renter-occupied houses - 4 rooms (%)
Rooms in renter-occupied houses - 5 rooms (%)
Rooms in renter-occupied houses - 6 rooms (%)
Rooms in renter-occupied houses - 7 rooms (%)
Rooms in renter-occupied houses - 8 rooms (%)
Rooms in renter-occupied houses - 9+ rooms (%)
Bedrooms in owner-occupied houses - no bedrooms (%)
Bedrooms in owner-occupied houses - 1 bedroom (%)
Bedrooms in owner-occupied houses - 2 bedrooms (%)
Bedrooms in owner-occupied houses - 3 bedrooms (%)
Bedrooms in owner-occupied houses - 4 bedrooms (%)
Bedrooms in owner-occupied houses - 5+ bedrooms (%)
Bedrooms in renter-occupied houses - no bedrooms (%)
Bedrooms in renter-occupied houses - 1 bedroom (%)
Bedrooms in renter-occupied houses - 2 bedrooms (%)
Bedrooms in renter-occupied houses - 3 bedrooms (%)
Bedrooms in renter-occupied houses - 4 bedrooms (%)
Bedrooms in renter-occupied houses - 5+ bedrooms (%)
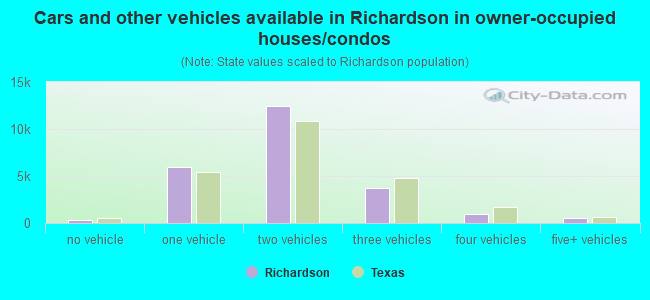
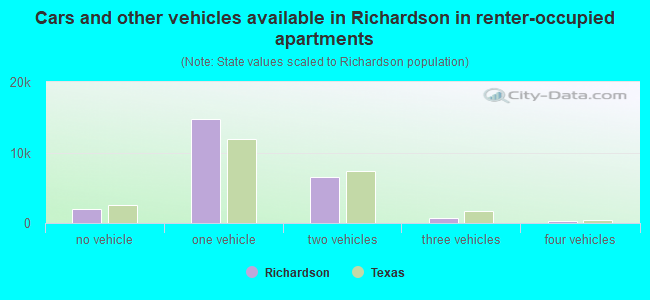
Vehicles available in owner-occupied houses - no vehicle available (%)
Vehicles available in owner-occupied houses - 1 vehicle available(%)
Vehicles available in owner-occupied houses - 2 Vehicles available (%)
Vehicles available in owner-occupied houses - 3 Vehicles available (%)
Vehicles available in owner-occupied houses - 4 Vehicles available (%)
Vehicles available in owner-occupied houses - 5+ Vehicles available (%)
Vehicles available in renter-occupied houses - no vehicle available (%)
Vehicles available in renter-occupied houses - 1 vehicle available (%)
Vehicles available in renter-occupied houses - 2 Vehicles available (%)
Vehicles available in renter-occupied houses - 3 Vehicles available (%)
Vehicles available in renter-occupied houses - 4 Vehicles available (%)
Vehicles available in renter-occupied houses - 5+ Vehicles available (%)
Housing units in structures - 1, detached (%)
Housing units in structures - 1, attached (%)
Housing units in structures - 2 (%)
Housing units in structures - 3 or 4 (%)
Housing units in structures - 5 to 9 (%)
Housing units in structures - 10 to 19 (%)
Housing units in structures - 20 to 49 (%)
Housing units in structures - 50 or more (%)
Housing units in structures - Mobile home (%)
Housing units in structures - Boat, RV, van, etc. (%)
Housing units in structures - Owners - 1, detached (%)
Housing units in structures - Owners - 1, attached (%)
Housing units in structures - Owners - 2 (%)
Housing units in structures - Owners - 3 or 4 (%)
Housing units in structures - Owners - 5 to 9 (%)
Housing units in structures - Owners - 10 to 19 (%)
Housing units in structures - Owners - 20 to 49 (%)
Housing units in structures - Owners - 50 or more (%)
Housing units in structures - Owners - Mobile home (%)
Housing units in structures - Owners - Boat, RV, van, etc. (%)
Housing units in structures - Renters - 1, detached (%)
Housing units in structures - Renters - 1, attached (%)
Housing units in structures - Renters - 2 (%)
Housing units in structures - Renters - 3 or 4 (%)
Housing units in structures - Renters - 5 to 9 (%)
Housing units in structures - Renters - 10 to 19 (%)
Housing units in structures - Renters - 20 to 49 (%)
Housing units in structures - Renters - 50 or more (%)
Housing units in structures - Renters - Mobile home (%)
Housing units in structures - Renters - Boat, RV, van, etc. (%)
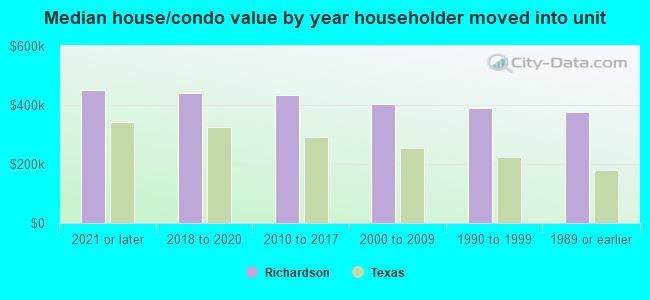
House/condo owner moved in on average (years ago)
Renter moved in on average (years ago)
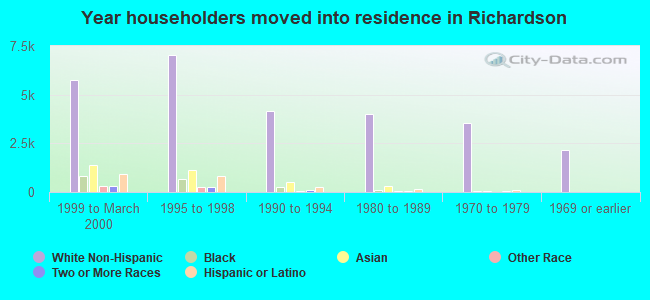
Year householder moved into unit - Moved in 1999 to March 2000 (%)
Year householder moved into unit - Moved in 1999 to March 2000 (%) - White
Year householder moved into unit - Moved in 1999 to March 2000 (%) - Black or African American
Year householder moved into unit - Moved in 1999 to March 2000 (%) - Asian
Year householder moved into unit - Moved in 1999 to March 2000 (%) - Hispanic or Latino
Year householder moved into unit - Moved in 1999 to March 2000 (%) - American Indian and Alaska Native
Year householder moved into unit - Moved in 1999 to March 2000 (%) - Multirace
Year householder moved into unit - Moved in 1999 to March 2000 (%) - Other Race
Year householder moved into unit - Moved in 1995 to 1998 (%)
Year householder moved into unit - Moved in 1995 to 1998 (%) - White
Year householder moved into unit - Moved in 1995 to 1998 (%) - Black or African American
Year householder moved into unit - Moved in 1995 to 1998 (%) - Asian
Year householder moved into unit - Moved in 1995 to 1998 (%) - Hispanic or Latino
Year householder moved into unit - Moved in 1995 to 1998 (%) - American Indian and Alaska Native
Year householder moved into unit - Moved in 1995 to 1998 (%) - Multirace
Year householder moved into unit - Moved in 1995 to 1998 (%) - Other Race
Year householder moved into unit - Moved in 1990 to 1994 (%)
Year householder moved into unit - Moved in 1990 to 1994 (%) - White
Year householder moved into unit - Moved in 1990 to 1994 (%) - Black or African American
Year householder moved into unit - Moved in 1990 to 1994 (%) - Asian
Year householder moved into unit - Moved in 1990 to 1994 (%) - Hispanic or Latino
Year householder moved into unit - Moved in 1990 to 1994 (%) - American Indian and Alaska Native
Year householder moved into unit - Moved in 1990 to 1994 (%) - Multirace
Year householder moved into unit - Moved in 1990 to 1994 (%) - Other Race
Year householder moved into unit - Moved in 1980 to 1989 (%)
Year householder moved into unit - Moved in 1980 to 1989 (%) - White
Year householder moved into unit - Moved in 1980 to 1989 (%) - Black or African American
Year householder moved into unit - Moved in 1980 to 1989 (%) - Asian
Year householder moved into unit - Moved in 1980 to 1989 (%) - Hispanic or Latino
Year householder moved into unit - Moved in 1980 to 1989 (%) - American Indian and Alaska Native
Year householder moved into unit - Moved in 1980 to 1989 (%) - Multirace
Year householder moved into unit - Moved in 1980 to 1989 (%) - Other Race
Year householder moved into unit - Moved in 1970 to 1979 (%)
Year householder moved into unit - Moved in 1970 to 1979 (%) - White
Year householder moved into unit - Moved in 1970 to 1979 (%) - Black or African American
Year householder moved into unit - Moved in 1970 to 1979 (%) - Asian
Year householder moved into unit - Moved in 1970 to 1979 (%) - Hispanic or Latino
Year householder moved into unit - Moved in 1970 to 1979 (%) - American Indian and Alaska Native
Year householder moved into unit - Moved in 1970 to 1979 (%) - Multirace
Year householder moved into unit - Moved in 1970 to 1979 (%) - Other Race
Year householder moved into unit - Moved in 1969 or earlier (%)
Year householder moved into unit - Moved in 1969 or earlier (%) - White
Year householder moved into unit - Moved in 1969 or earlier (%) - Black or African American
Year householder moved into unit - Moved in 1969 or earlier (%) - Asian
Year householder moved into unit - Moved in 1969 or earlier (%) - Hispanic or Latino
Year householder moved into unit - Moved in 1969 or earlier (%) - American Indian and Alaska Native
Year householder moved into unit - Moved in 1969 or earlier (%) - Multirace
Year householder moved into unit - Moved in 1969 or earlier (%) - Other Race
Housing units lacking complete plumbing facilities (%)
Housing units lacking complete kitchen facilities (%)
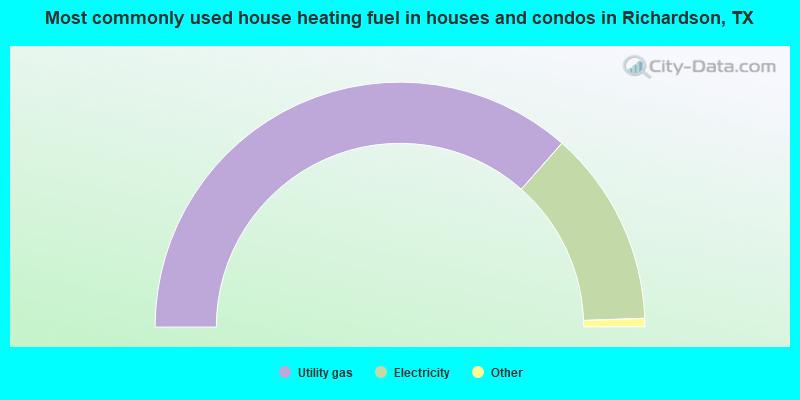
House heating fuel used in houses and condos - Utility gas (%)
House heating fuel used in houses and condos - Bottled, tank, or LP gas (%)
House heating fuel used in houses and condos - Electricity (%)
House heating fuel used in houses and condos - Fuel oil, kerosene, etc. (%)
House heating fuel used in houses and condos - Coal or coke (%)
House heating fuel used in houses and condos - Wood (%)
House heating fuel used in houses and condos - Solar energy (%)
House heating fuel used in houses and condos - Other fuel (%)
House heating fuel used in houses and condos - No fuel used (%)
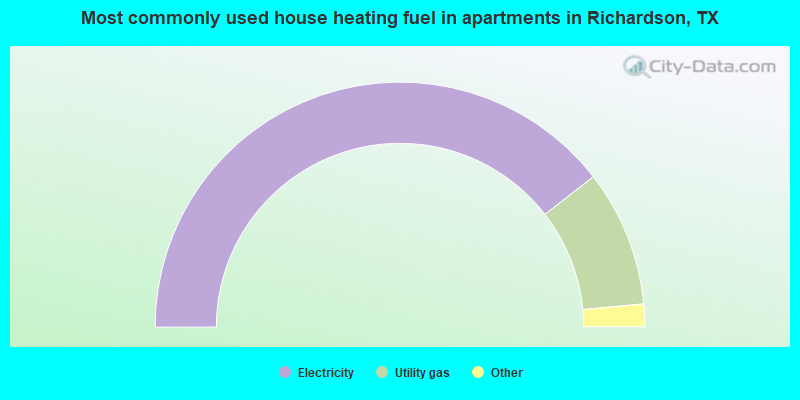
House heating fuel used in apartments - Utility gas (%)
House heating fuel used in apartments - Bottled, tank, or LP gas (%)
House heating fuel used in apartments - Electricity (%)
House heating fuel used in apartments - Fuel oil, kerosene, etc. (%)
House heating fuel used in apartments - Coal or coke (%)
House heating fuel used in apartments - Wood (%)
House heating fuel used in apartments - Solar energy (%)
House heating fuel used in apartments - Other fuel (%)
House heating fuel used in apartments - No fuel used (%)
Latest news about housing in Richardson, TX collected exclusively by city-data.com from local newspapers, TV, and radio stations
Median year house/condo built: 1976Median year apartment built: 1997Household type by relationship:
Households: 118,830
Male householders: 26,778 (8,677 living alone ), Female householders: 21,279 (8,281 living alone )21,464 spouses (21,379 opposite-sex spouses ), 2,247 unmarried partners , (2,164 opposite-sex unmarried partners ), 30,085 children (28,350 natural , 796 adopted , 939 stepchildren ), 1,390 grandchildren , 802 brothers or sisters , 1,936 parents , 0 foster children , 2,618 other relatives , 3,798 non-relatives In group quarters: 6,433
Size of family households: 12,829 2-persons , 5,390 3-persons , 4,710 4-persons , 2,380 5-persons , 1,301 6-persons , 269 7-or-more-persons .
Size of nonfamily households: 16,958 1-person , 3,749 2-persons , 373 3-persons , 98 4-persons .
16,827 married couples with children. single-parent households (657 men , 4,552 women ).
67.6% of residents of Richardson speak English at home. of residents speak Spanish at home (61% speak English very well , 28% speak English well , 11% speak English not well , 1% don't speak English at all ).of residents speak other Indo-European language at home (72% speak English very well , 17% speak English well , 8% speak English not well , 3% don't speak English at all ).of residents speak Asian or Pacific Island language at home (73% speak English very well , 18% speak English well , 8% speak English not well , 1% don't speak English at all ).of residents speak other language at home (64% speak English very well , 29% speak English well , 7% speak English not well ).
Foreign born population: 26,308 (22.1%)of them are naturalized citizens )
Median number of rooms in houses and condos:
Median number of rooms in apartments
Owner-occupied Renter-occupied
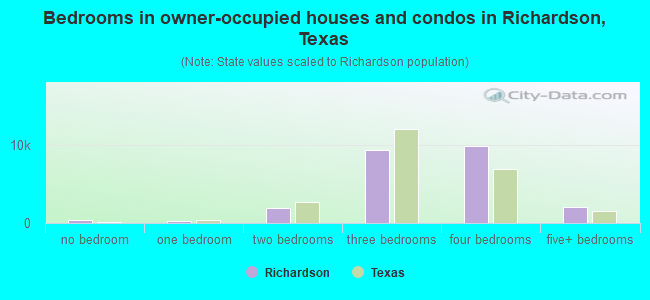
Bedrooms in owner-occupied houses and condos in Richardson, Texas
420 no bedroom 299 1 bedroom 1,907 2 bedrooms 9,401 3 bedrooms 9,832 4 bedrooms 2,012 5+ bedrooms
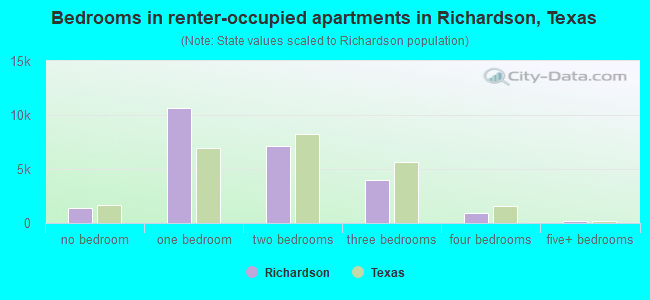
Bedrooms in renter-occupied apartments in Richardson, Texas
1,371 no bedroom 10,691 1 bedroom 7,117 2 bedrooms 3,947 3 bedrooms 897 4 bedrooms 163 5+ bedrooms
Owner-occupied Renter-occupied
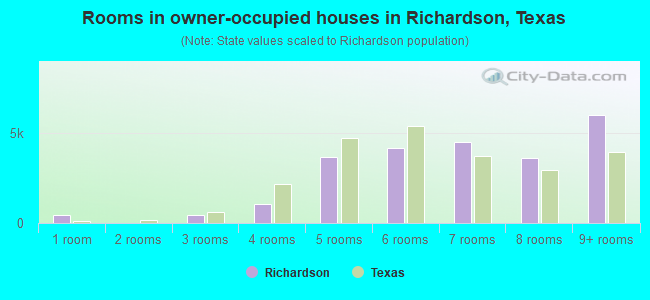
Rooms in owner-occupied houses in Richardson, Texas
420 1 room 0 2 rooms 431 3 rooms 1,039 4 rooms 3,687 5 rooms 4,163 6 rooms 4,483 7 rooms 3,636 8 rooms 6,012 9+ rooms
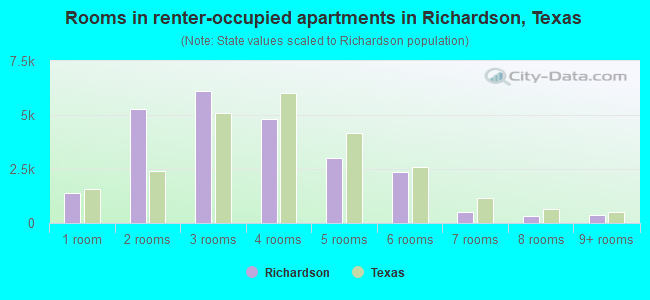
Rooms in renter-occupied apartments in Richardson, Texas
1,371 1 room 5,275 2 rooms 6,111 3 rooms 4,816 4 rooms 2,995 5 rooms 2,379 6 rooms 516 7 rooms 332 8 rooms 391 9+ rooms
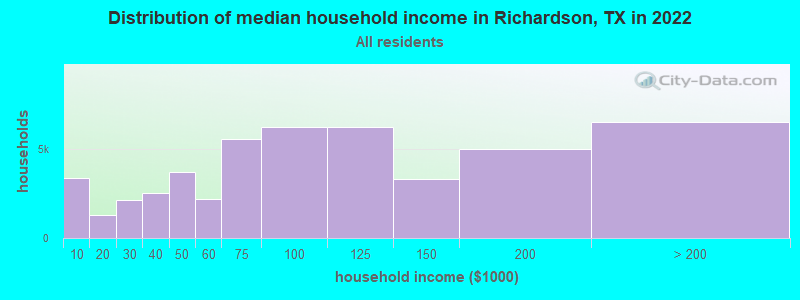
Richardson, TX household income distribution 3,354 Less than $10,0001,285 $10,000 to $19,9992,126 $20,000 to $29,9992,524 $30,000 to $39,9993,691 $40,000 to $49,9992,169 $50,000 to $59,9995,573 $60,000 to $74,9996,245 $75,000 to $99,9996,232 $100,000 to $124,9993,319 $125,000 to $149,9995,015 $150,000 to $199,9996,524 $200,000 or more
Home value of owner - occupied houses in 2022 in Richardson, TX 232 Less than $10,00029 $15,000 to $19,99950 $20,000 to $24,99928 $25,000 to $29,999118 $30,000 to $34,99931 $35,000 to $39,99922 $40,000 to $49,99933 $50,000 to $59,9998 $60,000 to $69,9999 $80,000 to $89,99912 $90,000 to $99,999132 $100,000 to $124,999160 $125,000 to $149,999369 $150,000 to $174,999393 $175,000 to $199,9991,472 $200,000 to $249,9992,510 $250,000 to $299,9999,978 $300,000 to $399,9996,314 $400,000 to $499,9995,102 $500,000 to $749,9991,072 $750,000 to $999,999167 $1,000,000 to $1,499,999158 $1,500,000 to $1,999,99994 $2,000,000 or moreRent paid by renters in 2022 in Richardson, TX 161 Less than $10026 $100 to $149101 $150 to $19938 $200 to $24925 $250 to $29931 $400 to $44914 $450 to $49911 $500 to $5496 $550 to $59985 $600 to $64991 $650 to $69988 $700 to $74952 $750 to $799612 $800 to $899818 $900 to $9992,990 $1,000 to $1,2494,785 $1,250 to $1,4999,283 $1,500 to $1,9994,022 $2,000 to $2,499610 $2,500 to $2,999114 $3,000 to $3,499318 $3,500 or more530 No cash rent
Percentage of workers working in this county: 75.2%Number of people working at home: 17,114 (26.4% of all workers )
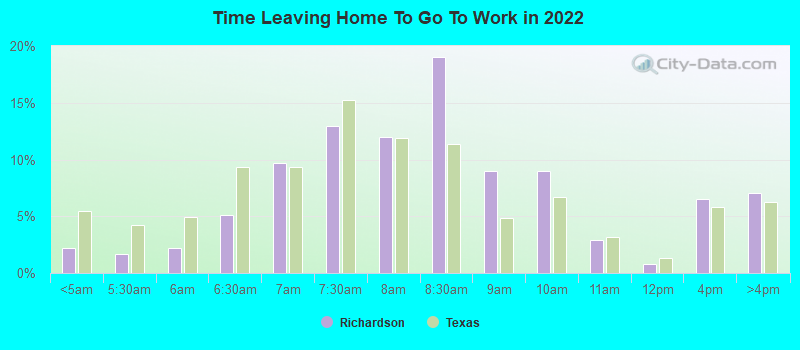
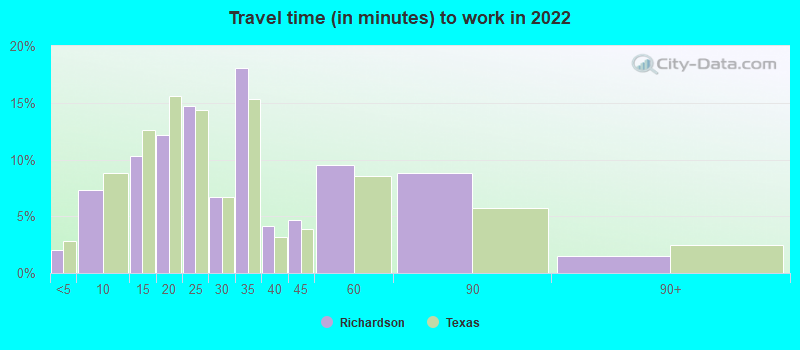
Travel time to work (commute)
Less than 5 minutes: 1,1935 to 9 minutes: 5,75410 to 14 minutes: 6,79415 to 19 minutes: 6,89920 to 24 minutes: 5,91625 to 29 minutes: 3,98730 to 34 minutes: 9,05435 to 39 minutes: 1,84240 to 44 minutes: 2,51845 to 59 minutes: 2,61860 to 89 minutes: 95190 or more minutes: 601
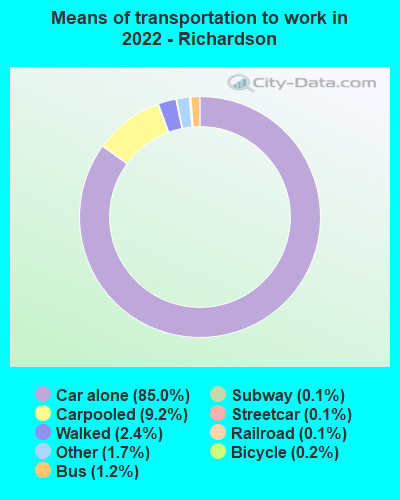
Means of transportation to work:
Drove a car alone: 76,002 (72.1%)Carpooled: 8,399 (8.0%)Bus : 641 (0.6%)Subway or elevated rail : 58 (0.1%)Long-distance train or commuter rail : 95 (0.1%)Light rail, streetcar or trolley : 138 (0.1%)Taxi: 1,865 (1.8%)Bicycle: 282 (0.3%)Walked: 2,342 (2.2%)Worked at home: 17,114 (16.2%)
Unemployment by race in 2022
Unemployment rate for White non-Hispanic residents 6.4% Males4.6% FemalesUnemployment rate for Black residents 6.0% Males6.6% FemalesUnemployment rate for American Indian and Alaska Native residents 8.3% MalesUnemployment rate for Asian residents 6.2% Males2.2% FemalesUnemployment rate for other race residents 1.0% Males2.3% FemalesUnemployment rate for two or more race residents 1.2% Males6.5% FemalesUnemployment rate for Hispanic or Latino residents 1.0% Males5.3% Females
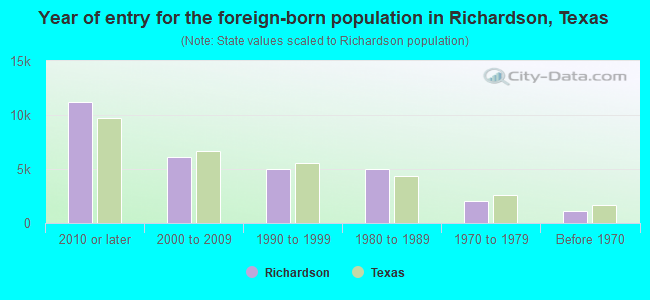
Year of entry for the foreign-born population in Richardson, Texas
11,202 2010 or later 6,118 2000 to 2009 4,990 1990 to 1999 5,001 1980 to 1989 2,010 1970 to 1979 1,105 Before 1970
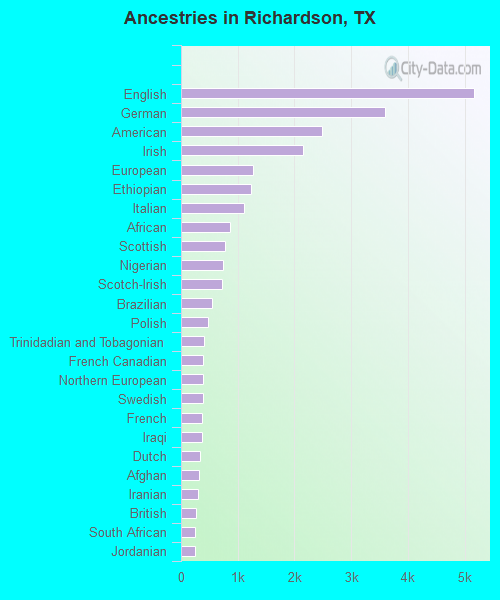
First ancestries reported:
English: 5,169 (7.7%)
German: 3,586 (5.3%)
American: 2,493 (3.7%)
Irish: 2,157 (3.2%)
European: 1,272 (1.9%)
Ethiopian: 1,225 (1.8%)
Italian: 1,117 (1.7%)
African: 868 (1.3%)
Scottish: 776 (1.2%)
Nigerian: 736 (1.1%)
Scotch-Irish: 726 (1.1%)
Brazilian: 545 (0.8%)
Polish: 480 (0.7%)
Trinidadian and Tobagonian: 404 (0.6%)
French Canadian: 394 (0.6%)
Northern European: 393 (0.6%)
Swedish: 380 (0.6%)
French: 375 (0.6%)
Iraqi: 366 (0.5%)
Dutch: 338 (0.5%)
Afghan: 315 (0.5%)
Iranian: 302 (0.4%)
British: 265 (0.4%)
South African: 249 (0.4%)
Jordanian: 242 (0.4%)
Norwegian: 227 (0.3%)
Russian: 223 (0.3%)
Canadian: 210 (0.3%)
Greek: 209 (0.3%)
Bulgarian: 204 (0.3%)
Welsh: 199 (0.3%)
Egyptian: 198 (0.3%)
Ghanaian: 196 (0.3%)
Czech: 186 (0.3%)
Assyrian: 163 (0.2%)
Jamaican: 163 (0.2%)
Arab: 153 (0.2%)
Palestinian: 126 (0.2%)
Kenyan: 125 (0.2%)
Hungarian: 113 (0.2%)
Armenian: 112 (0.2%)
Lithuanian: 111 (0.2%)
Sudanese: 103 (0.2%)
Finnish: 103 (0.2%)
Portuguese: 97 (0.1%)
Turkish: 94 (0.1%)
Lebanese: 71 (0.1%)
Austrian: 70 (0.1%)
Scandinavian: 67 (0.10%)
Syrian: 66 (0.10%)
Eastern European: 66 (0.10%)
Ukrainian: 66 (0.10%)
Barbadian: 63 (0.09%)
Romanian: 53 (0.08%)
Moroccan: 51 (0.08%)
Slavic: 42 (0.06%)
Cape Verdean: 36 (0.05%)
Czechoslovakian: 35 (0.05%)
Belgian: 33 (0.05%)
Danish: 27 (0.04%)
Yugoslavian: 21 (0.03%)
Haitian: 16 (0.02%)
Celtic: 14 (0.02%)
Bahamian: 12 (0.02%)
Pennsylvania German: 9 (0.01%)
Maltese: 8 (0.01%)
Swiss: 8 (0.01%)
Slovak: 7 (0.01%)
Alsatian: 6 (0.01%)
Most common places of birth for foreign-born residents (%): Mexico Richardson:
14.5% (4,084)Texas:
48.4% (2,411,723)
India Richardson:
12.2% (3,434)Texas:
6.1% (306,347)
China, excluding Hong Kong and Taiwan Richardson:
8.9% (2,508)Texas:
2.3% (115,558)
Vietnam Richardson:
5.7% (1,601)Texas:
3.7% (184,770)
Pakistan Richardson:
4.4% (1,236)Texas:
1.2% (62,159)
Iraq Richardson:
2.8% (795)Texas:
0.5% (26,598)
Cameroon Richardson:
2.8% (784)Texas:
0.3% (15,833)
Ethiopia Richardson:
2.6% (736)Texas:
0.5% (24,705)
Philippines Richardson:
2.5% (709)Texas:
2.1% (103,148)
Korea Richardson:
2.4% (678)Texas:
1.2% (60,172)
Taiwan Richardson:
2.4% (676)Texas:
0.6% (27,844)
Nigeria Richardson:
2.1% (602)Texas:
1.9% (96,110)
Honduras Richardson:
1.9% (532)Texas:
3.0% (147,182)
Canada Richardson:
1.8% (522)Texas:
1.1% (55,371)
South Africa Richardson:
1.8% (518)Texas:
0.2% (11,402)
El Salvador Richardson:
1.7% (489)Texas:
4.5% (224,455)
Brazil Richardson:
1.5% (426)Texas:
0.5% (24,723)
Place of birth for U.S.-born residents:
This state: 54,146Other state: 36,608Northeast: 6,686Midwest: 9,630South: 13,125West: 7,167 77.7% of Richardson residents lived in the same house 1 years ago.
Out of people who lived in different houses, 32.3% lived in this county.
Out of people who lived in different counties, 76.1% lived in Texas.
Richardson:
77.7%State average:
85.7%
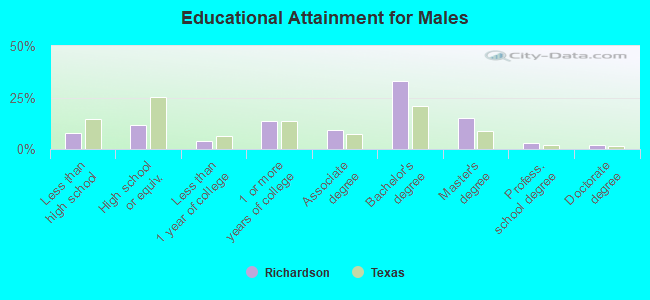
Education attainment for males 25 years and older:
No schooling: 1,035Nursery to 4th grade: 05th and 6th grade: 617th and 8th grade: 3489th grade: 73810th grade: 16611th grade: 24312th grade, no diploma: 605High school graduate (or equivalency): 4,748Less than 1 year of college: 1,593Some college more than 1 year, no degree: 5,479Associate degree: 3,739Bachelor's degree: 13,255Master's degree: 5,984Professional school degree: 1,217Doctorate degree: 722
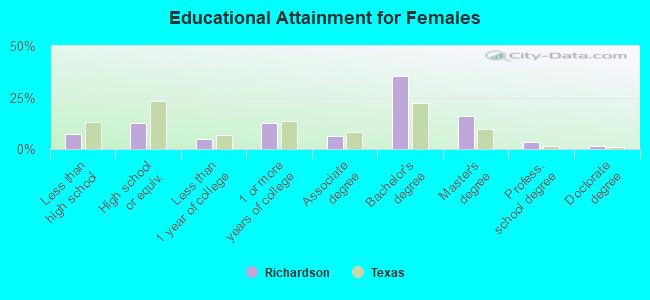
Education attainment for females 25 years and older:
No schooling: 1,553Nursery to 4th grade: 605th and 6th grade: 07th and 8th grade: 479th grade: 23010th grade: 20711th grade: 6212th grade, no diploma: 604High school graduate (or equivalency): 4,965Less than 1 year of college: 1,813Some college more than 1 year, no degree: 5,008Associate degree: 2,551Bachelor's degree: 13,912Master's degree: 6,292Professional school degree: 1,353Doctorate degree: 549
Housing units in structures:
One, detached: 25,269One, attached: 2,145Two: 4153 or 4: 3,9905 to 9: 3,86110 to 19: 2,21620 to 49: 2,30750 or more: 9,595Mobile homes: 40Housing units lacking complete plumbing facilities in 2022: 0.8%Housing units lacking complete kitchen facilities in 2022: 2.9%House/condo owner moved in on average 12 years ago
Renter moved in on average 1 years ago
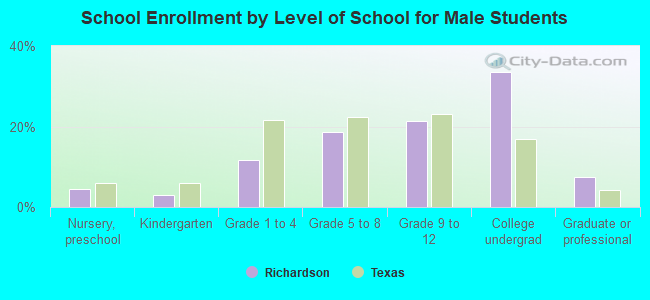
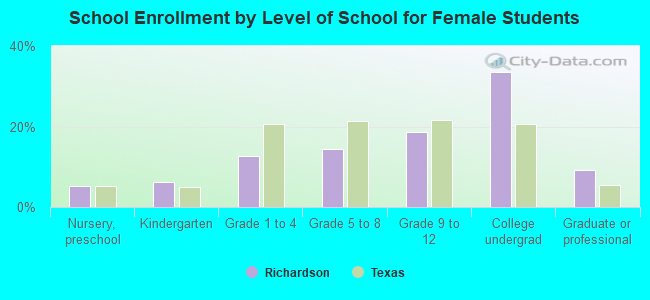
Private vs. public school enrollment:
Students in private schools in grades 1 to 8 (elementary and middle school): 1,561 Students in private schools in grades 9 to 12 (high school): 1,543 Students in private undergraduate colleges: 1,390