Rice Lake, WI (Wisconsin) Houses and Residents
Estimated median house or condo value in 2022: $176,873 (it was $69,900 in 2000 )
Rice Lake:
$176,873Wisconsin:
$252,800
Lower value quartile - upper value quartile: $126,222 - $234,866Total population: 8,286 (Urban population: 7,754 (all inside urban clusters), Rural population: 395 (all nonfarm) )
Houses: 4,214 (3,887 occupied: 2,156 owner occupied, 1,784 renter occupied )
% of renters here:
45%State:
32%
Housing density: 488 houses/condos per square mile
Median price asked for vacant for-sale houses and condos in 2022: $56,697.
Median contract rent in 2022: $657 (lower quartile is $470, upper quartile is $850)
Median rent asked for vacant for-rent units in 2022: $1,164
Median gross rent in Rice Lake, WI in 2022: $816
Housing units in Rice Lake with a mortgage: 1,159 (80 second mortgage, 0 home equity loan, 62 both second mortgage and home equity loan )Houses without a mortgage: 77
Median household income for houses/condos with a mortgage: $66,260
Median household income for apartments without a mortgage: $60,548
Median monthly housing costs: $811
Data:
Median house or condo value ($)
Median house or condo value ($ change since 2000)
Median house or condo value ($) - White
Median house or condo value ($) - Black or African American
Median house or condo value ($) - Asian
Median house or condo value ($) - Hispanic or Latino
Median house or condo value ($) - American Indian and Alaska Native
Median house or condo value ($) - Multirace
Median house or condo value ($) - Other Race
Median price asked for mobile homes ($)
Household density (households per square mile)
Mean house or condo value by units in structure - 1, detached ($)
Mean house or condo value by units in structure - 1, attached ($)
Mean house or condo value by units in structure - 2 ($)
Mean house or condo value by units in structure by units in structure - 3 or 4 ($)
Mean house or condo value by units in structure - 5 or more ($)
Mean house or condo value by units in structure - Boat, RV, van, etc. ($)
Mean house or condo value by units in structure - Mobile home ($)
Median contract rent ($)
Median contract rent - Lower quartile ($)
Median contract rent - Upper quartile ($)
Median gross rent ($)
Urban houses (%)
Rural houses (%)
Houses occupied (%)
Houses occupied (% change since 2000)
Houses owner occupied (%)
Houses owner occupied (% change since 2000)
Houses renter occupied (%)
Houses renter occupied (% change since 2000)
Vacant housing units - For rent (%)
Vacant housing units - For rent (% change since 2000)
Vacant housing units - For sale only (%)
Vacant housing units - For sale only (% change since 2000)
Vacant housing units - Rented or sold, not occupied (%)
Vacant housing units - Rented or sold, not occupied (% change since 2000)
Vacant housing units - For seasonal, recreational, or occasional use (%)
Vacant housing units - For seasonal, recreational, or occasional use (% change since 2000)
Vacant housing units - For migrant workers (%)
Vacant housing units - For migrant workers (% change since 2000)
Vacant housing units - Other vacant (%)
Vacant housing units - Other vacant (% change since 2000)
Median monthly housing costs ($)
Median household income for houses/condos with a mortgage ($)
Median household income for houses/condos without a mortgage ($)
Median household income ($)
Median household income ($) - White
Median household income ($) - Black or African American
Median household income ($) - Asian
Median household income ($) - Hispanic or Latino
Median household income ($) - American Indian and Alaska Native
Median household income ($) - Multirace
Median household income ($) - Other Race
Mortgage status - with mortgage (%)
Mortgage status - with second mortgage (%)
Mortgage status - with home equity loan (%)
Mortgage status - with both second mortgage and home equity loan (%)
Mortgage status - without a mortgage (%)
Median year house/condo built
Median year apartment built
Household type by relationship - Male householder living alone (%)
Household type by relationship - Male householder not living alone (%)
Household type by relationship - Female householder living alone (%)
Household type by relationship - Female householder not living alone (%)
Household type by relationship - Opposite-Sex spouse (%)
Household type by relationship - Same-Sex spouse (%)
Household type by relationship - Opposite-Sex unmarried partner (%)
Household type by relationship - Same-Sex unmarried partner (%)
Household type by relationship - In group quarters (%)
Size of family households - 2-person household (%)
Size of family households - 3-person household (%)
Size of family households - 4-person household (%)
Size of family households - 5-person household (%)
Size of family households - 6-person household (%)
Size of family households - 7-or-more-person household (%)
Size of nonfamily households - 1-person household (%)
Size of nonfamily households - 2-person household (%)
Size of nonfamily households - 3-person household (%)
Size of nonfamily households - 4-person household (%)
Size of nonfamily households - 5-person household (%)
Size of nonfamily households - 6-person household (%)
Size of nonfamily households - 7-or-moreperson household (%)
Year house built - Built 2010 or later (%)
Year house built - Built 2000 to 2009 (%)
Year house built - Built 1990 to 1999 (%)
Year house built - Built 1980 to 1989 (%)
Year house built - Built 1970 to 1979 (%)
Year house built - Built 1960 to 1969 (%)
Year house built - Built 1950 to 1959 (%)
Year house built - Built 1940 to 1949 (%)
Year house built - Built 1939 or earlier (%)
Median number of rooms in houses and condos
Median number of rooms in apartments
Median number of bedrooms in owner occupied houses
Mean number of bedrooms in owner occupied houses
Median number of bedrooms in renter occupied houses
Mean number of bedrooms in renter occupied houses
Median number of vehichles in owner occupied houses
Mean number of vehichles in owner occupied houses
Median number of vehichles in renter occupied houses
Mean number of vehichles in renter occupied houses
Rooms in owner-occupied houses - 1 room (%)
Rooms in owner-occupied houses - 2 rooms (%)
Rooms in owner-occupied houses - 3 rooms (%)
Rooms in owner-occupied houses - 4 rooms (%)
Rooms in owner-occupied houses - 5 rooms (%)
Rooms in owner-occupied houses - 6 rooms (%)
Rooms in owner-occupied houses - 7 rooms (%)
Rooms in owner-occupied houses - 8 rooms (%)
Rooms in owner-occupied houses - 9+ rooms (%)
Rooms in renter-occupied houses - 1 room (%)
Rooms in renter-occupied houses - 2 rooms (%)
Rooms in renter-occupied houses - 3 rooms (%)
Rooms in renter-occupied houses - 4 rooms (%)
Rooms in renter-occupied houses - 5 rooms (%)
Rooms in renter-occupied houses - 6 rooms (%)
Rooms in renter-occupied houses - 7 rooms (%)
Rooms in renter-occupied houses - 8 rooms (%)
Rooms in renter-occupied houses - 9+ rooms (%)
Bedrooms in owner-occupied houses - no bedrooms (%)
Bedrooms in owner-occupied houses - 1 bedroom (%)
Bedrooms in owner-occupied houses - 2 bedrooms (%)
Bedrooms in owner-occupied houses - 3 bedrooms (%)
Bedrooms in owner-occupied houses - 4 bedrooms (%)
Bedrooms in owner-occupied houses - 5+ bedrooms (%)
Bedrooms in renter-occupied houses - no bedrooms (%)
Bedrooms in renter-occupied houses - 1 bedroom (%)
Bedrooms in renter-occupied houses - 2 bedrooms (%)
Bedrooms in renter-occupied houses - 3 bedrooms (%)
Bedrooms in renter-occupied houses - 4 bedrooms (%)
Bedrooms in renter-occupied houses - 5+ bedrooms (%)
Vehicles available in owner-occupied houses - no vehicle available (%)
Vehicles available in owner-occupied houses - 1 vehicle available(%)
Vehicles available in owner-occupied houses - 2 Vehicles available (%)
Vehicles available in owner-occupied houses - 3 Vehicles available (%)
Vehicles available in owner-occupied houses - 4 Vehicles available (%)
Vehicles available in owner-occupied houses - 5+ Vehicles available (%)
Vehicles available in renter-occupied houses - no vehicle available (%)
Vehicles available in renter-occupied houses - 1 vehicle available (%)
Vehicles available in renter-occupied houses - 2 Vehicles available (%)
Vehicles available in renter-occupied houses - 3 Vehicles available (%)
Vehicles available in renter-occupied houses - 4 Vehicles available (%)
Vehicles available in renter-occupied houses - 5+ Vehicles available (%)
Housing units in structures - 1, detached (%)
Housing units in structures - 1, attached (%)
Housing units in structures - 2 (%)
Housing units in structures - 3 or 4 (%)
Housing units in structures - 5 to 9 (%)
Housing units in structures - 10 to 19 (%)
Housing units in structures - 20 to 49 (%)
Housing units in structures - 50 or more (%)
Housing units in structures - Mobile home (%)
Housing units in structures - Boat, RV, van, etc. (%)
Housing units in structures - Owners - 1, detached (%)
Housing units in structures - Owners - 1, attached (%)
Housing units in structures - Owners - 2 (%)
Housing units in structures - Owners - 3 or 4 (%)
Housing units in structures - Owners - 5 to 9 (%)
Housing units in structures - Owners - 10 to 19 (%)
Housing units in structures - Owners - 20 to 49 (%)
Housing units in structures - Owners - 50 or more (%)
Housing units in structures - Owners - Mobile home (%)
Housing units in structures - Owners - Boat, RV, van, etc. (%)
Housing units in structures - Renters - 1, detached (%)
Housing units in structures - Renters - 1, attached (%)
Housing units in structures - Renters - 2 (%)
Housing units in structures - Renters - 3 or 4 (%)
Housing units in structures - Renters - 5 to 9 (%)
Housing units in structures - Renters - 10 to 19 (%)
Housing units in structures - Renters - 20 to 49 (%)
Housing units in structures - Renters - 50 or more (%)
Housing units in structures - Renters - Mobile home (%)
Housing units in structures - Renters - Boat, RV, van, etc. (%)
House/condo owner moved in on average (years ago)
Renter moved in on average (years ago)
Year householder moved into unit - Moved in 1999 to March 2000 (%)
Year householder moved into unit - Moved in 1999 to March 2000 (%) - White
Year householder moved into unit - Moved in 1999 to March 2000 (%) - Black or African American
Year householder moved into unit - Moved in 1999 to March 2000 (%) - Asian
Year householder moved into unit - Moved in 1999 to March 2000 (%) - Hispanic or Latino
Year householder moved into unit - Moved in 1999 to March 2000 (%) - American Indian and Alaska Native
Year householder moved into unit - Moved in 1999 to March 2000 (%) - Multirace
Year householder moved into unit - Moved in 1999 to March 2000 (%) - Other Race
Year householder moved into unit - Moved in 1995 to 1998 (%)
Year householder moved into unit - Moved in 1995 to 1998 (%) - White
Year householder moved into unit - Moved in 1995 to 1998 (%) - Black or African American
Year householder moved into unit - Moved in 1995 to 1998 (%) - Asian
Year householder moved into unit - Moved in 1995 to 1998 (%) - Hispanic or Latino
Year householder moved into unit - Moved in 1995 to 1998 (%) - American Indian and Alaska Native
Year householder moved into unit - Moved in 1995 to 1998 (%) - Multirace
Year householder moved into unit - Moved in 1995 to 1998 (%) - Other Race
Year householder moved into unit - Moved in 1990 to 1994 (%)
Year householder moved into unit - Moved in 1990 to 1994 (%) - White
Year householder moved into unit - Moved in 1990 to 1994 (%) - Black or African American
Year householder moved into unit - Moved in 1990 to 1994 (%) - Asian
Year householder moved into unit - Moved in 1990 to 1994 (%) - Hispanic or Latino
Year householder moved into unit - Moved in 1990 to 1994 (%) - American Indian and Alaska Native
Year householder moved into unit - Moved in 1990 to 1994 (%) - Multirace
Year householder moved into unit - Moved in 1990 to 1994 (%) - Other Race
Year householder moved into unit - Moved in 1980 to 1989 (%)
Year householder moved into unit - Moved in 1980 to 1989 (%) - White
Year householder moved into unit - Moved in 1980 to 1989 (%) - Black or African American
Year householder moved into unit - Moved in 1980 to 1989 (%) - Asian
Year householder moved into unit - Moved in 1980 to 1989 (%) - Hispanic or Latino
Year householder moved into unit - Moved in 1980 to 1989 (%) - American Indian and Alaska Native
Year householder moved into unit - Moved in 1980 to 1989 (%) - Multirace
Year householder moved into unit - Moved in 1980 to 1989 (%) - Other Race
Year householder moved into unit - Moved in 1970 to 1979 (%)
Year householder moved into unit - Moved in 1970 to 1979 (%) - White
Year householder moved into unit - Moved in 1970 to 1979 (%) - Black or African American
Year householder moved into unit - Moved in 1970 to 1979 (%) - Asian
Year householder moved into unit - Moved in 1970 to 1979 (%) - Hispanic or Latino
Year householder moved into unit - Moved in 1970 to 1979 (%) - American Indian and Alaska Native
Year householder moved into unit - Moved in 1970 to 1979 (%) - Multirace
Year householder moved into unit - Moved in 1970 to 1979 (%) - Other Race
Year householder moved into unit - Moved in 1969 or earlier (%)
Year householder moved into unit - Moved in 1969 or earlier (%) - White
Year householder moved into unit - Moved in 1969 or earlier (%) - Black or African American
Year householder moved into unit - Moved in 1969 or earlier (%) - Asian
Year householder moved into unit - Moved in 1969 or earlier (%) - Hispanic or Latino
Year householder moved into unit - Moved in 1969 or earlier (%) - American Indian and Alaska Native
Year householder moved into unit - Moved in 1969 or earlier (%) - Multirace
Year householder moved into unit - Moved in 1969 or earlier (%) - Other Race
Housing units lacking complete plumbing facilities (%)
Housing units lacking complete kitchen facilities (%)
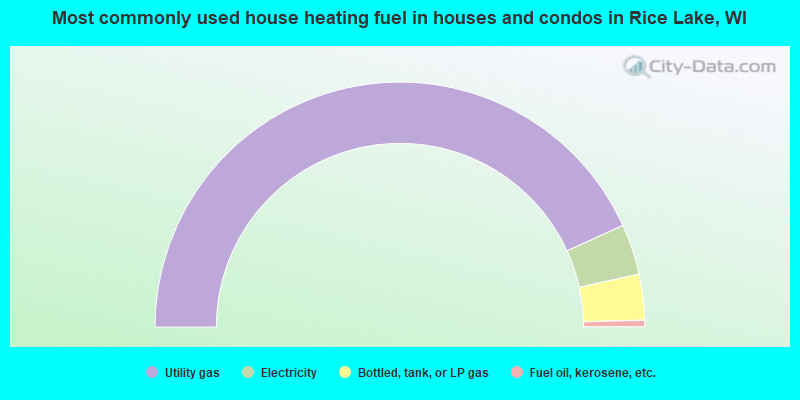
House heating fuel used in houses and condos - Utility gas (%)
House heating fuel used in houses and condos - Bottled, tank, or LP gas (%)
House heating fuel used in houses and condos - Electricity (%)
House heating fuel used in houses and condos - Fuel oil, kerosene, etc. (%)
House heating fuel used in houses and condos - Coal or coke (%)
House heating fuel used in houses and condos - Wood (%)
House heating fuel used in houses and condos - Solar energy (%)
House heating fuel used in houses and condos - Other fuel (%)
House heating fuel used in houses and condos - No fuel used (%)
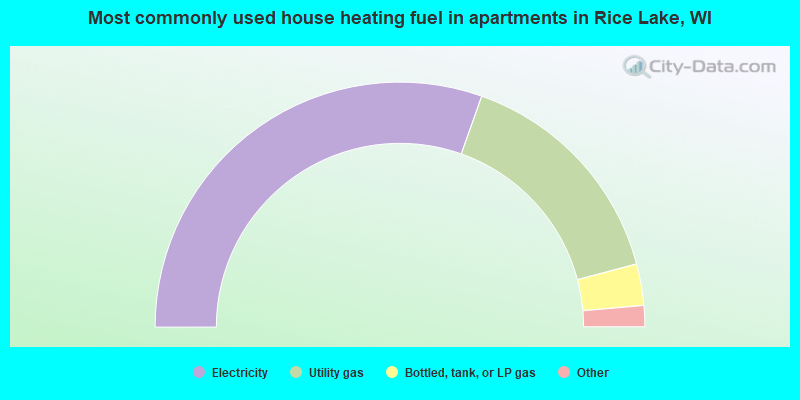
House heating fuel used in apartments - Utility gas (%)
House heating fuel used in apartments - Bottled, tank, or LP gas (%)
House heating fuel used in apartments - Electricity (%)
House heating fuel used in apartments - Fuel oil, kerosene, etc. (%)
House heating fuel used in apartments - Coal or coke (%)
House heating fuel used in apartments - Wood (%)
House heating fuel used in apartments - Solar energy (%)
House heating fuel used in apartments - Other fuel (%)
House heating fuel used in apartments - No fuel used (%)
Median year house/condo built: 1970Median year apartment built: 1981Household type by relationship:
Households: 9,005
Male householders: 1,537 (583 living alone ), Female householders: 2,306 (907 living alone )1,319 spouses (1,319 opposite-sex spouses ), 311 unmarried partners , (311 opposite-sex unmarried partners ), 2,382 children (2,309 natural , 73 adopted , 0 stepchildren ), 36 grandchildren , 92 brothers or sisters , 21 parents , 19 foster children , 77 other relatives , 598 non-relatives In group quarters: 305
Size of family households: 1,054 2-persons , 465 3-persons , 309 4-persons , 76 5-persons , 95 6-persons , 65 7-or-more-persons .
Size of nonfamily households: 1,538 1-person , 279 2-persons , 18 3-persons , 19 4-persons , 24 5-persons .
945 married couples with children. single-parent households (143 men , 913 women ).
97.0% of residents of Rice Lake speak English at home. of residents speak Spanish at home (94% speak English very well , 6% speak English well ).of residents speak other Indo-European language at home (100% speak English very well ).of residents speak Asian or Pacific Island language at home (100% speak English well ).of residents speak other language at home (100% speak English very well ).
Foreign born population: 282 (3.1%)of them are naturalized citizens )
Median number of rooms in houses and condos:
Median number of rooms in apartments
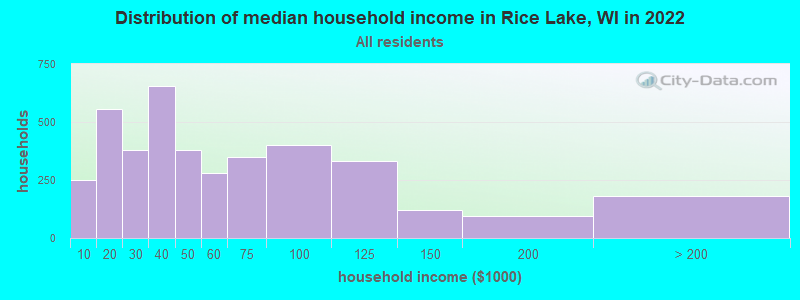
Rice Lake, WI household income distribution 250 Less than $10,000556 $10,000 to $19,999379 $20,000 to $29,999654 $30,000 to $39,999379 $40,000 to $49,999279 $50,000 to $59,999349 $60,000 to $74,999400 $75,000 to $99,999333 $100,000 to $124,999120 $125,000 to $149,99996 $150,000 to $199,999181 $200,000 or more
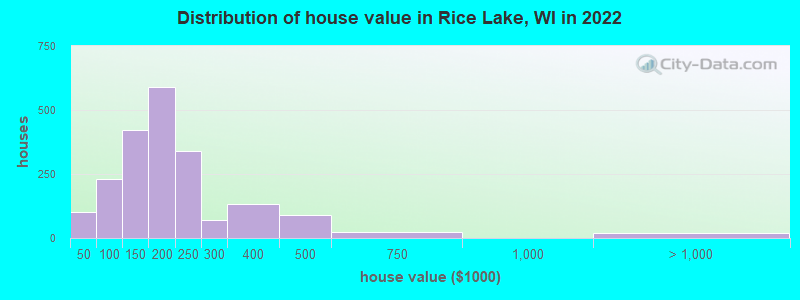
Home value of owner - occupied houses in 2022 in Rice Lake, WI 82 Less than $10,00011 $10,000 to $14,9998 $40,000 to $49,99928 $50,000 to $59,99953 $60,000 to $69,99945 $70,000 to $79,99948 $80,000 to $89,99945 $90,000 to $99,999232 $100,000 to $124,999189 $125,000 to $149,999441 $150,000 to $174,999148 $175,000 to $199,999340 $200,000 to $249,99971 $250,000 to $299,999131 $300,000 to $399,99987 $400,000 to $499,99924 $500,000 to $749,99920 $2,000,000 or moreRent paid by renters in 2022 in Rice Lake, WI 120 $250 to $29947 $300 to $34994 $350 to $399139 $400 to $44994 $450 to $49954 $500 to $54965 $550 to $599216 $600 to $649348 $650 to $69944 $700 to $74932 $750 to $799286 $800 to $89983 $900 to $99940 $1,000 to $1,24959 $1,250 to $1,49987 $1,500 to $1,999
Percentage of workers working in this county: 90.2%Number of people working at home: 277 (6.9% of all workers )
Travel time to work (commute)
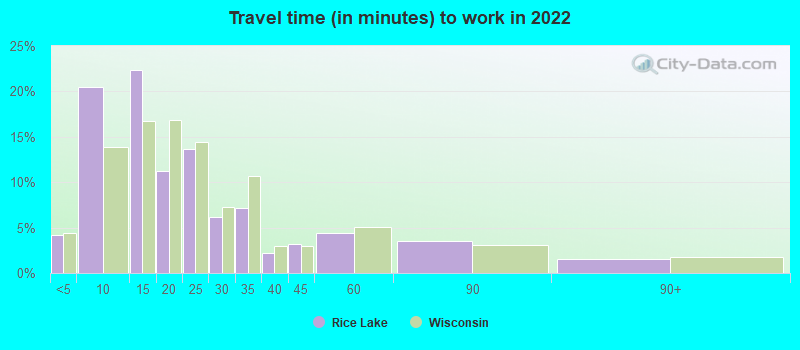
Less than 5 minutes: 3115 to 9 minutes: 1,57610 to 14 minutes: 72315 to 19 minutes: 30220 to 24 minutes: 21725 to 29 minutes: 17530 to 34 minutes: 17735 to 39 minutes: 2640 to 44 minutes: 10045 to 59 minutes: 2460 to 89 minutes: 6790 or more minutes: 0
Means of transportation to work:
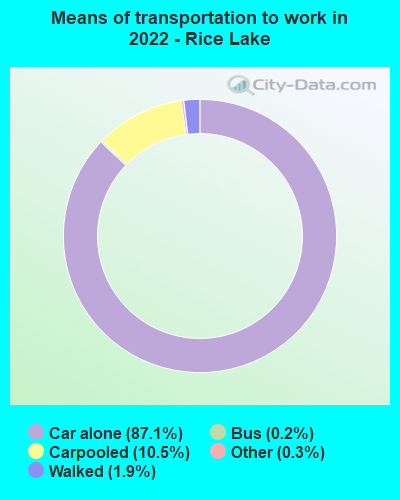
Drove a car alone: 6,564 (81.3%)Carpooled: 875 (10.8%)Bus : 10 (0.1%)Taxi: 29 (0.4%)Bicycle: 1 (0.0%)Walked: 144 (1.8%)Worked at home: 277 (3.4%)
Unemployment by race in 2022
Unemployment rate for White non-Hispanic residents 4.4% Males4.6% FemalesUnemployment rate for Asian residents 35.3% Females
Year of entry for the foreign-born population in Rice Lake, Wisconsin
108 2010 or later 79 2000 to 2009 47 1990 to 1999 6 1980 to 1989 6 1970 to 1979 38 Before 1970
First ancestries reported:
German: 1,083 (32.9%)
Norwegian: 383 (11.6%)
American: 169 (5.1%)
French: 151 (4.6%)
English: 136 (4.1%)
Italian: 98 (3.0%)
Czech: 83 (2.5%)
European: 83 (2.5%)
Irish: 76 (2.3%)
Swedish: 74 (2.2%)
French Canadian: 69 (2.1%)
Croatian: 58 (1.8%)
Scandinavian: 55 (1.7%)
Dutch: 53 (1.6%)
Polish: 50 (1.5%)
Austrian: 36 (1.1%)
Scottish: 31 (0.9%)
Danish: 21 (0.6%)
Slovak: 21 (0.6%)
Arab: 11 (0.3%)
Ukrainian: 9 (0.3%)
Scotch-Irish: 6 (0.2%)
Yugoslavian: 5 (0.2%) Most common places of birth for foreign-born residents (%): Korea Rice Lake:
27.0% (76)Wisconsin:
1.8% (5,320)
Mexico Rice Lake:
23.0% (65)Wisconsin:
29.5% (87,182)
Germany Rice Lake:
14.2% (40)Wisconsin:
3.0% (8,773)
Brazil Rice Lake:
10.6% (30)Wisconsin:
0.7% (2,101)
Kuwait Rice Lake:
9.6% (27)Wisconsin:
0.2% (500)
Scotland Rice Lake:
8.2% (23)Wisconsin:
0.2% (702)
Canada Rice Lake:
5.0% (14)Wisconsin:
2.3% (6,747)
Thailand Rice Lake:
2.5% (7)Wisconsin:
3.3% (9,655)
Argentina Rice Lake:
2.1% (6)Wisconsin:
0.5% (1,622)
Place of birth for U.S.-born residents:
This state: 6,564Other state: 2,124Northeast: 76Midwest: 1,372South: 275West: 408 89.9% of Rice Lake residents lived in the same house 1 years ago.
Out of people who lived in different houses, 27.2% lived in this county.
Out of people who lived in different counties, 72.2% lived in Wisconsin.
Rice Lake:
89.9%State average:
87.7%
Education attainment for males 25 years and older:
No schooling: 1Nursery to 4th grade: 115th and 6th grade: 07th and 8th grade: 509th grade: 010th grade: 6211th grade: 3912th grade, no diploma: 89High school graduate (or equivalency): 968Less than 1 year of college: 202Some college more than 1 year, no degree: 359Associate degree: 328Bachelor's degree: 405Master's degree: 120Professional school degree: 75Doctorate degree: 31
Education attainment for females 25 years and older:
No schooling: 1Nursery to 4th grade: 05th and 6th grade: 07th and 8th grade: 409th grade: 2010th grade: 3311th grade: 2812th grade, no diploma: 46High school graduate (or equivalency): 1,242Less than 1 year of college: 286Some college more than 1 year, no degree: 365Associate degree: 454Bachelor's degree: 500Master's degree: 131Professional school degree: 47Doctorate degree: 110
Housing units in structures:
One, detached: 2,352One, attached: 176Two: 3263 or 4: 3485 to 9: 27510 to 19: 30420 to 49: 19050 or more: 164Mobile homes: 75Median worth of mobile homes: $12,440
Housing units lacking complete kitchen facilities in 2022: 0.4%House/condo owner moved in on average 10 years ago
Renter moved in on average 4 years ago
Private vs. public school enrollment:
Students in private schools in grades 1 to 8 (elementary and middle school): 111 Here:
10.8%Wisconsin:
16.7%
Students in private schools in grades 9 to 12 (high school): 28 Students in private undergraduate colleges: 79 Here:
18.8%Wisconsin:
17.5%