Reservation, AZ (Arizona) Houses and Residents
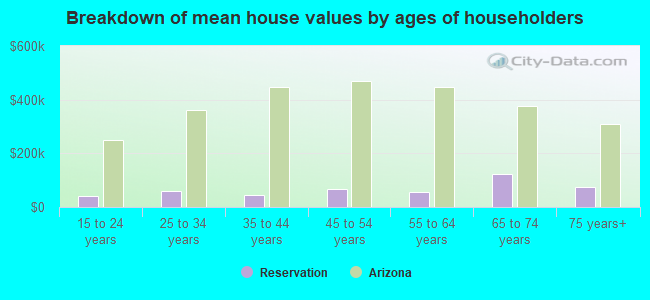
| Reservation: | $62,827 |
| Arizona: | $402,800 |
Total population: 6,405 (Urban population: 3,427 (all inside urban clusters), Rural population: 2,825 (all nonfarm))
Houses: 1,791 (1,557 occupied: 1,118 owner occupied, 439 renter occupied)
| % of renters here: | 28% |
| State: | 33% |
Housing density: 1 houses/condos per square mile
Median price asked for vacant for-sale houses and condos in 2022 in this county: $215,268.
Median contract rent in 2022: $330 (lower quartile is $223, upper quartile is $766)
Median rent asked for vacant for-rent units in 2022: $898
Median gross rent in Reservation, AZ in 2022: $525
Housing units in Reservation with a mortgage: 154 (0 second mortgage, 0 home equity loan, 0 both second mortgage and home equity loan)
Houses without a mortgage: 705


Household type by relationship:
Households: 52,680- In family households: 43,431 (10,190 male householders, 4,104 female householders)
10,694 spouses, 12,418 children (11,161 natural, 413 adopted, 844 stepchildren), 2,456 grandchildren, 502 brothers or sisters, 426 parents, foster children, 777 other relatives, 1,468 non-relatives
- In nonfamily households: 9,249 (3,857 male householders (3,136 living alone)), 3,849 female householders (3,303 living alone)), 1,543 nonrelatives
- In group quarters: 917 (774 institutionalized population)
7,562 married couples with children.
3,220 single-parent households (771 men, 2,449 women).
48.1% of residents of Reservation speak English at home.
0.4% of residents speak Spanish at home (100% speak English very well).
0.2% of residents speak other Indo-European language at home (40% speak English very well, 60% speak English not well).
0.2% of residents speak Asian or Pacific Island language at home (100% speak English very well).
51.2% of residents speak other language at home (60% speak English very well, 33% speak English well, 6% speak English not well).
Foreign born population: 29 (0.3%)
(0.0% of them are naturalized citizens)
| Here: | 4.7 |
| State: | 6.0 |
| Here: | 3.8 |
| State: | 4.1 |
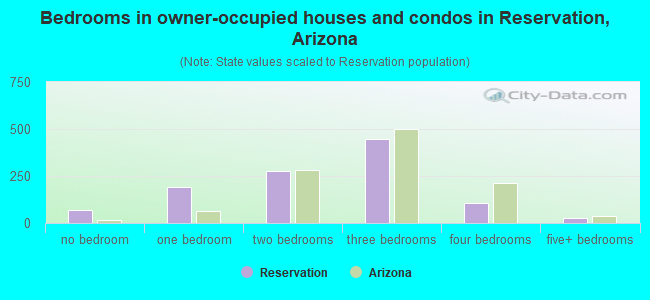
- Bedrooms in owner-occupied houses and condos in Reservation, Arizona
- 71no bedroom
- 1941 bedroom
- 2742 bedrooms
- 4453 bedrooms
- 1074 bedrooms
- 275+ bedrooms
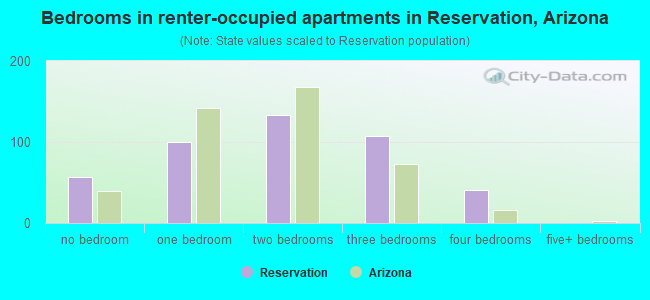
- Bedrooms in renter-occupied apartments in Reservation, Arizona
- 57no bedroom
- 1001 bedroom
- 1332 bedrooms
- 1083 bedrooms
- 414 bedrooms
- 05+ bedrooms
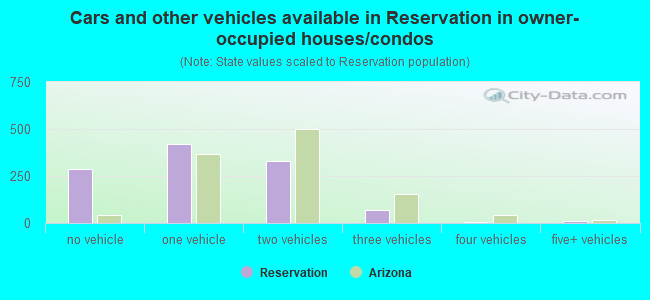
- Cars and other vehicles available in Reservation in owner-occupied houses/condos
- 287no vehicle
- 4181 vehicle
- 3282 vehicles
- 693 vehicles
- 74 vehicles
- 95+ vehicles
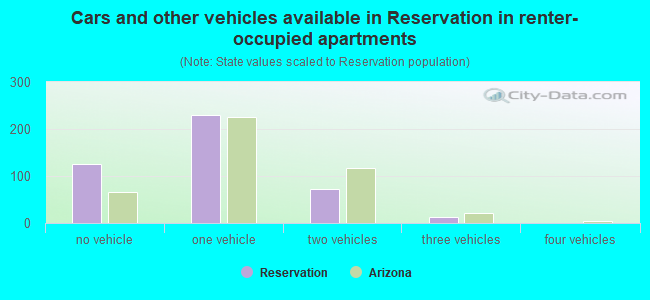
- Cars and other vehicles available in Reservation in renter-occupied apartments
- 125no vehicle
- 2301 vehicle
- 722 vehicles
- 123 vehicles
- 04 vehicles
- 05+ vehicles
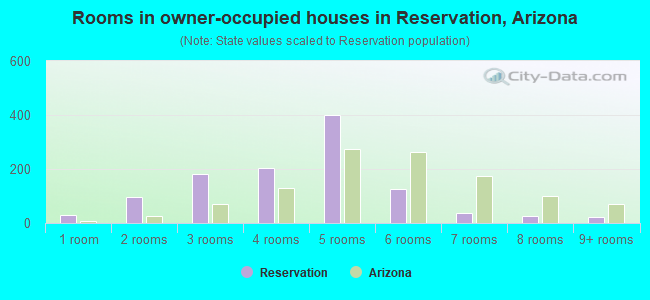
- Rooms in owner-occupied houses in Reservation, Arizona
- 281 room
- 972 rooms
- 1803 rooms
- 2044 rooms
- 4005 rooms
- 1266 rooms
- 377 rooms
- 258 rooms
- 219+ rooms
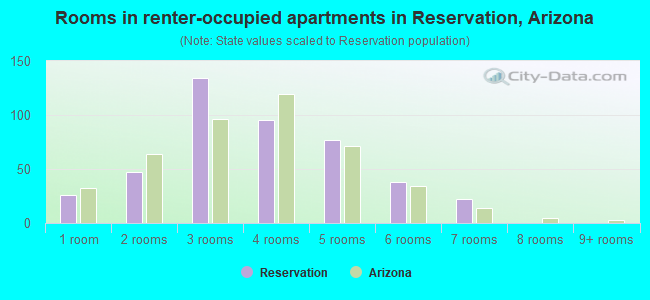
- Rooms in renter-occupied apartments in Reservation, Arizona
- 261 room
- 472 rooms
- 1343 rooms
- 954 rooms
- 775 rooms
- 386 rooms
- 227 rooms
- 08 rooms
- 09+ rooms
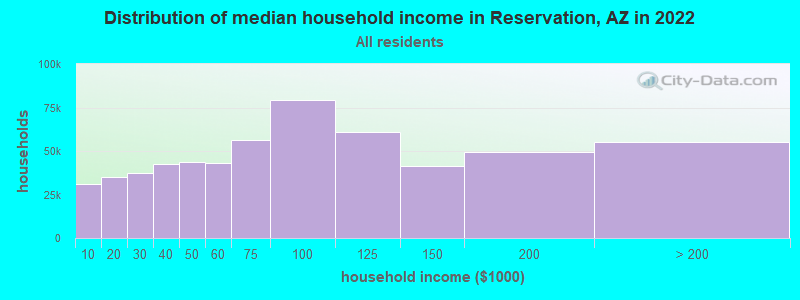
Reservation, AZ household income distribution

- 30,912Less than $10,000
- 34,903$10,000 to $19,999
- 37,321$20,000 to $29,999
- 42,521$30,000 to $39,999
- 43,123$40,000 to $49,999
- 43,073$50,000 to $59,999
- 56,183$60,000 to $74,999
- 78,645$75,000 to $99,999
- 60,467$100,000 to $124,999
- 40,954$125,000 to $149,999
- 49,012$150,000 to $199,999
- 54,827$200,000 or more
Percentage of workers working in this county: 67.2%
Number of people working at home: 275 (17.5% of all workers)
Travel time to work (commute)
- Less than 5 minutes: 88
- 5 to 9 minutes: 204
- 10 to 14 minutes: 183
- 15 to 19 minutes: 195
- 20 to 24 minutes: 72
- 25 to 29 minutes: 28
- 30 to 34 minutes: 219
- 35 to 39 minutes: 9
- 40 to 44 minutes: 0
- 45 to 59 minutes: 34
- 60 to 89 minutes: 19
- 90 or more minutes: 39
Means of transportation to work:
- Drove a car alone: 657 (60.3%)
- Carpooled: 298 (27.3%)
- Bus or trolley bus: 16 (1.5%)
- Walked: 90 (8.3%)
- Other means: 29 (2.7%)
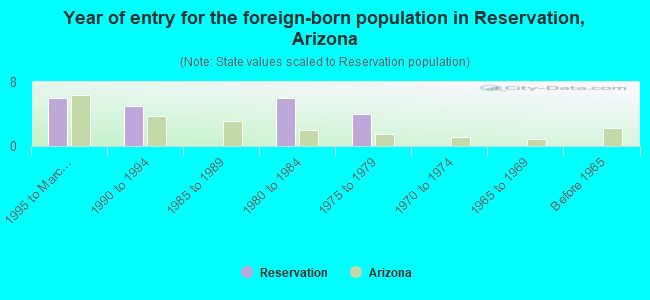
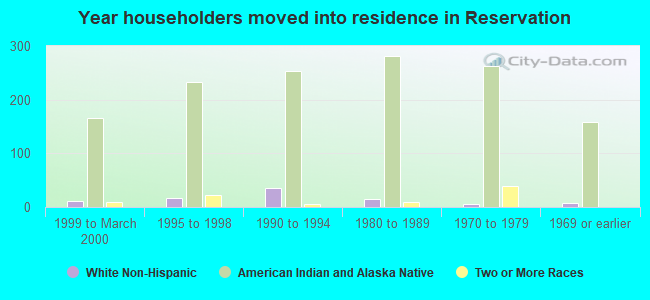
- Year of entry for the foreign-born population in Reservation, Arizona
- 61995 to March 2000
- 51990 to 1994
- 01985 to 1989
- 61980 to 1984
- 41975 to 1979
- 01970 to 1974
- 01965 to 1969
- 0Before 1965
Most common places of birth for foreign-born residents (%):
| Reservation: | 52.4% (11) |
| Arizona: | 1.4% (9,134) |
| Reservation: | 47.6% (10) |
| Arizona: | 0.1% (781) |
Place of birth for U.S.-born residents:
- This state: 5,746
- Other state: 485
- Northeast: 19
- Midwest: 90
- South: 82
- West: 294
76% of Reservation residents lived in the same house 5 years ago.
Out of people who lived in different houses, 45% lived in this county.
Out of people who lived in different counties, 81% lived in Arizona.
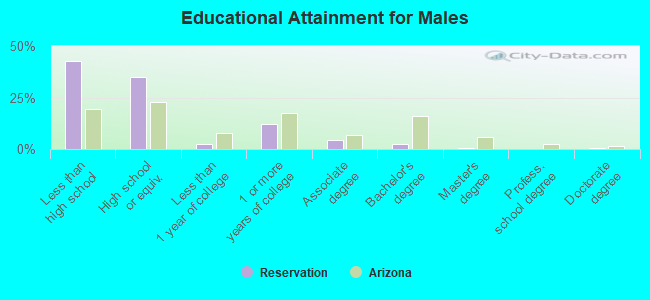
Education attainment for males 25 years and older:
- No schooling: 19
- Nursery to 4th grade: 22
- 5th and 6th grade: 34
- 7th and 8th grade: 95
- 9th grade: 40
- 10th grade: 145
- 11th grade: 155
- 12th grade, no diploma: 131
- High school graduate (or equivalency): 525
- Less than 1 year of college: 40
- Some college more than 1 year, no degree: 181
- Associate degree: 65
- Bachelor's degree: 33
- Master's degree: 7
- Professional school degree: 0
- Doctorate degree: 9
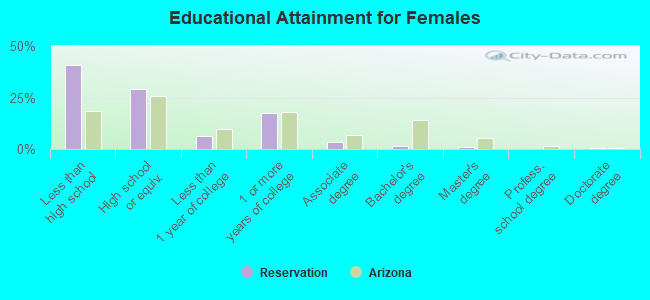
Education attainment for females 25 years and older:
- No schooling: 4
- Nursery to 4th grade: 7
- 5th and 6th grade: 32
- 7th and 8th grade: 81
- 9th grade: 116
- 10th grade: 129
- 11th grade: 201
- 12th grade, no diploma: 79
- High school graduate (or equivalency): 462
- Less than 1 year of college: 102
- Some college more than 1 year, no degree: 278
- Associate degree: 53
- Bachelor's degree: 20
- Master's degree: 17
- Professional school degree: 0
- Doctorate degree: 6
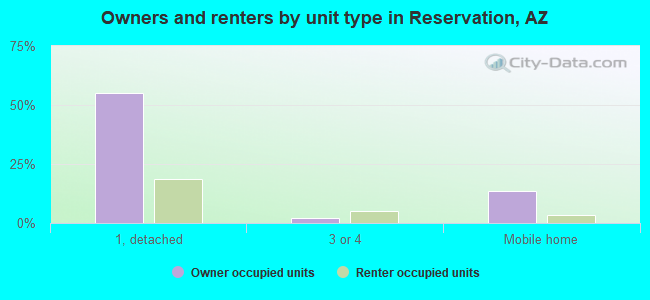
Housing units in structures:
- One, detached: 1,234
- One, attached: 7
- Two: 14
- 3 or 4: 135
- 5 to 9: 6
- Mobile homes: 389
- Boats, RVs, vans, etc.: 6
Median worth of mobile homes: $30,677
Housing units lacking complete kitchen facilities: 11.5%
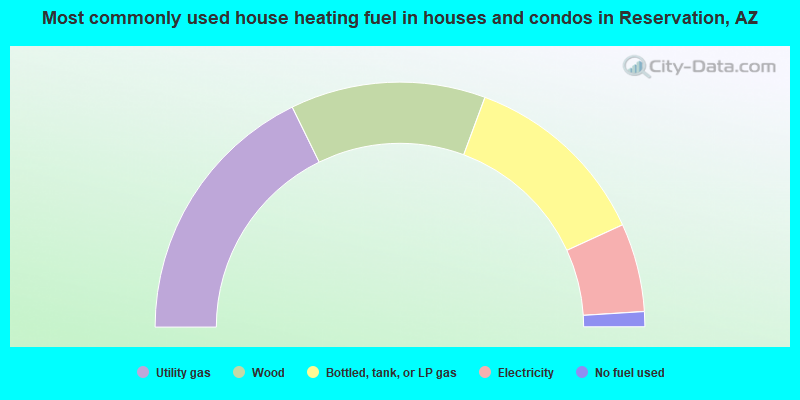
- 35.5%Utility gas
- 25.8%Wood
- 25.0%Bottled, tank, or LP gas
- 11.7%Electricity
- 2.0%No fuel used
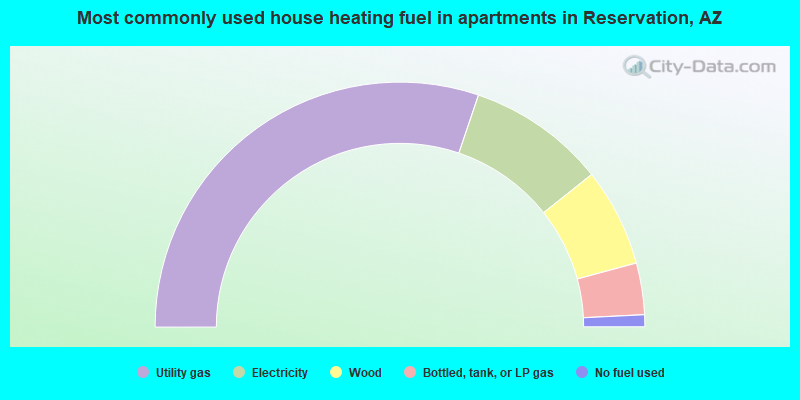
- 60.4%Utility gas
- 18.2%Electricity
- 13.0%Wood
- 6.8%Bottled, tank, or LP gas
- 1.6%No fuel used
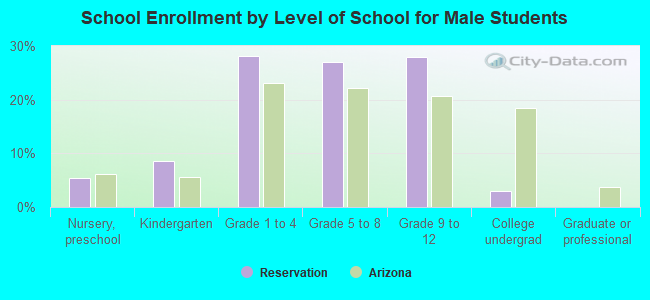
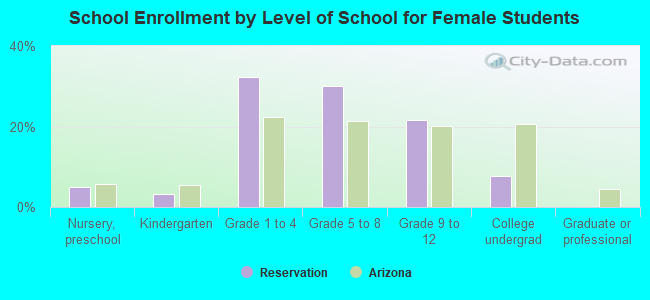
Private vs. public school enrollment:
| Here: | 4.9% |
| Arizona: | 6.1% |
| Here: | 8.4% |
| Arizona: | 6.1% |
| Here: | 6.1% |
| Arizona: | 13.2% |