Housing density: 4,877 houses/condos per square mile
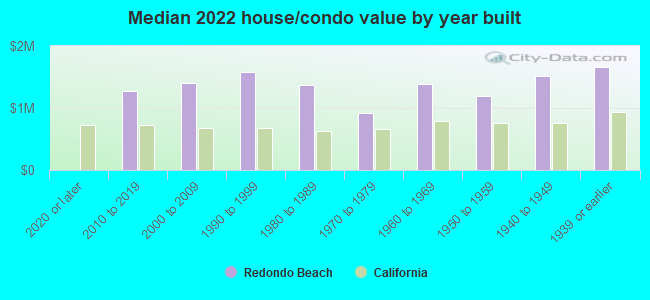
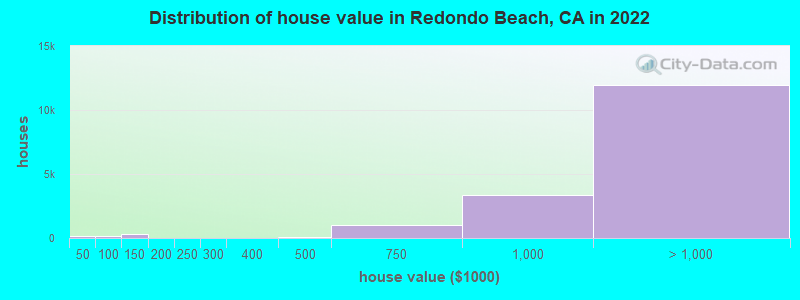
Median price asked for vacant for-sale houses and condos in 2022: $1,232,196.
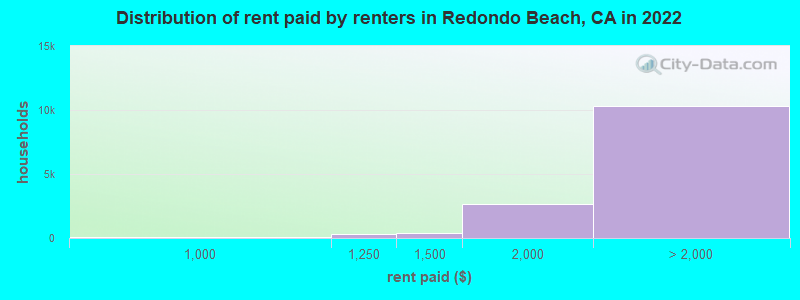
Median contract rent in 2022: over $2,000 (lower quartile is over $2,000, upper quartile is over $2,000)
Median rent asked for vacant for-rent units in 2022: $2,850
Median gross rent in Redondo Beach, CA in 2022: over $2,000
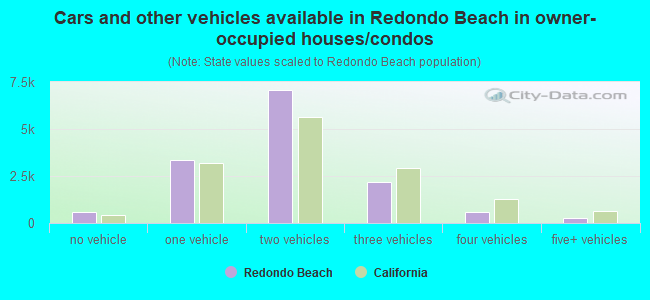
Housing units in Redondo Beach with a mortgage: 10,953 (1,058 second mortgage, 13 home equity loan, 967 both second mortgage and home equity loan) Houses without a mortgage: 149
Median household income for houses/condos with a mortgage: $188,496
Median household income for apartments without a mortgage: $128,559
Median monthly housing costs: $2,676
Compare current foreclosures in Redondo Beach, CA:
13,165 married couples with children.
2,847 single-parent households (801 men, 2,046 women).
75.4% of residents of Redondo Beach speak English at home.
8.8% of residents speak Spanish at home (76% speak English very well, 16% speak English well, 8% speak English not well, 1% don't speak English at all).
7.2% of residents speak other Indo-European language at home (79% speak English very well, 16% speak English well, 4% speak English not well, 1% don't speak English at all).
8.1% of residents speak Asian or Pacific Island language at home (59% speak English very well, 32% speak English well, 7% speak English not well, 2% don't speak English at all).
1.3% of residents speak other language at home (87% speak English very well, 9% speak English well, 4% speak English not well).
Foreign born population: 12,272 (17.8%)
(73.2% of them are naturalized citizens)
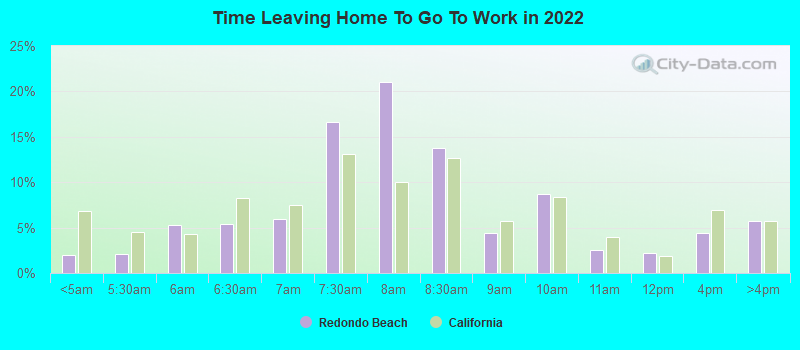
Percentage of workers working in this county: 96.6% Number of people working at home: 11,375 (30.3% of all workers)
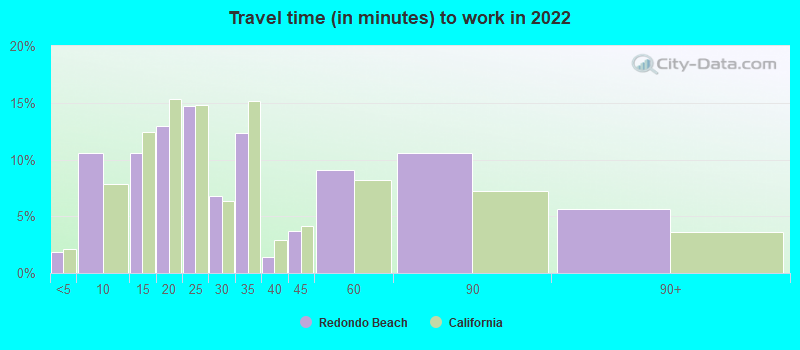
Travel time to work (commute)
Less than 5 minutes: 130
5 to 9 minutes: 1,850
10 to 14 minutes: 3,189
15 to 19 minutes: 4,301
20 to 24 minutes: 3,317
25 to 29 minutes: 1,109
30 to 34 minutes: 2,034
35 to 39 minutes: 617
40 to 44 minutes: 196
45 to 59 minutes: 2,305
60 to 89 minutes: 1,934
90 or more minutes: 527
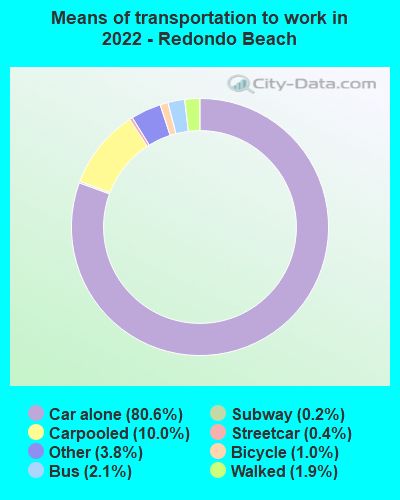
Means of transportation to work:
Drove a car alone: 20,712 (57.7%)
Carpooled: 2,847 (7.9%)
Bus: 499 (1.4%)
Subway or elevated rail: 75 (0.2%)
Long-distance train or commuter rail: 24 (0.1%)
Taxi: 1,069 (3.0%)
Bicycle: 261 (0.7%)
Walked: 524 (1.5%)
Worked at home: 11,375 (31.7%)
Unemployment by race in 2022
Unemployment rate for White non-Hispanic residents
2.7%Males
1.8%Females
Unemployment rate for Black residents
6.5%Males
5.8%Females
Unemployment rate for Asian residents
1.2%Males
1.9%Females
Unemployment rate for other race residents
3.2%Males
1.5%Females
Unemployment rate for two or more race residents
8.8%Males
5.8%Females
Unemployment rate for Hispanic or Latino residents
4.6%Males
4.1%Females
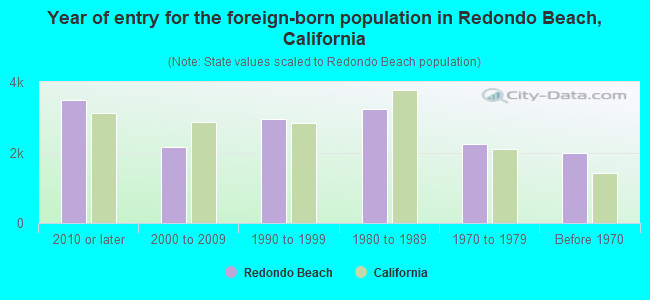
Year of entry for the foreign-born population in Redondo Beach, California
3,5002010 or later
2,1632000 to 2009
2,9501990 to 1999
3,2361980 to 1989
2,2521970 to 1979
1,973Before 1970
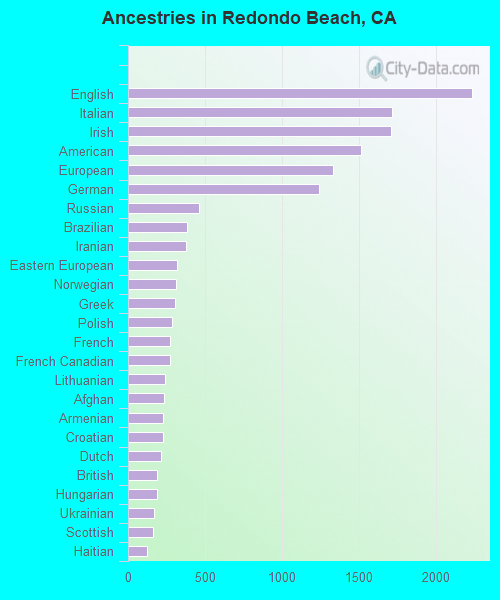
First ancestries reported:
English: 2,233 (6.5%)
Italian: 1,713 (5.0%)
Irish: 1,709 (5.0%)
American: 1,512 (4.4%)
European: 1,332 (3.9%)
German: 1,241 (3.6%)
Russian: 461 (1.4%)
Brazilian: 384 (1.1%)
Iranian: 376 (1.1%)
Eastern European: 318 (0.9%)
Norwegian: 309 (0.9%)
Greek: 307 (0.9%)
Polish: 285 (0.8%)
French: 273 (0.8%)
French Canadian: 273 (0.8%)
Lithuanian: 238 (0.7%)
Afghan: 235 (0.7%)
Armenian: 230 (0.7%)
Croatian: 228 (0.7%)
Dutch: 216 (0.6%)
British: 191 (0.6%)
Hungarian: 188 (0.6%)
Ukrainian: 168 (0.5%)
Scottish: 161 (0.5%)
Haitian: 125 (0.4%)
Palestinian: 111 (0.3%)
Swedish: 110 (0.3%)
Israeli: 106 (0.3%)
Swiss: 103 (0.3%)
Finnish: 97 (0.3%)
Albanian: 89 (0.3%)
Romanian: 83 (0.2%)
Arab: 80 (0.2%)
Nigerian: 79 (0.2%)
Lebanese: 74 (0.2%)
Egyptian: 73 (0.2%)
Czech: 58 (0.2%)
Scotch-Irish: 57 (0.2%)
Turkish: 57 (0.2%)
Portuguese: 56 (0.2%)
Danish: 49 (0.1%)
Syrian: 49 (0.1%)
Canadian: 45 (0.1%)
Welsh: 45 (0.1%)
Belgian: 39 (0.1%)
Serbian: 38 (0.1%)
Czechoslovakian: 35 (0.1%)
Northern European: 32 (0.09%)
Yugoslavian: 27 (0.08%)
South African: 22 (0.06%)
Belizean: 17 (0.05%)
Slavic: 16 (0.05%)
African: 16 (0.05%)
Scandinavian: 12 (0.04%)
Australian: 10 (0.03%)
West Indian: 10 (0.03%)
Jordanian: 9 (0.03%)
Latvian: 6 (0.02%)
Bulgarian: 6 (0.02%)
Austrian: 6 (0.02%)
Moroccan: 2 (0.01%)
Most common places of birth for foreign-born residents (%):
Mexico
Redondo Beach:
7.4% (1,017)
California:
37.2% (3,881,193)
Philippines
Redondo Beach:
6.0% (831)
California:
7.8% (818,297)
India
Redondo Beach:
5.8% (803)
California:
5.2% (539,184)
Japan
Redondo Beach:
5.8% (796)
California:
1.0% (103,575)
Korea
Redondo Beach:
5.6% (771)
California:
3.0% (315,248)
Canada
Redondo Beach:
5.0% (687)
California:
1.2% (127,477)
China, excluding Hong Kong and Taiwan
Redondo Beach:
3.6% (489)
California:
6.6% (684,672)
England
Redondo Beach:
3.4% (465)
California:
0.6% (57,953)
Iran
Redondo Beach:
2.9% (394)
California:
2.0% (206,004)
Taiwan
Redondo Beach:
2.8% (387)
California:
1.7% (176,274)
Russia
Redondo Beach:
2.8% (386)
California:
0.7% (71,932)
El Salvador
Redondo Beach:
2.3% (317)
California:
4.2% (440,287)
United Kingdom, excluding England and Scotland
Redondo Beach:
2.2% (307)
California:
0.6% (60,582)
Argentina
Redondo Beach:
2.2% (306)
California:
0.3% (33,960)
Brazil
Redondo Beach:
2.2% (296)
California:
0.5% (53,222)
Cuba
Redondo Beach:
2.0% (280)
California:
0.3% (30,441)
Vietnam
Redondo Beach:
1.8% (249)
California:
4.9% (512,335)
Germany
Redondo Beach:
1.7% (227)
California:
0.7% (73,304)
Peru
Redondo Beach:
1.6% (219)
California:
0.7% (74,025)
Ukraine
Redondo Beach:
1.6% (216)
California:
0.6% (60,761)
Haiti
Redondo Beach:
1.5% (207)
California:
0.1% (5,330)
Place of birth for U.S.-born residents:
This state: 35,405
Other state: 20,498
Northeast: 6,225
Midwest: 7,166
South: 3,622
West: 3,485
87.3% of Redondo Beach residents lived in the same house 1 years ago. Out of people who lived in different houses, 41.0% lived in this county. Out of people who lived in different counties, 42.5% lived in California.
Redondo Beach:
87.3%
State average:
88.9%
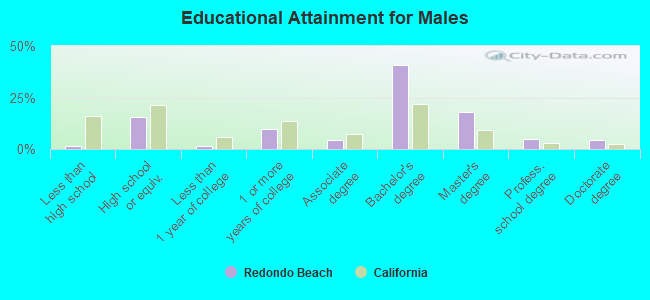
Education attainment for males 25 years and older:
No schooling: 202
Nursery to 4th grade: 46
5th and 6th grade: 0
7th and 8th grade: 63
9th grade: 0
10th grade: 0
11th grade: 0
12th grade, no diploma: 98
High school graduate (or equivalency): 3,776
Less than 1 year of college: 377
Some college more than 1 year, no degree: 2,356
Associate degree: 1,079
Bachelor's degree: 10,021
Master's degree: 4,372
Professional school degree: 1,170
Doctorate degree: 1,035
Education attainment for females 25 years and older:
No schooling: 228
Nursery to 4th grade: 43
5th and 6th grade: 43
7th and 8th grade: 0
9th grade: 50
10th grade: 0
11th grade: 0
12th grade, no diploma: 0
High school graduate (or equivalency): 2,260
Less than 1 year of college: 743
Some college more than 1 year, no degree: 2,284
Associate degree: 2,056
Bachelor's degree: 9,897
Master's degree: 5,299
Professional school degree: 1,020
Doctorate degree: 267
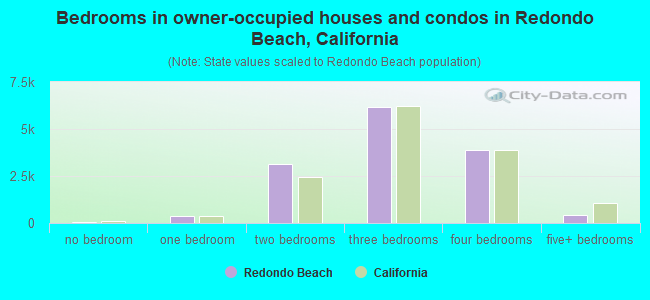
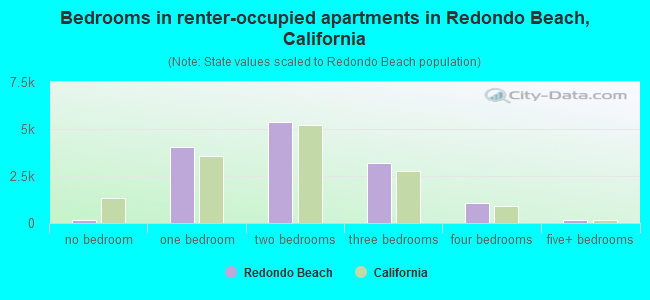
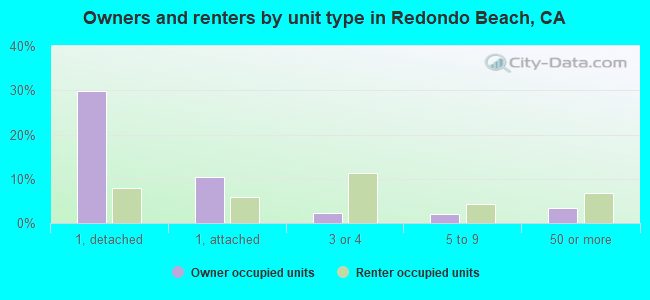
Housing units in structures:
One, detached: 11,501
One, attached: 4,721
Two: 824
3 or 4: 3,968
5 to 9: 2,114
10 to 19: 1,934
20 to 49: 2,221
50 or more: 3,369
Housing units lacking complete plumbing facilities in 2022: 0.5%
Housing units lacking complete kitchen facilities in 2022: 4.0%
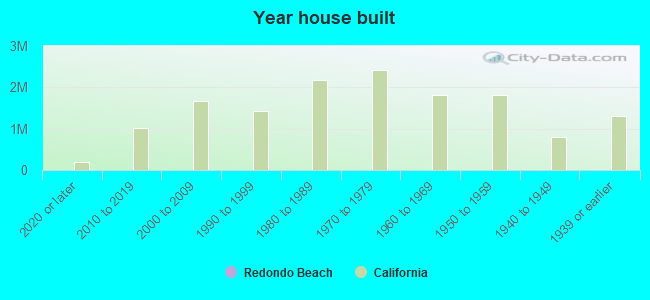
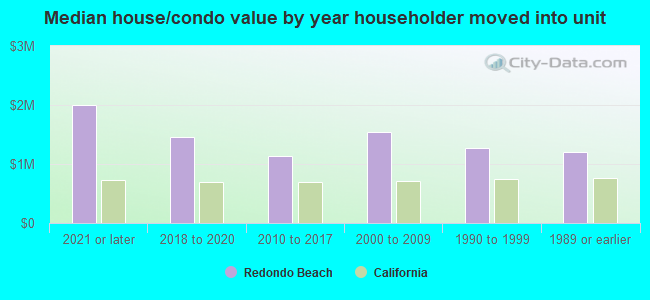
House/condo owner moved in on average 12 years ago