Redding, CA (California) Houses and Residents
| Redding: | $366,300 |
| California: | $715,900 |
Mean price in 2022:
Detached houses: $526,516
Here: $526,516 State: $988,808 Townhouses or other attached units: $481,004
Here: $481,004 State: $838,546 In 2-unit structures: $526,035
Here: $526,035 State: $1,138,100 In 3-to-4-unit structures: $583,605
Here: $583,605 State: $824,253 In 5-or-more-unit structures: $352,456
Here: $352,456 State: $730,996 Mobile homes: $105,018
Here: $105,018 State: $184,506 Occupied boats, RVs, vans, etc.: $6,933
Here: $6,933 State: $204,957
Total population: 91,593 (Urban population: 79,501, Rural population: 1,697 (all nonfarm))
Houses: 40,048 (36,525 occupied: 20,689 owner occupied, 15,836 renter occupied)
| % of renters here: | 43% |
| State: | 44% |
Housing density: 685 houses/condos per square mile
Median price asked for vacant for-sale houses and condos in 2022: $259,314.
Median contract rent in 2022: $933 (lower quartile is $729, upper quartile is $1,205)
Median rent asked for vacant for-rent units in 2022: $1,430
Median gross rent in Redding, CA in 2022: $1,172
Housing units in Redding with a mortgage: 13,298 (743 second mortgage, 0 home equity loan, 585 both second mortgage and home equity loan)
Houses without a mortgage: 306
Median household income for houses/condos with a mortgage: $105,867
Median household income for apartments without a mortgage: $63,963
Median monthly housing costs: $1,287
Compare current foreclosures in Redding, CA:
| Photo | Address | Area | Beds / Baths | Price | Details |
|---|---|---|---|---|---|

|
#1
Oasis Rd
Redding, CA 96003
|
1,233 sq. feet
|
2 baths 3 beds |
$109,900
|
show details |

|
#2
White River Ct
Redding, CA 96003
|
1,098 sq. feet
|
2 baths 3 beds |
show details | |

|
#3
Hartnell Ave
Redding, CA 96002
|
- sq. feet
|
1 baths 3 beds |
show details | |

|
#4
Fayette Ln
Redding, CA 96003
|
1,440 sq. feet
|
2 baths 3 beds |
show details | |

|
#5
Jessica Way
Redding, CA 96002
|
1,142 sq. feet
|
2 baths 3 beds |
show details | |

|
#6
Regal Ave
Redding, CA 96002
|
1,305 sq. feet
|
1 baths 3 beds |
show details | |

|
#7
Big Horn Dr
Redding, CA 96002
|
2,539 sq. feet
|
3 baths 4 beds |
show details | |

|
#8
Irwin Rd
Redding, CA 96002
|
1,135 sq. feet
|
2 baths 3 beds |
show details | |

|
#9
Jaxon Way
Redding, CA 96003
|
1,400 sq. feet
|
2 baths 3 beds |
show details | |

|
#10
Leonard Dr
Redding, CA 96001
|
1,550 sq. feet
|
2 baths 3 beds |
show details |
| Photo | Address | Area | Beds / Baths | Price | Details |
|---|---|---|---|---|---|

|
#11
Newport Dr
Redding, CA 96001
|
- sq. feet
|
2 baths 3 beds |
show details | |

|
#12
Memory Ln
Redding, CA 96001
|
- sq. feet
|
2 baths 3 beds |
show details | |

|
#13
Edgewood Dr
Redding, CA 96003
|
- sq. feet
|
2 baths 3 beds |
show details | |

|
#14
Capella St
Redding, CA 96002
|
- sq. feet
|
2 baths 3 beds |
show details | |

|
#15
Dennis Ct
Redding, CA 96001
|
- sq. feet
|
1 baths 2 beds |
show details | |

|
#16
Salmon Creek Rd
Redding, CA 96003
|
- sq. feet
|
2 baths 2 beds |
show details | |

|
#17
Canyon Rd
Redding, CA 96001
|
- sq. feet
|
2 baths 3 beds |
show details | |

|
#18
Alamine Dr
Redding, CA 96003
|
- sq. feet
|
2 baths 4 beds |
show details | |

|
#19
Rocking Horse Ln
Redding, CA 96003
|
- sq. feet
|
4 baths 6 beds |
show details | |

|
#20
Tanglewood Dr
Redding, CA 96003
|
- sq. feet
|
3 baths 3 beds |
show details |
| Photo | Address | Area | Beds / Baths | Price | Details |
|---|---|---|---|---|---|

|
#21
Wales Ct
Redding, CA 96003
|
- sq. feet
|
2 baths 3 beds |
show details | |

|
#22
Brittany Dr
Redding, CA 96002
|
- sq. feet
|
2 baths 3 beds |
show details | |

|
#23
California St
Redding, CA 96001
|
- sq. feet
|
2 baths 3 beds |
show details | |

|
#24
Lake Blvd
Redding, CA 96003
|
- sq. feet
|
1 baths 2 beds |
show details | |

|
#25
Riviera Dr
Redding, CA 96001
|
- sq. feet
|
2 baths 3 beds |
show details | |

|
#26
Doral Trl
Redding, CA 96003
|
- sq. feet
|
2 baths 2 beds |
show details | |

|
#27
Glendive Ln
Redding, CA 96001
|
- sq. feet
|
3 baths 3 beds |
show details | |

|
#28
Kiwi Ln
Redding, CA 96003
|
- sq. feet
|
3 baths 4 beds |
show details | |

|
#29
Del Mar Ave
Redding, CA 96003
|
- sq. feet
|
2 baths 2 beds |
show details | |

|
#30
Hawthorne Ave
Redding, CA 96002
|
- sq. feet
|
2 baths 3 beds |
show details |
| Photo | Address | Area | Beds / Baths | Price | Details |
|---|---|---|---|---|---|

|
#31
Snow Ln
Redding, CA 96003
|
- sq. feet
|
2 baths 3 beds |
show details | |

|
#32
South St
Redding, CA 96001
|
- sq. feet
|
1 baths 2 beds |
show details | |

|
#33
Bristol Dr
Redding, CA 96002
|
- sq. feet
|
2 baths 3 beds |
show details | |

|
#34
Sunwood Dr
Redding, CA 96002
|
- sq. feet
|
2 baths 4 beds |
show details | |

|
#35
Nicolet Ln
Redding, CA 96001
|
- sq. feet
|
1 baths 2 beds |
show details | |

|
#36
Canterbury Dr
Redding, CA 96002
|
- sq. feet
|
2 baths 4 beds |
show details | |

|
#37
Ridge Rd
Redding, CA 96003
|
- sq. feet
|
2 baths 3 beds |
show details | |

|
#38
N Bonnyview Rd
Redding, CA 96001
|
- sq. feet
|
2 baths 3 beds |
show details | |

|
#39
Tralee Ln
Redding, CA 96001
|
- sq. feet
|
2 baths 3 beds |
show details | |

|
#40
Spanish Bay Dr
Redding, CA 96003
|
- sq. feet
|
2 baths 3 beds |
show details |
| Photo | Address | Area | Beds / Baths | Price | Details |
|---|---|---|---|---|---|

|
#41
Riata Dr
Redding, CA 96002
|
- sq. feet
|
2 baths 4 beds |
show details | |

|
#42
Winding Way
Redding, CA 96003
|
- sq. feet
|
2 baths 3 beds |
show details | |

|
#43
Regal Ave
Redding, CA 96002
|
- sq. feet
|
1 baths 3 beds |
show details | |

|
#44
Branstetter Ln
Redding, CA 96001
|
- sq. feet
|
2 baths 3 beds |
show details | |

|
#45
Merle Dr
Redding, CA 96001
|
- sq. feet
|
2 baths 3 beds |
show details | |

|
#46
Vandiver Ln
Redding, CA 96001
|
- sq. feet
|
1 baths 2 beds |
show details | |

|
#47
Hobbie Acres Dr
Redding, CA 96003
|
- sq. feet
|
2 baths 3 beds |
show details | |

|
#48
Lookout Ct
Redding, CA 96001
|
- sq. feet
|
2 baths 3 beds |
show details | |

|
#49
Mallard St
Redding, CA 96003
|
- sq. feet
|
2 baths 3 beds |
show details | |

|
Check over 1 million property listings on Foreclosure.com!
|
browse all offers | |||

Latest news about housing in Redding, CA collected exclusively by city-data.com from local newspapers, TV, and radio stations

 | Houses in Redding,Chico,Yuba city, sacramento suburbs , vacaville ,red bluff (2 replies) |
| California homelessness? (451 replies) |
| Would Redding be a better alternative to Phoenix and Las Vegas? (70 replies) |
| CA Cities(Pop 65,000+) by Median Household Income, 2019 (8 replies) |
| Why is housing so much cheaper in Redding? (51 replies) |
| Redding real estate market now (13 replies) |

Median year apartment built: 1984
Household type by relationship:
Households: 92,896- Male householders: 16,456 (5,530 living alone), Female householders: 20,069 (6,593 living alone)
14,811 spouses (14,621 opposite-sex spouses), 3,544 unmarried partners, (3,503 opposite-sex unmarried partners), 26,999 children (24,692 natural, 479 adopted, 1,828 stepchildren), 923 grandchildren, 335 brothers or sisters, 1,226 parents, 0 foster children, 1,180 other relatives, 4,240 non-relatives
- In group quarters: 3,113
Size of family households: 9,699 2-persons, 4,303 3-persons, 3,499 4-persons, 1,957 5-persons, 549 6-persons, 912 7-or-more-persons.
Size of nonfamily households: 12,123 1-person, 3,143 2-persons, 204 3-persons, 63 4-persons, 73 5-persons.
13,012 married couples with children.
7,278 single-parent households (1,750 men, 5,528 women).
90.6% of residents of Redding speak English at home.
3.9% of residents speak Spanish at home (77% speak English very well, 16% speak English well, 5% speak English not well, 2% don't speak English at all).
2.1% of residents speak other Indo-European language at home (72% speak English very well, 23% speak English well, 3% speak English not well, 1% don't speak English at all).
2.6% of residents speak Asian or Pacific Island language at home (58% speak English very well, 22% speak English well, 19% speak English not well, 1% don't speak English at all).
0.5% of residents speak other language at home (78% speak English very well, 22% speak English well).
Foreign born population: 5,139 (5.5%)
(49.9% of them are naturalized citizens)
| Here: | 5.9 |
| State: | 6.0 |
| Here: | 4.3 |
| State: | 3.9 |

- Bedrooms in owner-occupied houses and condos in Redding, California
- 121no bedroom
- 2581 bedroom
- 3,9892 bedrooms
- 11,8543 bedrooms
- 3,6444 bedrooms
- 8235+ bedrooms

- Bedrooms in renter-occupied apartments in Redding, California
- 1,264no bedroom
- 2,9841 bedroom
- 7,3422 bedrooms
- 3,1053 bedrooms
- 1,1274 bedrooms
- 145+ bedrooms

- Cars and other vehicles available in Redding in owner-occupied houses/condos
- 380no vehicle
- 5,9351 vehicle
- 7,7082 vehicles
- 4,3693 vehicles
- 1,2174 vehicles
- 1,0805+ vehicles

- Cars and other vehicles available in Redding in renter-occupied apartments
- 1,710no vehicle
- 7,7471 vehicle
- 4,6882 vehicles
- 1,3273 vehicles
- 3644 vehicles
- 05+ vehicles

- Rooms in owner-occupied houses in Redding, California
- 1211 room
- 2042 rooms
- 9253 rooms
- 1,6804 rooms
- 5,2825 rooms
- 5,4566 rooms
- 2,8837 rooms
- 2,5918 rooms
- 1,5479+ rooms

- Rooms in renter-occupied apartments in Redding, California
- 1,2641 room
- 9392 rooms
- 1,9233 rooms
- 4,9234 rooms
- 2,9995 rooms
- 2,1156 rooms
- 6027 rooms
- 8778 rooms
- 1949+ rooms


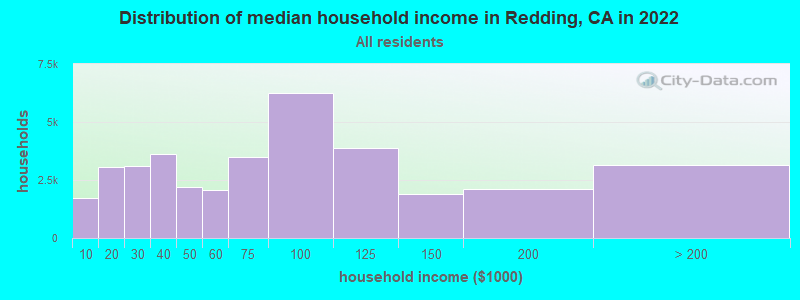
Redding, CA household income distribution

- 1,737Less than $10,000
- 3,051$10,000 to $19,999
- 3,120$20,000 to $29,999
- 3,640$30,000 to $39,999
- 2,201$40,000 to $49,999
- 2,065$50,000 to $59,999
- 3,485$60,000 to $74,999
- 6,244$75,000 to $99,999
- 3,862$100,000 to $124,999
- 1,879$125,000 to $149,999
- 2,091$150,000 to $199,999
- 3,150$200,000 or more
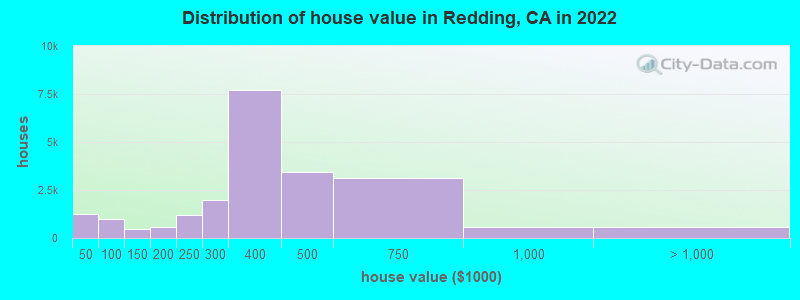
Home value of owner - occupied houses in 2022 in Redding, CA
-
- 402Less than $10,000
- 119$10,000 to $14,999
- 91$15,000 to $19,999
- 125$20,000 to $24,999
- 100$25,000 to $29,999
- 141$30,000 to $34,999
- 125$35,000 to $39,999
- 146$40,000 to $49,999
- 127$50,000 to $59,999
- 95$60,000 to $69,999
- 252$70,000 to $79,999
- 267$80,000 to $89,999
- 94$90,000 to $99,999
- 299$100,000 to $124,999
- 161$125,000 to $149,999
- 249$150,000 to $174,999
- 297$175,000 to $199,999
- 1,220$200,000 to $249,999
- 1,967$250,000 to $299,999
- 7,720$300,000 to $399,999
- 3,438$400,000 to $499,999
- 3,112$500,000 to $749,999
- 572$750,000 to $999,999
- 232$1,000,000 to $1,499,999
- 57$1,500,000 to $1,999,999
- 290$2,000,000 or more
Rent paid by renters in 2022 in Redding, CA
-
- 414$150 to $199
- 89$250 to $299
- 322$300 to $349
- 100$350 to $399
- 129$400 to $449
- 185$450 to $499
- 284$500 to $549
- 272$550 to $599
- 1,078$600 to $649
- 529$650 to $699
- 831$700 to $749
- 892$750 to $799
- 2,264$800 to $899
- 1,173$900 to $999
- 3,791$1,000 to $1,249
- 721$1,250 to $1,499
- 1,200$1,500 to $1,999
- 929$2,000 to $2,499
- 48$2,500 to $2,999
- 241$3,000 to $3,499
- 73$3,500 or more
- 271No cash rent


Percentage of workers working in this county: 95.1%
Number of people working at home: 3,189 (7.9% of all workers)
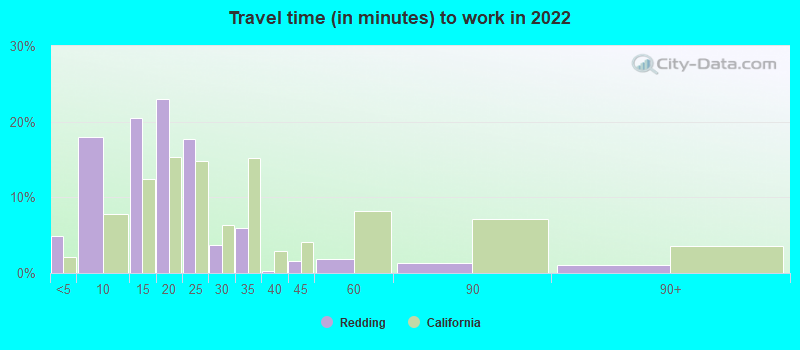
Travel time to work (commute)
- Less than 5 minutes: 1,743
- 5 to 9 minutes: 8,958
- 10 to 14 minutes: 8,405
- 15 to 19 minutes: 8,201
- 20 to 24 minutes: 4,580
- 25 to 29 minutes: 712
- 30 to 34 minutes: 788
- 35 to 39 minutes: 88
- 40 to 44 minutes: 608
- 45 to 59 minutes: 1,000
- 60 to 89 minutes: 953
- 90 or more minutes: 541
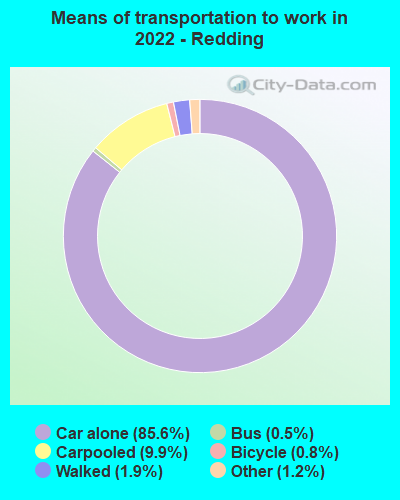
Means of transportation to work:
- Drove a car alone: 43,532 (79.5%)
- Carpooled: 5,767 (10.5%)
- Bus: 353 (0.6%)
- Subway or elevated rail: 44 (0.1%)
- Long-distance train or commuter rail: 17 (0.0%)
- Ferryboat: 30 (0.1%)
- Taxi: 522 (1.0%)
- Bicycle: 454 (0.8%)
- Walked: 734 (1.3%)
- Worked at home: 3,189 (5.8%)

- Unemployment by race in 2022
- Unemployment rate for White non-Hispanic residents
- 3.2%Males
- 3.2%Females
- Unemployment rate for American Indian and Alaska Native residents
- 5.7%Males
- 7.2%Females
- Unemployment rate for Asian residents
- 2.3%Males
- 6.5%Females
- Unemployment rate for other race residents
- 2.8%Females
- Unemployment rate for two or more race residents
- 7.9%Males
- 11.4%Females
- Unemployment rate for Hispanic or Latino residents
- 13.9%Males
- 6.8%Females

- Year of entry for the foreign-born population in Redding, California
- 2,1492010 or later
- 8612000 to 2009
- 9591990 to 1999
- 1,3941980 to 1989
- 3161970 to 1979
- 1,170Before 1970

First ancestries reported:
- American: 4,316 (11.3%)
- English: 3,345 (8.7%)
- German: 3,338 (8.7%)
- European: 2,765 (7.2%)
- Irish: 2,597 (6.8%)
- Italian: 2,329 (6.1%)
- Norwegian: 741 (1.9%)
- Scottish: 491 (1.3%)
- Swedish: 464 (1.2%)
- Dutch: 413 (1.1%)
- Polish: 377 (1.0%)
- French: 347 (0.9%)
- Portuguese: 318 (0.8%)
- Northern European: 233 (0.6%)
- Eastern European: 228 (0.6%)
- Scotch-Irish: 203 (0.5%)
- French Canadian: 178 (0.5%)
- British: 177 (0.5%)
- Syrian: 167 (0.4%)
- Greek: 154 (0.4%)
- Scandinavian: 148 (0.4%)
- South African: 145 (0.4%)
- Czech: 138 (0.4%)
- Canadian: 130 (0.3%)
- Welsh: 116 (0.3%)
- Danish: 98 (0.3%)
- Russian: 94 (0.2%)
- Ukrainian: 83 (0.2%)
- Basque: 71 (0.2%)
- Austrian: 56 (0.1%)
- Finnish: 45 (0.1%)
- Moroccan: 39 (0.1%)
- Icelander: 38 (0.10%)
- Lebanese: 35 (0.09%)
- Brazilian: 33 (0.09%)
- Swiss: 28 (0.07%)
- Croatian: 26 (0.07%)
- Belgian: 25 (0.07%)
- Slovak: 22 (0.06%)
- Jamaican: 20 (0.05%)
- Hungarian: 19 (0.05%)
- Maltese: 16 (0.04%)
- Albanian: 16 (0.04%)
- Latvian: 15 (0.04%)
- Iranian: 15 (0.04%)
- Ethiopian: 13 (0.03%)
- Turkish: 13 (0.03%)
- Haitian: 12 (0.03%)
- Carpatho Rusyn: 10 (0.03%)
- Czechoslovakian: 9 (0.02%)
- Serbian: 9 (0.02%)
- Lithuanian: 8 (0.02%)
- Liberian: 7 (0.02%)
- Yugoslavian: 6 (0.02%)
- Romanian: 5 (0.01%)
- Australian: 3 (0.01%)
- Palestinian: 3 (0.01%)
- African: 3 (0.01%)
Most common places of birth for foreign-born residents (%):
| Redding: | 18.7% (1,036) |
| California: | 37.2% (3,881,193) |
| Redding: | 8.1% (447) |
| California: | 7.8% (818,297) |
| Redding: | 8.0% (445) |
| California: | 0.7% (73,304) |
| Redding: | 6.6% (366) |
| California: | 1.2% (127,477) |
| Redding: | 6.3% (349) |
| California: | 5.2% (539,184) |
| Redding: | 3.4% (189) |
| California: | 0.6% (65,335) |
| Redding: | 3.1% (170) |
| California: | 0.2% (20,614) |
| Redding: | 3.0% (165) |
| California: | 3.0% (315,248) |
| Redding: | 2.8% (154) |
| California: | 4.9% (512,335) |
| Redding: | 2.5% (138) |
| California: | 0.3% (30,949) |
| Redding: | 2.4% (133) |
| California: | 0.5% (48,911) |
| Redding: | 2.3% (129) |
| California: | 0.1% (9,241) |
| Redding: | 2.2% (124) |
| California: | 0.6% (57,953) |
| Redding: | 2.2% (124) |
| California: | 1.7% (176,274) |
| Redding: | 2.1% (116) |
| California: | 0.6% (60,761) |
| Redding: | 2.0% (108) |
| California: | 6.6% (684,672) |
| Redding: | 1.6% (88) |
| California: | 0.5% (53,222) |
| Redding: | 1.5% (85) |
| California: | 1.0% (103,575) |
Place of birth for U.S.-born residents:
- This state: 61,682
- Other state: 24,061
- Northeast: 3,245
- Midwest: 6,136
- South: 6,162
- West: 8,518
85.1% of Redding residents lived in the same house 1 years ago.
Out of people who lived in different houses, 43.2% lived in this county.
Out of people who lived in different counties, 71.4% lived in California.
| Redding: | 85.1% |
| State average: | 88.9% |
Education attainment for males 25 years and older:
- No schooling: 513
- Nursery to 4th grade: 0
- 5th and 6th grade: 62
- 7th and 8th grade: 51
- 9th grade: 157
- 10th grade: 111
- 11th grade: 187
- 12th grade, no diploma: 761
- High school graduate (or equivalency): 7,933
- Less than 1 year of college: 2,296
- Some college more than 1 year, no degree: 6,644
- Associate degree: 2,883
- Bachelor's degree: 4,849
- Master's degree: 2,093
- Professional school degree: 1,454
- Doctorate degree: 224

Education attainment for females 25 years and older:
- No schooling: 224
- Nursery to 4th grade: 138
- 5th and 6th grade: 0
- 7th and 8th grade: 0
- 9th grade: 61
- 10th grade: 0
- 11th grade: 253
- 12th grade, no diploma: 477
- High school graduate (or equivalency): 7,385
- Less than 1 year of college: 2,762
- Some college more than 1 year, no degree: 7,070
- Associate degree: 5,462
- Bachelor's degree: 6,660
- Master's degree: 2,329
- Professional school degree: 264
- Doctorate degree: 276


Housing units in structures:
- One, detached: 25,229
- One, attached: 1,289
- Two: 2,511
- 3 or 4: 3,389
- 5 to 9: 1,928
- 10 to 19: 386
- 20 to 49: 1,019
- 50 or more: 1,671
- Mobile homes: 2,441
- Boats, RVs, vans, etc.: 185
Median worth of mobile homes: $73,300
Housing units lacking complete kitchen facilities in 2022: 0.8%
House/condo owner moved in on average 8 years ago
Renter moved in on average 3 years ago

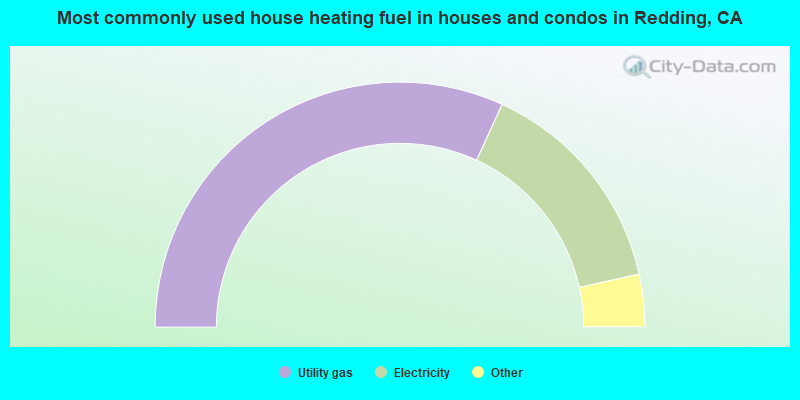
- 63.7%Utility gas
- 29.4%Electricity
- 3.7%Wood
- 1.6%Bottled, tank, or LP gas
- 0.8%Solar energy
- 0.3%No fuel used
- 0.3%Fuel oil, kerosene, etc.
- 0.2%Other fuel
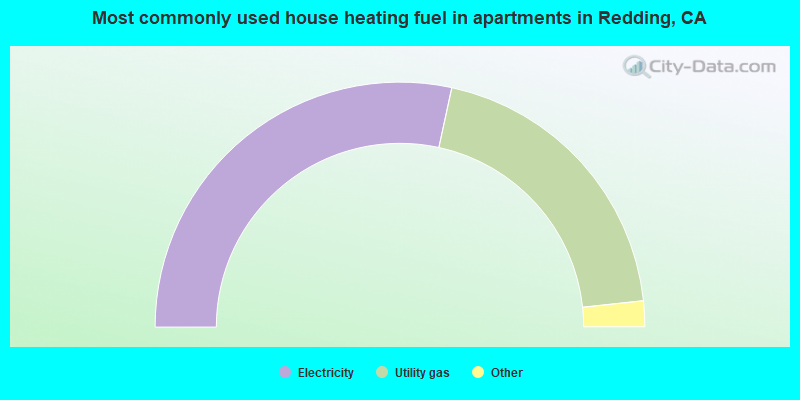
- 56.8%Electricity
- 39.8%Utility gas
- 1.8%Wood
- 1.0%Bottled, tank, or LP gas
- 0.4%No fuel used
- 0.1%Solar energy
Private vs. public school enrollment:
| Here: | 23.2% |
| California: | 10.5% |
| Here: | 5.0% |
| California: | 8.5% |
| Here: | 35.6% |
| California: | 15.9% |


