Red Lick, KY (Kentucky) Houses and Residents
| Red Lick: | $126,478 |
| Kentucky: | $196,300 |
Total population: 5,387 (Urban population: 220 (all inside urban clusters), Rural population: 5,318 (326 farm, 4,992 nonfarm))
Houses: 2,363 (2,153 occupied: 1,670 owner occupied, 483 renter occupied)
| % of renters here: | 22% |
| State: | 31% |
Housing density: 36 houses/condos per square mile
Median price asked for vacant for-sale houses and condos in 2022 in this county: $557,935.
Median contract rent in 2022: $423 (lower quartile is $321, upper quartile is $516)
Median rent asked for vacant for-rent units in 2022: $470
Median gross rent in Red Lick, KY in 2022: $656
Housing units in Red Lick with a mortgage: 475 (15 second mortgage, 41 home equity loan, 0 both second mortgage and home equity loan)
Houses without a mortgage: 425


Household type by relationship:
Households: 14,554- In family households: 12,442 (2,877 male householders, 1,263 female householders)
2,991 spouses, 3,983 children (3,661 natural, 87 adopted, 235 stepchildren), 520 grandchildren, 107 brothers or sisters, 92 parents, foster children, 143 other relatives, 371 non-relatives
- In nonfamily households: 2,112 (840 male householders (714 living alone)), 1,004 female householders (907 living alone)), 268 nonrelatives
- In group quarters: 118 (117 institutionalized population)
2,404 married couples with children.
930 single-parent households (196 men, 734 women).
98.7% of residents of Red Lick speak English at home.
0.7% of residents speak Spanish at home (85% speak English very well, 15% speak English not well).
0.3% of residents speak other Indo-European language at home (100% speak English very well).
0.4% of residents speak Asian or Pacific Island language at home (100% speak English very well).
Foreign born population: 16 (0.3%)
(100.0% of them are naturalized citizens)
| Here: | 6.3 |
| State: | 6.4 |
| Here: | 5.0 |
| State: | 4.4 |

- Bedrooms in owner-occupied houses and condos in Red Lick, Kentucky
- 8no bedroom
- 261 bedroom
- 5132 bedrooms
- 9563 bedrooms
- 1384 bedrooms
- 295+ bedrooms

- Bedrooms in renter-occupied apartments in Red Lick, Kentucky
- 9no bedroom
- 761 bedroom
- 2262 bedrooms
- 1343 bedrooms
- 224 bedrooms
- 165+ bedrooms

- Cars and other vehicles available in Red Lick in owner-occupied houses/condos
- 159no vehicle
- 3911 vehicle
- 6932 vehicles
- 3093 vehicles
- 1004 vehicles
- 185+ vehicles

- Cars and other vehicles available in Red Lick in renter-occupied apartments
- 84no vehicle
- 2261 vehicle
- 1352 vehicles
- 233 vehicles
- 84 vehicles
- 75+ vehicles

- Rooms in owner-occupied houses in Red Lick, Kentucky
- 81 room
- 82 rooms
- 03 rooms
- 3344 rooms
- 5155 rooms
- 4026 rooms
- 1687 rooms
- 1778 rooms
- 589+ rooms

- Rooms in renter-occupied apartments in Red Lick, Kentucky
- 91 room
- 162 rooms
- 333 rooms
- 1644 rooms
- 1595 rooms
- 556 rooms
- 87 rooms
- 158 rooms
- 249+ rooms


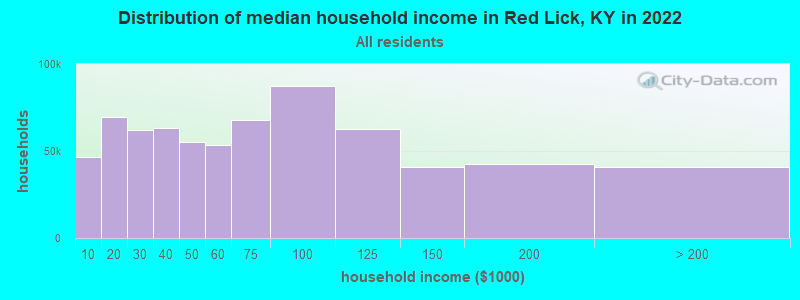
Red Lick, KY household income distribution

- 41,368Less than $10,000
- 66,384$10,000 to $19,999
- 56,352$20,000 to $29,999
- 59,368$30,000 to $39,999
- 46,170$40,000 to $49,999
- 49,910$50,000 to $59,999
- 58,013$60,000 to $74,999
- 79,618$75,000 to $99,999
- 56,891$100,000 to $124,999
- 35,221$125,000 to $149,999
- 35,118$150,000 to $199,999
- 30,702$200,000 or more
Percentage of workers working in this county: 42.0%
Number of people working at home: 178 (8.8% of all workers)
Travel time to work (commute)
- Less than 5 minutes: 65
- 5 to 9 minutes: 150
- 10 to 14 minutes: 243
- 15 to 19 minutes: 260
- 20 to 24 minutes: 146
- 25 to 29 minutes: 129
- 30 to 34 minutes: 223
- 35 to 39 minutes: 28
- 40 to 44 minutes: 128
- 45 to 59 minutes: 142
- 60 to 89 minutes: 282
- 90 or more minutes: 110
Means of transportation to work:
- Drove a car alone: 1,487 (76.8%)
- Carpooled: 394 (20.4%)
- Walked: 8 (0.4%)
- Other means: 17 (0.9%)
- Worked at home: 30 (1.5%)


- Year of entry for the foreign-born population in Red Lick, Kentucky
- 01995 to March 2000
- 01990 to 1994
- 01985 to 1989
- 01980 to 1984
- 01975 to 1979
- 01970 to 1974
- 01965 to 1969
- 9Before 1965
Most common places of birth for foreign-born residents (%):
| Red Lick: | 100.0% (9) |
| Kentucky: | 3.8% (3,039) |
Place of birth for U.S.-born residents:
- This state: 4,902
- Other state: 627
- Northeast: 19
- Midwest: 368
- South: 187
- West: 53
57% of Red Lick residents lived in the same house 5 years ago.
Out of people who lived in different houses, 62% lived in this county.
Out of people who lived in different counties, 82% lived in Kentucky.
Education attainment for males 25 years and older:
- No schooling: 16
- Nursery to 4th grade: 9
- 5th and 6th grade: 73
- 7th and 8th grade: 310
- 9th grade: 65
- 10th grade: 110
- 11th grade: 70
- 12th grade, no diploma: 103
- High school graduate (or equivalency): 644
- Less than 1 year of college: 68
- Some college more than 1 year, no degree: 99
- Associate degree: 12
- Bachelor's degree: 80
- Master's degree: 28
- Professional school degree: 7
- Doctorate degree: 0

Education attainment for females 25 years and older:
- No schooling: 7
- Nursery to 4th grade: 23
- 5th and 6th grade: 65
- 7th and 8th grade: 226
- 9th grade: 137
- 10th grade: 86
- 11th grade: 42
- 12th grade, no diploma: 67
- High school graduate (or equivalency): 742
- Less than 1 year of college: 112
- Some college more than 1 year, no degree: 161
- Associate degree: 70
- Bachelor's degree: 83
- Master's degree: 73
- Professional school degree: 0
- Doctorate degree: 0


Housing units in structures:
- One, detached: 1,503
- One, attached: 34
- Two: 8
- 3 or 4: 27
- 5 to 9: 58
- 10 to 19: 19
- Mobile homes: 708
- Boats, RVs, vans, etc.: 6
Median worth of mobile homes: $55,213
Housing units lacking complete kitchen facilities: 3.2%

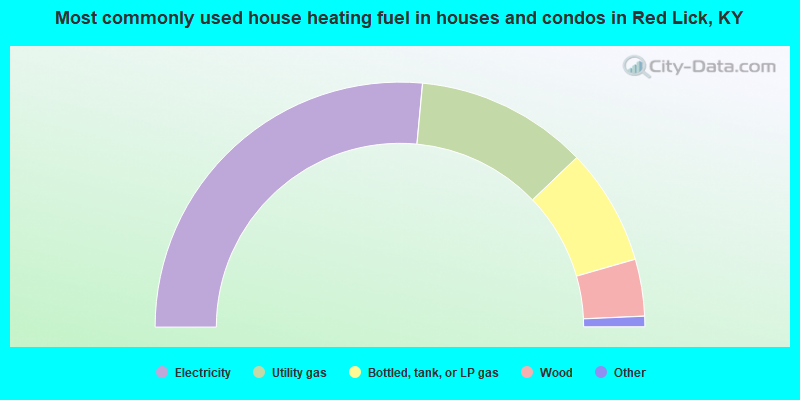
- 52.9%Electricity
- 22.7%Utility gas
- 15.4%Bottled, tank, or LP gas
- 7.5%Wood
- 1.0%Coal or coke
- 0.5%Fuel oil, kerosene, etc.
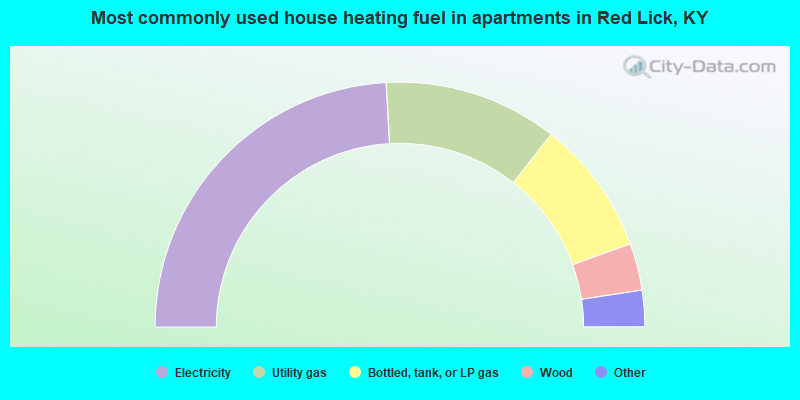
- 48.2%Electricity
- 23.0%Utility gas
- 17.8%Bottled, tank, or LP gas
- 6.2%Wood
- 3.3%Fuel oil, kerosene, etc.
- 1.4%Coal or coke
Private vs. public school enrollment:
| Here: | 0.0% |
| Kentucky: | 11.9% |
| Here: | 0.0% |
| Kentucky: | 10.6% |
| Here: | 11.4% |
| Kentucky: | 18.1% |


