Housing density: 837 houses/condos per square mile
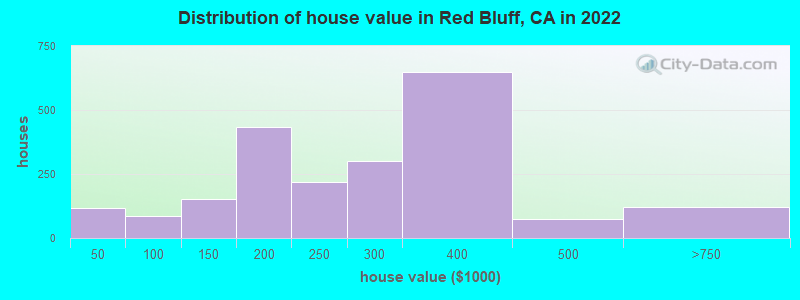
Median price asked for vacant for-sale houses and condos in 2022 in this county: $339,234.
Median contract rent in 2022: $803 (lower quartile is $635, upper quartile is $1,130)
Median rent asked for vacant for-rent units in 2022: $2,388
Median gross rent in Red Bluff, CA in 2022: $1,036
Housing units in Red Bluff with a mortgage: 1,648 (122 second mortgage, 0 home equity loan, 66 both second mortgage and home equity loan) Houses without a mortgage: 0
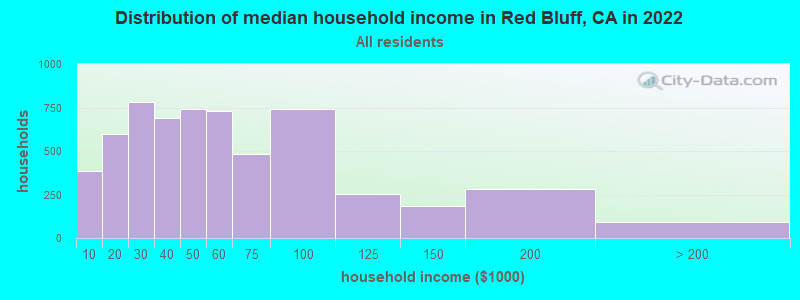
Median household income for houses/condos with a mortgage: $63,483
Median household income for apartments without a mortgage: $46,351
Size of family households: 1,130 2-persons, 938 3-persons, 627 4-persons, 563 5-persons, 97 6-persons, 214 7-or-more-persons.
Size of nonfamily households: 1,912 1-person, 205 2-persons, 45 3-persons.
1,762 married couples with children.
1,760 single-parent households (470 men, 1,290 women).
87.2% of residents of Red Bluff speak English at home.
9.9% of residents speak Spanish at home (79% speak English very well, 8% speak English well, 13% speak English not well).
0.4% of residents speak other Indo-European language at home (74% speak English very well, 26% speak English well).
1.3% of residents speak Asian or Pacific Island language at home (40% speak English very well, 28% speak English well, 11% speak English not well, 21% don't speak English at all).
0.5% of residents speak other language at home (100% speak English very well).
Foreign born population: 1,072 (7.4%)
(30.7% of them are naturalized citizens)
Percentage of workers working in this county: 84.1% Number of people working at home: 670 (13.2% of all workers)
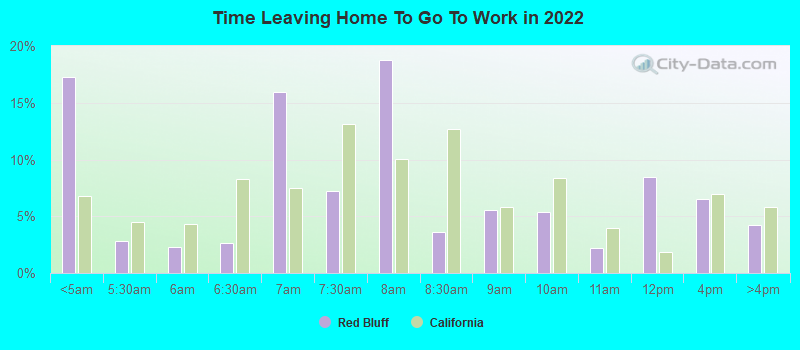
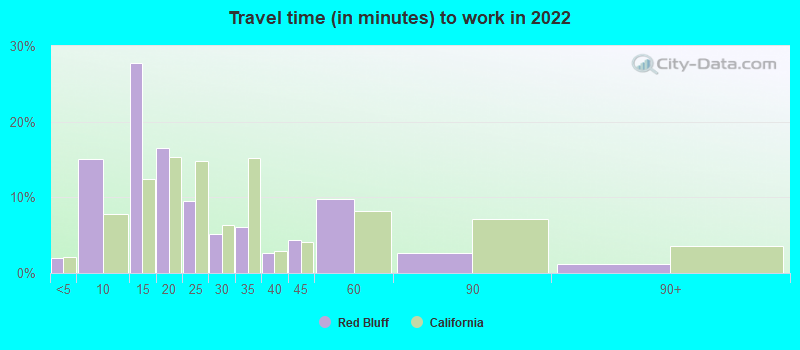
Travel time to work (commute)
Less than 5 minutes: 186
5 to 9 minutes: 980
10 to 14 minutes: 878
15 to 19 minutes: 540
20 to 24 minutes: 180
25 to 29 minutes: 153
30 to 34 minutes: 113
35 to 39 minutes: 40
40 to 44 minutes: 266
45 to 59 minutes: 115
60 to 89 minutes: 57
90 or more minutes: 193
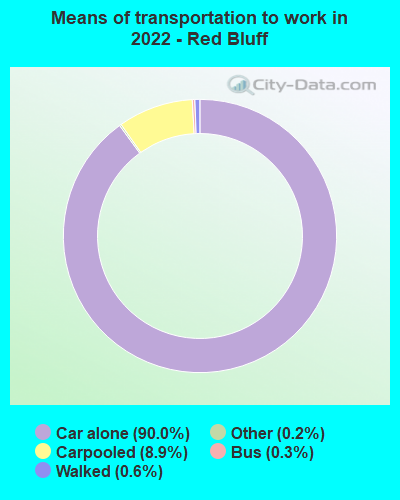
Means of transportation to work:
Drove a car alone: 7,538 (81.2%)
Carpooled: 804 (8.7%)
Bus: 17 (0.2%)
Taxi: 21 (0.2%)
Walked: 53 (0.6%)
Worked at home: 670 (7.2%)
Unemployment by race in 2022
Unemployment rate for White non-Hispanic residents
5.6%Males
9.9%Females
Unemployment rate for Black residents
14.6%Females
Unemployment rate for American Indian and Alaska Native residents
24.4%Females
Unemployment rate for Asian residents
20.9%Males
Unemployment rate for other race residents
14.9%Males
Unemployment rate for two or more race residents
7.6%Males
12.8%Females
Unemployment rate for Hispanic or Latino residents
12.5%Males
9.4%Females
Year of entry for the foreign-born population in Red Bluff, California
1032010 or later
2362000 to 2009
1901990 to 1999
1931980 to 1989
931970 to 1979
111Before 1970
First ancestries reported:
American: 1,144 (14.8%)
English: 920 (11.9%)
Irish: 757 (9.8%)
European: 605 (7.8%)
German: 569 (7.4%)
Italian: 257 (3.3%)
French: 93 (1.2%)
African: 84 (1.1%)
Portuguese: 75 (1.0%)
Scottish: 71 (0.9%)
Egyptian: 60 (0.8%)
Norwegian: 49 (0.6%)
Polish: 22 (0.3%)
British: 16 (0.2%)
Australian: 12 (0.2%)
Yugoslavian: 10 (0.1%)
Czechoslovakian: 8 (0.1%)
Swedish: 6 (0.08%)
Danish: 4 (0.05%)
Jamaican: 3 (0.04%)
Most common places of birth for foreign-born residents (%):
Mexico
Red Bluff:
53.0% (491)
California:
37.2% (3,881,193)
Germany
Red Bluff:
9.2% (85)
California:
0.7% (73,304)
Philippines
Red Bluff:
7.7% (71)
California:
7.8% (818,297)
Vietnam
Red Bluff:
6.2% (57)
California:
4.9% (512,335)
Egypt
Red Bluff:
5.5% (51)
California:
0.4% (42,718)
Canada
Red Bluff:
4.0% (37)
California:
1.2% (127,477)
India
Red Bluff:
3.3% (31)
California:
5.2% (539,184)
England
Red Bluff:
2.4% (22)
California:
0.6% (57,953)
Nicaragua
Red Bluff:
2.3% (21)
California:
0.6% (58,161)
China, excluding Hong Kong and Taiwan
Red Bluff:
1.9% (18)
California:
6.6% (684,672)
Place of birth for U.S.-born residents:
This state: 10,499
Other state: 2,736
Northeast: 241
Midwest: 715
South: 692
West: 1,050
89.8% of Red Bluff residents lived in the same house 1 years ago. Out of people who lived in different houses, 38.9% lived in this county. Out of people who lived in different counties, 80.6% lived in California.
Red Bluff:
89.8%
State average:
88.9%
Education attainment for males 25 years and older:
No schooling: 47
Nursery to 4th grade: 0
5th and 6th grade: 0
7th and 8th grade: 11
9th grade: 316
10th grade: 61
11th grade: 175
12th grade, no diploma: 64
High school graduate (or equivalency): 1,713
Less than 1 year of college: 350
Some college more than 1 year, no degree: 877
Associate degree: 306
Bachelor's degree: 235
Master's degree: 59
Professional school degree: 0
Doctorate degree: 0
Education attainment for females 25 years and older:
No schooling: 33
Nursery to 4th grade: 0
5th and 6th grade: 54
7th and 8th grade: 247
9th grade: 66
10th grade: 20
11th grade: 77
12th grade, no diploma: 33
High school graduate (or equivalency): 1,326
Less than 1 year of college: 385
Some college more than 1 year, no degree: 1,209
Associate degree: 471
Bachelor's degree: 319
Master's degree: 212
Professional school degree: 13
Doctorate degree: 0
Housing units in structures:
One, detached: 3,668
One, attached: 150
Two: 227
3 or 4: 623
5 to 9: 821
10 to 19: 145
20 to 49: 98
50 or more: 254
Mobile homes: 229
Median worth of mobile homes: $158,055
Housing units lacking complete plumbing facilities in 2022: 2.7%
Housing units lacking complete kitchen facilities in 2022: 3.2%
House/condo owner moved in on average 11 years ago