Rapid Valley, SD (South Dakota) Houses and Residents
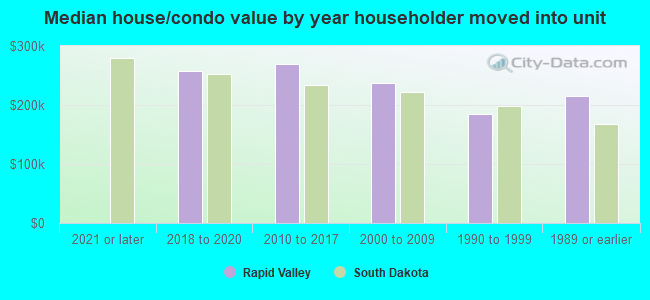
| Rapid Valley: | $237,910 |
| South Dakota: | $245,000 |
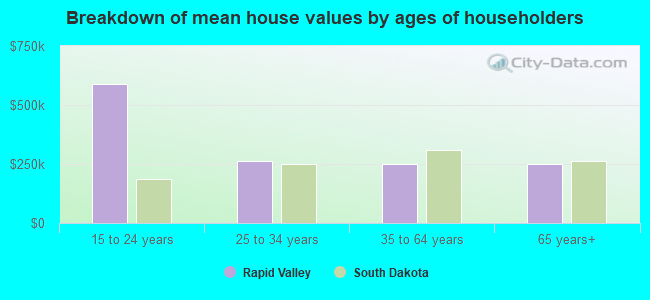
Mean price in 2022:
Detached houses: $269,646
Here: $269,646 State: $303,134 Townhouses or other attached units: $209,882
Here: $209,882 State: $292,182 Mobile homes: $90,474
Here: $90,474 State: $82,732
Total population: 8,260 (Urban population: 6,030, Rural population: 1,023 (all nonfarm))
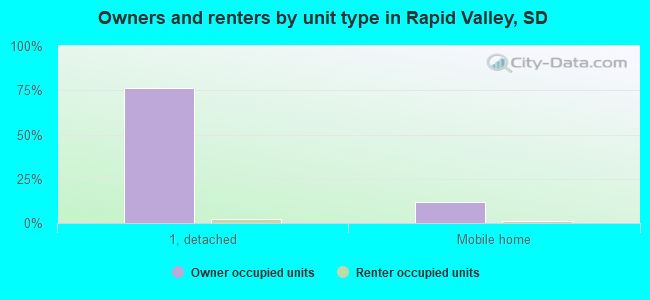
Houses: 3,262 (3,208 occupied: 3,054 owner occupied, 206 renter occupied)
| % of renters here: | 6% |
| State: | 30% |
Housing density: 321 houses/condos per square mile
Median price asked for vacant for-sale houses and condos in 2022 in this county: $576,774.
Median contract rent in 2022: $1,036
Median gross rent in Rapid Valley, SD in 2022: $1,346
Housing units in Rapid Valley with a mortgage: 1,942 (346 second mortgage, 0 home equity loan, 281 both second mortgage and home equity loan)
Houses without a mortgage: 0
Median household income for houses/condos with a mortgage: $82,645
Median household income for apartments without a mortgage: $48,917
Median monthly housing costs: $1,199
Compare current foreclosures near Rapid Valley, SD:
| Photo | Address | Area | Beds / Baths | Price | Details |
|---|---|---|---|---|---|

|
#1
S Pitch Ct
Rapid City, SD 57703
|
1,592 sq. feet
|
2 baths 3 beds |
show details | |

|
#2
Highway 1416
New Underwood, SD 57761
|
- sq. feet
|
2 baths 3 beds |
show details | |

|
#3
Montana St
Rapid City, SD 57701
|
912 sq. feet
|
1 baths 2 beds |
show details | |

|
#4
Doris Ct
Black Hawk, SD 57718
|
- sq. feet
|
1 baths 3 beds |
show details | |

|
#5
Tiffany Ln
Hermosa, SD 57744
|
2,788 sq. feet
|
3 baths - beds |
show details | |

|
#6
Bayonet Dr
Box Elder, SD 57719
|
- sq. feet
|
- baths - beds |
show details | |

|
#7
Vale St
Rapid City, SD 57702
|
- sq. feet
|
- baths - beds |
show details | |

|
#8
Meadowlark Dr
Box Elder, SD 57719
|
- sq. feet
|
- baths - beds |
show details | |

|
#9
Reder St
Rapid City, SD 57702
|
1,147 sq. feet
|
- baths - beds |
show details | |

|
#10
Brookside Dr
Rapid City, SD 57702
|
1,036 sq. feet
|
- baths - beds |
show details |
| Photo | Address | Area | Beds / Baths | Price | Details |
|---|---|---|---|---|---|

|
#11
Hall St
Rapid City, SD 57702
|
- sq. feet
|
- baths - beds |
show details | |

|
#12
Westwind Dr
Box Elder, SD 57719
|
- sq. feet
|
- baths - beds |
show details | |

|
#13
Flight Line Ct
Box Elder, SD 57719
|
1,042 sq. feet
|
- baths - beds |
show details | |

|
#14
Mickelson Ct
Box Elder, SD 57719
|
- sq. feet
|
- baths - beds |
show details | |

|
#15
Beadle Ct
Box Elder, SD 57719
|
- sq. feet
|
- baths - beds |
show details | |

|
#16
Promise Rd # 3318
Rapid City, SD 57701
|
- sq. feet
|
- baths - beds |
show details | |

|
#17
E Highway 44, Lot 15
Rapid City, SD 57703
|
- sq. feet
|
- baths - beds |
show details | |

|
#18
Seminole Ln
Rapid City, SD 57702
|
- sq. feet
|
- baths - beds |
show details | |

|
#19
Blue Bell Dr
Black Hawk, SD 57718
|
- sq. feet
|
- baths - beds |
show details | |

|
#20
W Highway 44
Rapid City, SD 57702
|
- sq. feet
|
- baths - beds |
show details |
| Photo | Address | Area | Beds / Baths | Price | Details |
|---|---|---|---|---|---|

|
#21
Boulder Hill Rd
Rapid City, SD 57702
|
- sq. feet
|
- baths - beds |
show details | |

|
#22
Abe Pl
Keystone, SD 57751
|
1,700 sq. feet
|
- baths - beds |
show details | |

|
#23
Lost Cave Rd
Keystone, SD 57751
|
- sq. feet
|
- baths - beds |
show details | |

|
#24
Chalkstone Dr # L
Rapid City, SD 57701
|
1,025 sq. feet
|
- baths - beds |
show details | |

|
#25
Sweetbriar St
Rapid City, SD 57703
|
1,660 sq. feet
|
- baths - beds |
show details | |

|
#26
N Ellsworth Rd Lot 15
Box Elder, SD 57719
|
- sq. feet
|
- baths - beds |
show details | |

|
#27
Meadowland Dr
Rapid City, SD 57703
|
906 sq. feet
|
- baths - beds |
show details | |

|
#28
Orchard Ln Lot 115
Rapid City, SD 57703
|
- sq. feet
|
- baths - beds |
show details | |

|
#29
E Saint Patrick St Lot 298
Rapid City, SD 57703
|
- sq. feet
|
- baths - beds |
show details | |

|
#30
Americas Way # 19579
Box Elder, SD 57719
|
- sq. feet
|
- baths - beds |
show details |
| Photo | Address | Area | Beds / Baths | Price | Details |
|---|---|---|---|---|---|

|
#31
E Chicago St # 9
Rapid City, SD 57701
|
- sq. feet
|
- baths - beds |
show details | |

|
#32
Ivy Ave
Rapid City, SD 57701
|
- sq. feet
|
- baths - beds |
show details | |

|
#33
N Spruce St Lot 138
Rapid City, SD 57701
|
- sq. feet
|
- baths - beds |
show details | |

|
#34
Sage Ave
Rapid City, SD 57701
|
1,032 sq. feet
|
- baths - beds |
show details | |

|
#35
Fairmont Ct
Rapid City, SD 57701
|
896 sq. feet
|
- baths - beds |
show details | |

|
#36
Ivy Ave
Rapid City, SD 57701
|
- sq. feet
|
- baths - beds |
show details | |

|
#37
Kahler Ct
Rapid City, SD 57701
|
1,490 sq. feet
|
- baths - beds |
show details | |

|
#38
Cypress St
Rapid City, SD 57701
|
1,184 sq. feet
|
- baths - beds |
show details | |

|
#39
E College Ave
Rapid City, SD 57701
|
868 sq. feet
|
- baths - beds |
show details | |

|
#40
Willsie Ave
Rapid City, SD 57701
|
675 sq. feet
|
- baths - beds |
show details |
| Photo | Address | Area | Beds / Baths | Price | Details |
|---|---|---|---|---|---|

|
#41
Lindbergh Ave
Rapid City, SD 57701
|
- sq. feet
|
- baths - beds |
show details | |

|
#42
Farlow Ave
Rapid City, SD 57701
|
1,250 sq. feet
|
- baths - beds |
show details | |

|
#43
Saint Joseph St Apt 21
Rapid City, SD 57701
|
- sq. feet
|
- baths - beds |
show details | |

|
#44
Mockingbird Dr
Box Elder, SD 57719
|
- sq. feet
|
- baths - beds |
show details | |

|
#45
Mallow St
Rapid City, SD 57701
|
1,584 sq. feet
|
- baths - beds |
show details | |

|
#46
Kodiak Dr
Box Elder, SD 57719
|
- sq. feet
|
- baths - beds |
show details | |

|
#47
Mystic Dr
Rapid City, SD 57701
|
- sq. feet
|
- baths - beds |
show details | |

|
Check over 1 million property listings on Foreclosure.com!
|
browse all offers | |||


 | Rapid Valley Sidewalk Repair (1 reply) |
| Rapid Valley???? (2 replies) |
| Question About Rapid City Housing Market (17 replies) |
| 2 Rapid City Questions (50 replies) |
| Making Rapid City home... (16 replies) |
| Tell me about living and raising a family in Rapid City (7 replies) |

Median year apartment built: 1991
Household type by relationship:
Households: 7,594- Male householders: 1,765 (386 living alone), Female householders: 1,434 (429 living alone)
1,509 spouses (1,498 opposite-sex spouses), 305 unmarried partners, (287 opposite-sex unmarried partners), 2,006 children (1,742 natural, 76 adopted, 187 stepchildren), 54 grandchildren, 30 brothers or sisters, 32 parents, 0 foster children, 22 other relatives, 432 non-relatives
Size of family households: 1,038 2-persons, 513 3-persons, 320 4-persons, 139 5-persons, 44 6-persons.
Size of nonfamily households: 904 1-person, 238 2-persons, 75 4-persons.
913 married couples with children.
460 single-parent households (89 men, 371 women).
94.2% of residents of Rapid Valley speak English at home.
2.1% of residents speak Spanish at home (100% speak English very well).
2.8% of residents speak other Indo-European language at home (94% speak English very well, 6% speak English well).
0.5% of residents speak Asian or Pacific Island language at home (100% speak English well).
0.2% of residents speak other language at home (100% speak English very well).
Foreign born population: 283 (3.7%)
(64.7% of them are naturalized citizens)
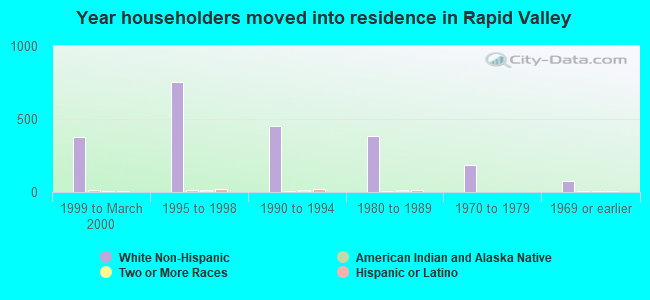
| Here: | 6.8 |
| State: | 7.0 |
| Here: | 5.2 |
| State: | 4.1 |
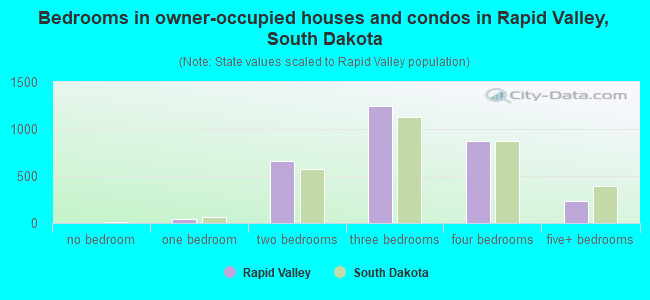
- Bedrooms in owner-occupied houses and condos in Rapid Valley, South Dakota
- 0no bedroom
- 451 bedroom
- 6602 bedrooms
- 1,2423 bedrooms
- 8714 bedrooms
- 2375+ bedrooms
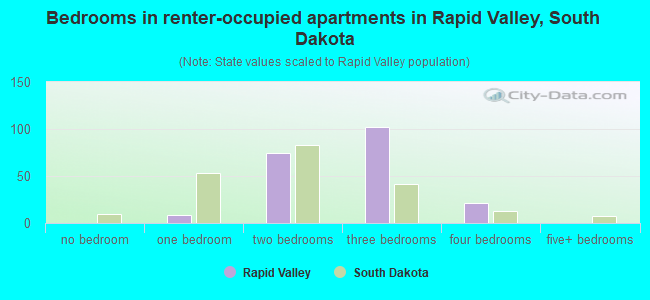
- Bedrooms in renter-occupied apartments in Rapid Valley, South Dakota
- 0no bedroom
- 81 bedroom
- 742 bedrooms
- 1023 bedrooms
- 214 bedrooms
- 05+ bedrooms
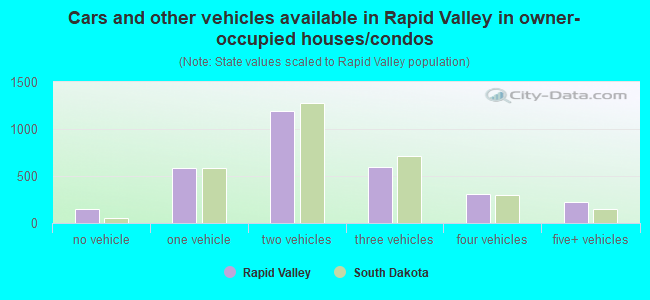
- Cars and other vehicles available in Rapid Valley in owner-occupied houses/condos
- 144no vehicle
- 5801 vehicle
- 1,1952 vehicles
- 5963 vehicles
- 3124 vehicles
- 2285+ vehicles
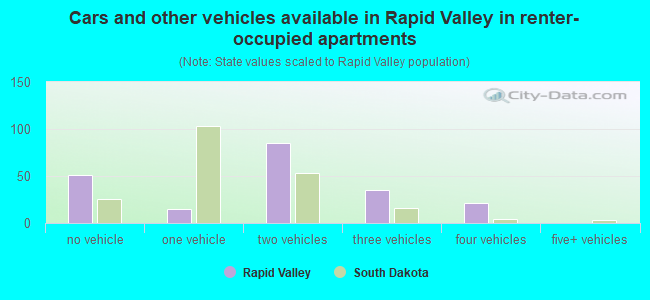
- Cars and other vehicles available in Rapid Valley in renter-occupied apartments
- 51no vehicle
- 151 vehicle
- 852 vehicles
- 353 vehicles
- 214 vehicles
- 05+ vehicles
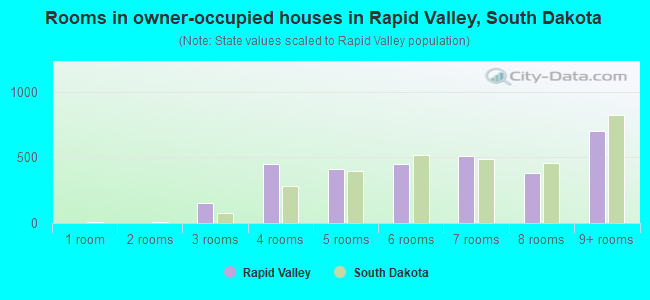
- Rooms in owner-occupied houses in Rapid Valley, South Dakota
- 01 room
- 02 rooms
- 1543 rooms
- 4514 rooms
- 4115 rooms
- 4486 rooms
- 5097 rooms
- 3848 rooms
- 6979+ rooms
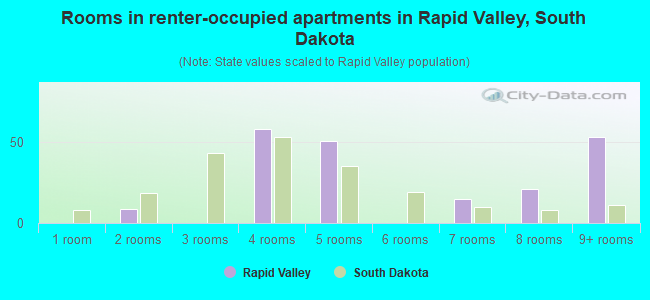
- Rooms in renter-occupied apartments in Rapid Valley, South Dakota
- 01 room
- 82 rooms
- 03 rooms
- 584 rooms
- 515 rooms
- 06 rooms
- 157 rooms
- 218 rooms
- 539+ rooms
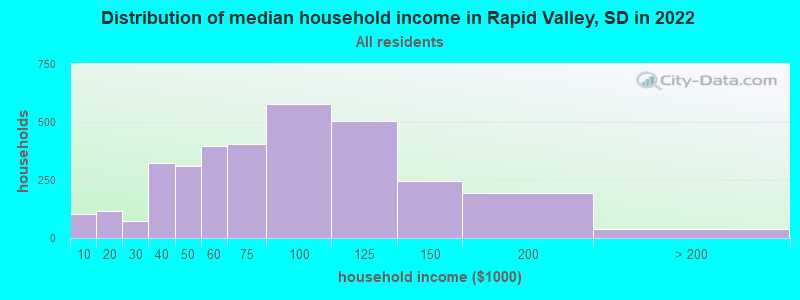
Rapid Valley, SD household income distribution

- 105Less than $10,000
- 117$10,000 to $19,999
- 72$20,000 to $29,999
- 323$30,000 to $39,999
- 311$40,000 to $49,999
- 396$50,000 to $59,999
- 405$60,000 to $74,999
- 578$75,000 to $99,999
- 505$100,000 to $124,999
- 247$125,000 to $149,999
- 193$150,000 to $199,999
- 38$200,000 or more
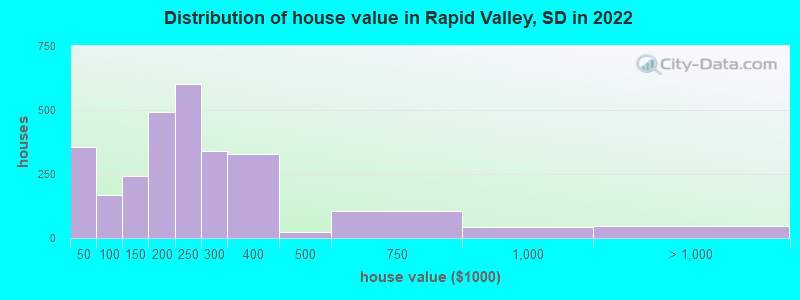
Home value of owner - occupied houses in 2022 in Rapid Valley, SD
-
- 11Less than $10,000
- 147$10,000 to $14,999
- 25$15,000 to $19,999
- 14$20,000 to $24,999
- 38$25,000 to $29,999
- 16$30,000 to $34,999
- 22$35,000 to $39,999
- 79$40,000 to $49,999
- 14$70,000 to $79,999
- 73$80,000 to $89,999
- 183$100,000 to $124,999
- 56$125,000 to $149,999
- 161$150,000 to $174,999
- 330$175,000 to $199,999
- 601$200,000 to $249,999
- 337$250,000 to $299,999
- 329$300,000 to $399,999
- 24$400,000 to $499,999
- 105$500,000 to $749,999
- 43$750,000 to $999,999
- 1$1,000,000 to $1,499,999
- 45$1,500,000 to $1,999,999
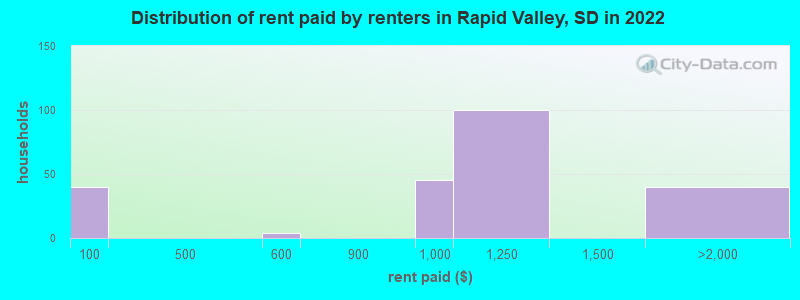
Rent paid by renters in 2022 in Rapid Valley, SD
-
- 40Less than $100
- 3$500 to $549
- 44$900 to $999
- 100$1,000 to $1,249
- 40$1,500 to $1,999
Percentage of workers working in this county: 92.7%
Number of people working at home: 242 (5.7% of all workers)
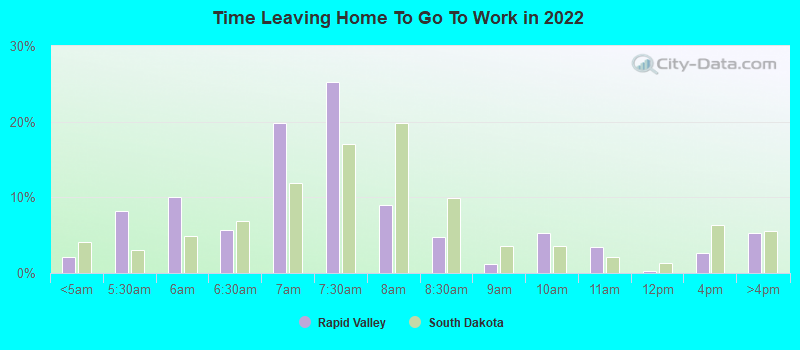
Travel time to work (commute)
- Less than 5 minutes: 48
- 5 to 9 minutes: 340
- 10 to 14 minutes: 824
- 15 to 19 minutes: 1,074
- 20 to 24 minutes: 1,120
- 25 to 29 minutes: 102
- 30 to 34 minutes: 212
- 35 to 39 minutes: 0
- 40 to 44 minutes: 0
- 45 to 59 minutes: 40
- 60 to 89 minutes: 49
- 90 or more minutes: 52
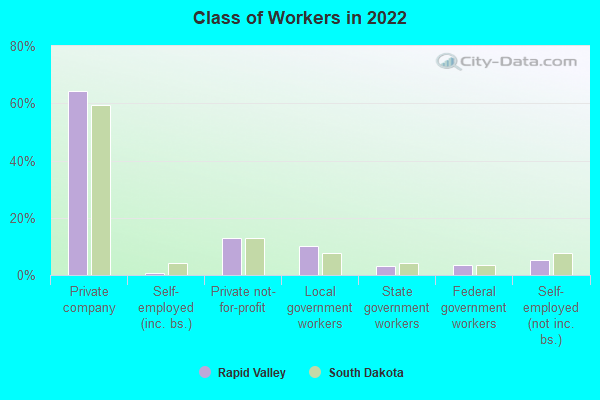
Means of transportation to work:
- Drove a car alone: 3,202 (84.0%)
- Carpooled: 472 (12.4%)
- Bus or trolley bus: 14 (0.4%)
- Motorcycle: 5 (0.1%)
- Walked: 14 (0.4%)
- Other means: 8 (0.2%)
- Worked at home: 95 (2.5%)
- Unemployment by race in 2022
- Unemployment rate for White non-Hispanic residents
- 6.0%Females
- Unemployment rate for Hispanic or Latino residents
- 16.7%Males
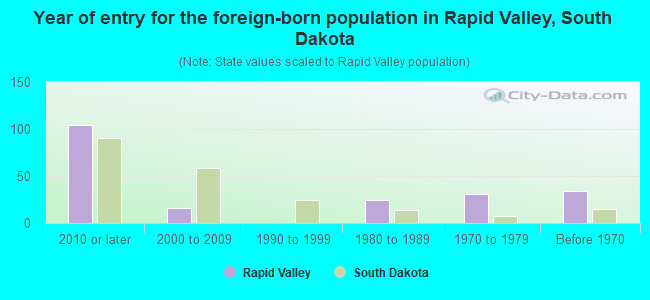
- Year of entry for the foreign-born population in Rapid Valley, South Dakota
- 1042010 or later
- 162000 to 2009
- 01990 to 1999
- 241980 to 1989
- 311970 to 1979
- 34Before 1970
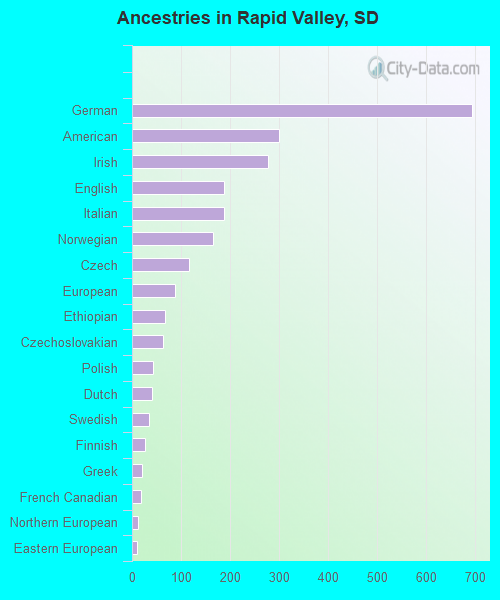
First ancestries reported:
- German: 693 (24.2%)
- American: 299 (10.4%)
- Irish: 277 (9.7%)
- English: 188 (6.6%)
- Italian: 188 (6.6%)
- Norwegian: 165 (5.8%)
- Czech: 116 (4.0%)
- European: 87 (3.0%)
- Ethiopian: 68 (2.4%)
- Czechoslovakian: 63 (2.2%)
- Polish: 42 (1.5%)
- Dutch: 41 (1.4%)
- Swedish: 34 (1.2%)
- Finnish: 27 (0.9%)
- Greek: 21 (0.7%)
- French Canadian: 18 (0.6%)
- Northern European: 12 (0.4%)
- Eastern European: 11 (0.4%)
Most common places of birth for foreign-born residents (%):
| Rapid Valley: | 29.3% (67) |
| South Dakota: | 7.4% (2,512) |
| Rapid Valley: | 28.4% (65) |
| South Dakota: | 1.8% (624) |
| Rapid Valley: | 17.0% (39) |
| South Dakota: | 4.9% (1,663) |
| Rapid Valley: | 12.2% (28) |
| South Dakota: | 2.5% (847) |
| Rapid Valley: | 7.0% (16) |
| South Dakota: | 1.4% (474) |
| Rapid Valley: | 4.4% (10) |
| South Dakota: | 1.1% (365) |
Place of birth for U.S.-born residents:
- This state: 4,020
- Other state: 3,201
- Northeast: 187
- Midwest: 1,329
- South: 409
- West: 1,250
89.1% of Rapid Valley residents lived in the same house 1 years ago.
Out of people who lived in different houses, 25.7% lived in this county.
Out of people who lived in different counties, 81.7% lived in South Dakota.
| Rapid Valley: | 89.1% |
| State average: | 86.6% |
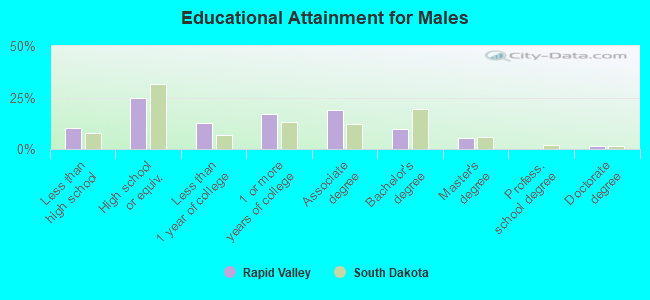
Education attainment for males 25 years and older:
- No schooling: 201
- Nursery to 4th grade: 0
- 5th and 6th grade: 0
- 7th and 8th grade: 0
- 9th grade: 0
- 10th grade: 31
- 11th grade: 42
- 12th grade, no diploma: 33
- High school graduate (or equivalency): 730
- Less than 1 year of college: 377
- Some college more than 1 year, no degree: 507
- Associate degree: 560
- Bachelor's degree: 280
- Master's degree: 159
- Professional school degree: 0
- Doctorate degree: 38
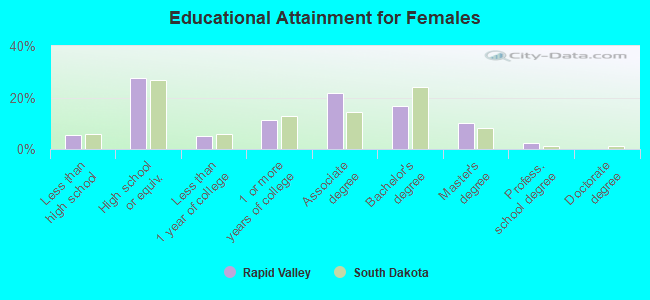
Education attainment for females 25 years and older:
- No schooling: 13
- Nursery to 4th grade: 0
- 5th and 6th grade: 0
- 7th and 8th grade: 32
- 9th grade: 0
- 10th grade: 19
- 11th grade: 19
- 12th grade, no diploma: 41
- High school graduate (or equivalency): 650
- Less than 1 year of college: 121
- Some college more than 1 year, no degree: 269
- Associate degree: 511
- Bachelor's degree: 394
- Master's degree: 240
- Professional school degree: 54
- Doctorate degree: 0


Housing units in structures:
- One, detached: 2,570
- One, attached: 107
- 5 to 9: 65
- Mobile homes: 519
House/condo owner moved in on average 14 years ago
Renter moved in on average 1 years ago
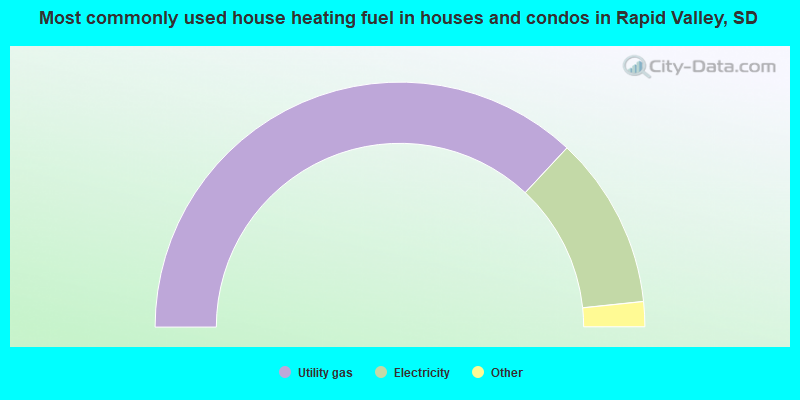
- 73.9%Utility gas
- 22.8%Electricity
- 1.6%Fuel oil, kerosene, etc.
- 0.7%Wood
- 0.6%Bottled, tank, or LP gas
- 0.4%Other fuel
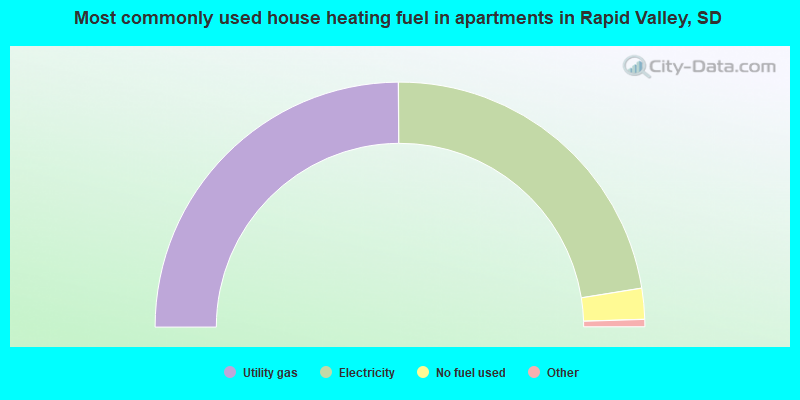
- 50.3%Utility gas
- 45.6%Electricity
- 4.1%No fuel used
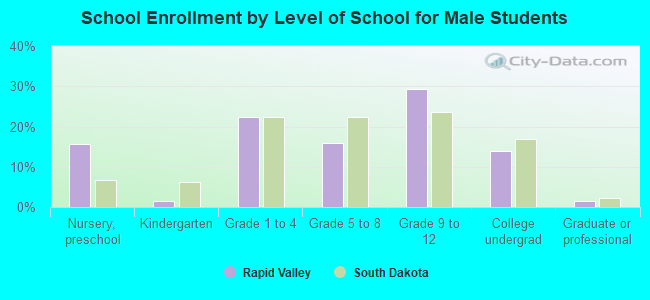
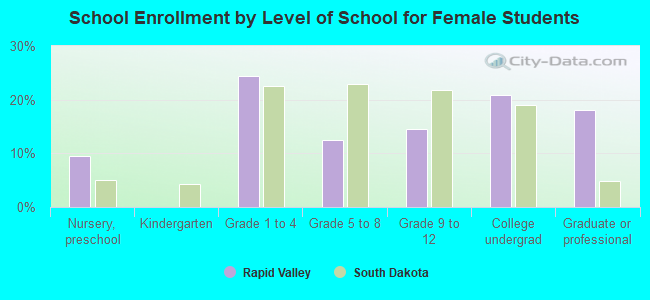
Private vs. public school enrollment:
| Here: | 15.3% |
| South Dakota: | 11.9% |
| Here: | 3.4% |
| South Dakota: | 7.2% |
| Here: | 0.0% |
| South Dakota: | 10.2% |