Jump to a detailed profile or search site with Google Custom Search

Rancho San Diego, CA (California) Houses and Residents

Estimated median house or condo value in 2022: $939,875 (it was $269,000 in 2000)
Rancho San Diego:

$939,875
California:

$715,900
Lower value quartile - upper value quartile: $663,711 - $1,158,228

Mean price in 2022:

Detached houses: $962,668
Here:

$962,668
State:

$988,808

Townhouses or other attached units: $489,185
Here:

$489,185
State:

$838,546

In 3-to-4-unit structures: $534,004
Here:

$534,004
State:

$824,253

In 5-or-more-unit structures: $478,451
Here:

$478,451
State:

$730,996

Mobile homes: $180,809
Here:

$180,809
State:

$184,506

Total population: 21,208 (Urban population: 20,020, Rural population: 23 (all nonfarm))

Houses: 8,440 (7,846 occupied: 5,839 owner occupied, 2,056 renter occupied)

% of renters here:

26%
State:

44%

Housing density: 951 houses/condos per square mile

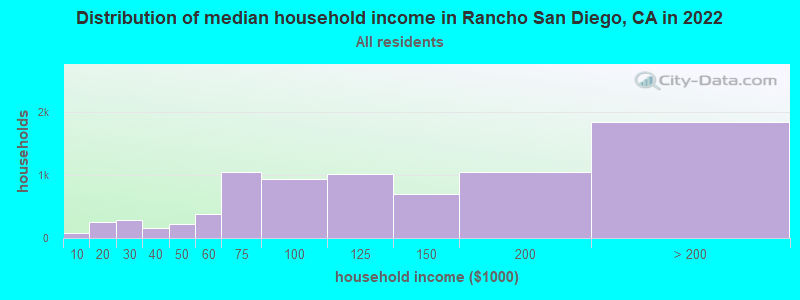
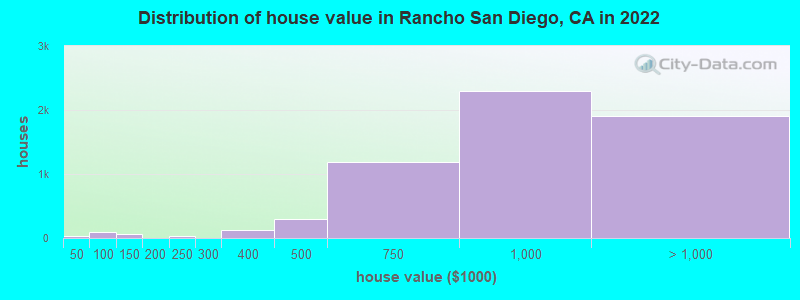
Median price asked for vacant for-sale houses and condos in 2022: $1,035,398.

Median contract rent in 2022: over $2,000 (lower quartile is $1,672, upper quartile is over $2,000)


Median rent asked for vacant for-rent units in 2022: $1,947


Median gross rent in Rancho San Diego, CA in 2022: over $2,000

Housing units in Rancho San Diego with a mortgage: 4,429 (448 second mortgage, 0 home equity loan, 403 both second mortgage and home equity loan)
Houses without a mortgage: 108

Median household income for houses/condos with a mortgage: $137,120

Median household income for apartments without a mortgage: $126,081

Median monthly housing costs: $2,471

Compare current foreclosures near Rancho San Diego, CA:

Check out more offers near Rancho San Diego, CA.
Powered by Foreclosure.com

Settings
X
Data:
Loading data...
Based on 2000-2022 data
Loading data...

123
Hide US histogram

Rancho San Diego, California Age and Sex of Residents
Median year house/condo built: 1986

Median year apartment built: 1989

Household type by relationship:

Households: 22,338
  • Male householders: 3,772 (277 living alone), Female householders: 3,935 (1,039 living alone)
  • 5,112 spouses (5,054 opposite-sex spouses), 137 unmarried partners, (132 opposite-sex unmarried partners), 7,252 children (6,957 natural, 164 adopted, 130 stepchildren), 245 grandchildren, 381 brothers or sisters, 829 parents, 29 foster children, 209 other relatives, 344 non-relatives
  • In group quarters: 86

Size of family households: 2,834 2-persons, 1,497 3-persons, 1,042 4-persons, 802 5-persons, 131 6-persons, 48 7-or-more-persons.

Size of nonfamily households: 1,352 1-person, 139 2-persons, 31 3-persons.

3,804 married couples with children.
525 single-parent households (130 men, 395 women).

73.7% of residents of Rancho San Diego speak English at home.
7.4% of residents speak Spanish at home (64% speak English very well, 19% speak English well, 11% speak English not well, 6% don't speak English at all).
1.7% of residents speak other Indo-European language at home (80% speak English very well, 20% speak English well).
2.7% of residents speak Asian or Pacific Island language at home (64% speak English very well, 36% speak English well).
16.1% of residents speak other language at home (65% speak English very well, 19% speak English well, 14% speak English not well, 2% don't speak English at all).

Foreign born population: 4,193 (18.8%)
(86.1% of them are naturalized citizens)

Median number of rooms in houses and condos:
Here:

6.9
State:

6.0

Median number of rooms in apartments
Here:

4.2
State:

3.9

Owner-occupied Renter-occupied
Bedrooms in owner-occupied houses and condos in Rancho San Diego, California
  • Bedrooms in owner-occupied houses and condos in Rancho San Diego, California
  • 15no bedroom
  • 1851 bedroom
  • 8502 bedrooms
  • 2,1323 bedrooms
  • 2,0634 bedrooms
  • 5955+ bedrooms
Bedrooms in renter-occupied apartments in Rancho San Diego, California
  • Bedrooms in renter-occupied apartments in Rancho San Diego, California
  • 128no bedroom
  • 5191 bedroom
  • 8662 bedrooms
  • 3943 bedrooms
  • 1224 bedrooms
  • 285+ bedrooms
Owner-occupied Renter-occupied
Cars and other vehicles available in Rancho San Diego in owner-occupied houses/condos
  • Cars and other vehicles available in Rancho San Diego in owner-occupied houses/condos
  • 39no vehicle
  • 9941 vehicle
  • 2,7122 vehicles
  • 1,3733 vehicles
  • 5234 vehicles
  • 1995+ vehicles
Cars and other vehicles available in Rancho San Diego in renter-occupied apartments
  • Cars and other vehicles available in Rancho San Diego in renter-occupied apartments
  • 317no vehicle
  • 6611 vehicle
  • 8072 vehicles
  • 2513 vehicles
  • 104 vehicles
  • 105+ vehicles
Owner-occupied Renter-occupied
Rooms in owner-occupied houses in Rancho San Diego, California
  • Rooms in owner-occupied houses in Rancho San Diego, California
  • 151 room
  • 1132 rooms
  • 1163 rooms
  • 6364 rooms
  • 6895 rooms
  • 9656 rooms
  • 1,0697 rooms
  • 1,0478 rooms
  • 1,1909+ rooms
Rooms in renter-occupied apartments in Rancho San Diego, California
  • Rooms in renter-occupied apartments in Rancho San Diego, California
  • 1281 room
  • 1282 rooms
  • 3863 rooms
  • 5704 rooms
  • 4945 rooms
  • 1596 rooms
  • 1147 rooms
  • 378 rooms
  • 429+ rooms
Year house built
Median 2022 house/condo value by year built
Median house/condo value by year householder moved into unit
Breakdown of mean house values by ages of householders
Owners and renters by unit type in Rancho San Diego, CA
  • Rancho San Diego, CA household income distribution

  • Distribution of median household income in Rancho San Diego, CA in 2022
  • 75Less than $10,000
  • 258$10,000 to $19,999
  • 281$20,000 to $29,999
  • 161$30,000 to $39,999
  • 215$40,000 to $49,999
  • 377$50,000 to $59,999
  • 1,042$60,000 to $74,999
  • 929$75,000 to $99,999
  • 1,007$100,000 to $124,999
  • 696$125,000 to $149,999
  • 1,049$150,000 to $199,999
  • 1,835$200,000 or more
  • Home value of owner - occupied houses in 2022 in Rancho San Diego, CA

  • Distribution of house value in Rancho San Diego, CA in 2022
  • 31Less than $10,000
  • 7$40,000 to $49,999
  • 18$50,000 to $59,999
  • 4$60,000 to $69,999
  • 54$70,000 to $79,999
  • 7$80,000 to $89,999
  • 57$100,000 to $124,999
  • 2$125,000 to $149,999
  • 23$200,000 to $249,999
  • 131$300,000 to $399,999
  • 293$400,000 to $499,999
  • 1,188$500,000 to $749,999
  • 2,301$750,000 to $999,999
  • 1,770$1,000,000 to $1,499,999
  • 76$1,500,000 to $1,999,999
  • 56$2,000,000 or more
  • Rent paid by renters in 2022 in Rancho San Diego, CA

  • Distribution of rent paid by renters in Rancho San Diego, CA in 2022
  • 36Less than $100
  • 100$100 to $149
  • 23$350 to $399
  • 15$750 to $799
  • 5$800 to $899
  • 70$900 to $999
  • 83$1,250 to $1,499
  • 450$1,500 to $1,999
  • 517$2,000 to $2,499
  • 335$2,500 to $2,999
  • 238$3,000 to $3,499
  • 85$3,500 or more
  • 103No cash rent
Time Leaving Home To Go To Work in 2022

Percentage of workers working in this county: 97.2%
Number of people working at home: 986 (9.1% of all workers)

Travel time (in minutes) to work in 2022

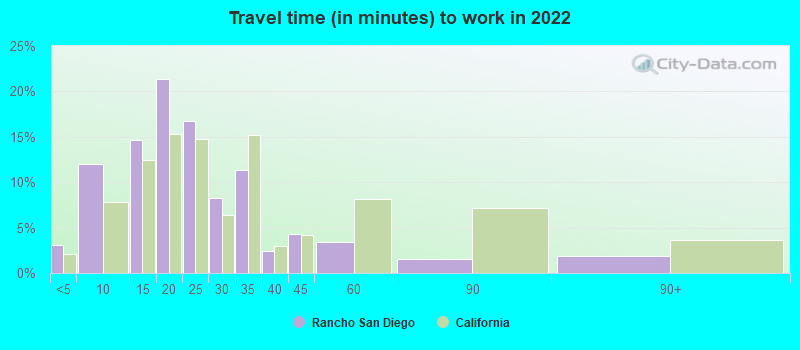
Travel time to work (commute)

  • Less than 5 minutes: 154
  • 5 to 9 minutes: 523
  • 10 to 14 minutes: 606
  • 15 to 19 minutes: 1,196
  • 20 to 24 minutes: 1,634
  • 25 to 29 minutes: 1,006
  • 30 to 34 minutes: 1,708
  • 35 to 39 minutes: 301
  • 40 to 44 minutes: 959
  • 45 to 59 minutes: 891
  • 60 to 89 minutes: 368
  • 90 or more minutes: 179
Means of transportation to work in 2022 - Rancho San Diego

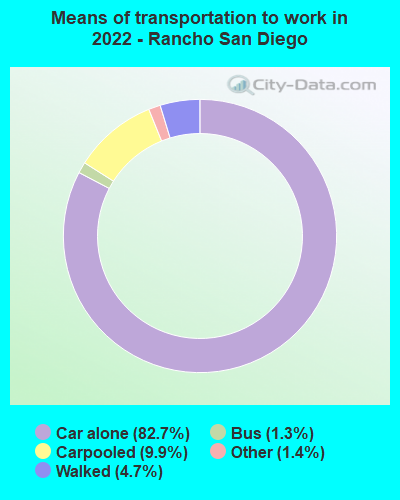
Means of transportation to work:

  • Drove a car alone: 3,363 (66.3%)
  • Carpooled: 420 (8.3%)
  • Bus: 46 (0.9%)
  • Taxi: 59 (1.2%)
  • Walked: 210 (4.1%)
  • Worked at home: 986 (19.5%)
Class of Workers in 2022
  • Unemployment by race in 2022
  • Unemployment rate for White non-Hispanic residents
  • 4.5%Males
  • 9.1%Females
  • Unemployment rate for Asian residents
  • 1.9%Females
  • Unemployment rate for other race residents
  • 3.4%Males
  • Unemployment rate for two or more race residents
  • 6.4%Males
  • 0.6%Females
  • Unemployment rate for Hispanic or Latino residents
  • 6.4%Males
Year of entry for the foreign-born population in Rancho San Diego, California
  • Year of entry for the foreign-born population in Rancho San Diego, California
  • 7402010 or later
  • 1,2392000 to 2009
  • 8721990 to 1999
  • 6701980 to 1989
  • 6781970 to 1979
  • 549Before 1970
Ancestries in Rancho San Diego, CA

First ancestries reported:

  • English: 781 (8.2%)
  • Iraqi: 772 (8.1%)
  • Assyrian: 673 (7.0%)
  • German: 534 (5.6%)
  • Arab: 511 (5.3%)
  • Italian: 477 (5.0%)
  • Irish: 436 (4.6%)
  • American: 339 (3.5%)
  • European: 228 (2.4%)
  • Scottish: 160 (1.7%)
  • Haitian: 123 (1.3%)
  • Polish: 99 (1.0%)
  • French: 68 (0.7%)
  • Serbian: 55 (0.6%)
  • Danish: 54 (0.6%)
  • Portuguese: 53 (0.6%)
  • Scotch-Irish: 43 (0.4%)
  • Norwegian: 43 (0.4%)
  • Scandinavian: 32 (0.3%)
  • Cajun: 31 (0.3%)
  • Iranian: 29 (0.3%)
  • Swedish: 29 (0.3%)
  • Russian: 27 (0.3%)
  • Ugandan: 27 (0.3%)
  • Romanian: 24 (0.3%)
  • Welsh: 19 (0.2%)
  • French Canadian: 17 (0.2%)
  • Greek: 16 (0.2%)
  • Lebanese: 14 (0.1%)
  • Northern European: 12 (0.1%)
  • African: 11 (0.1%)
  • Czech: 10 (0.1%)
  • Armenian: 10 (0.1%)
  • Eastern European: 9 (0.09%)
  • Yugoslavian: 9 (0.09%)
  • Israeli: 6 (0.06%)
  • Syrian: 6 (0.06%)
  • British: 5 (0.05%)
  • Basque: 5 (0.05%)
  • Pennsylvania German: 4 (0.04%)
  • Dutch: 2 (0.02%)

Most common places of birth for foreign-born residents (%):

Iraq
Rancho San Diego:

52.7% (2,211)
California:

0.4% (40,941)

Mexico
Rancho San Diego:

15.8% (661)
California:

37.2% (3,881,193)

Philippines
Rancho San Diego:

10.3% (430)
California:

7.8% (818,297)

England
Rancho San Diego:

2.2% (94)
California:

0.6% (57,953)

Place of birth for U.S.-born residents:

  • This state: 12,677
  • Other state: 4,996
  • Northeast: 1,320
  • Midwest: 1,702
  • South: 894
  • West: 1,058

93.2% of Rancho San Diego residents lived in the same house 1 years ago.
   Out of people who lived in different houses, 45.0% lived in this county.
   Out of people who lived in different counties, 51.6% lived in California.


Rancho San Diego:

93.2%
State average:

88.9%

Education attainment for males 25 years and older:

  • No schooling: 388
  • Nursery to 4th grade: 18
  • 5th and 6th grade: 34
  • 7th and 8th grade: 15
  • 9th grade: 0
  • 10th grade: 15
  • 11th grade: 78
  • 12th grade, no diploma: 137
  • High school graduate (or equivalency): 974
  • Less than 1 year of college: 694
  • Some college more than 1 year, no degree: 983
  • Associate degree: 691
  • Bachelor's degree: 2,090
  • Master's degree: 703
  • Professional school degree: 365
  • Doctorate degree: 94
Educational Attainment for Males

Education attainment for females 25 years and older:

  • No schooling: 267
  • Nursery to 4th grade: 31
  • 5th and 6th grade: 9
  • 7th and 8th grade: 36
  • 9th grade: 6
  • 10th grade: 20
  • 11th grade: 8
  • 12th grade, no diploma: 88
  • High school graduate (or equivalency): 1,294
  • Less than 1 year of college: 783
  • Some college more than 1 year, no degree: 1,019
  • Associate degree: 1,072
  • Bachelor's degree: 2,022
  • Master's degree: 1,390
  • Professional school degree: 391
  • Doctorate degree: 123
Educational Attainment for Females
Rancho San Diego marital status for males
Rancho San Diego marital status for females

Housing units in structures:

  • One, detached: 5,532
  • One, attached: 517
  • Two: 27
  • 3 or 4: 159
  • 5 to 9: 393
  • 10 to 19: 583
  • 20 to 49: 481
  • 50 or more: 649
  • Mobile homes: 96
Housing units lacking complete plumbing facilities in 2022: 0.1%

Housing units lacking complete kitchen facilities in 2022: 2.2%

House/condo owner moved in on average 17 years ago

Renter moved in on average 6 years ago

Year householders moved into residence in Rancho San Diego
Houses and condos Apartments
Most commonly used house heating fuel in houses and condos in Rancho San Diego, CA
  • 65.4%Utility gas
  • 25.2%Electricity
  • 3.4%Bottled, tank, or LP gas
  • 3.1%No fuel used
  • 2.8%Solar energy
Most commonly used house heating fuel in apartments in Rancho San Diego, CA
  • 55.4%Electricity
  • 34.9%Utility gas
  • 8.8%No fuel used
  • 0.8%Other fuel

Private vs. public school enrollment:

Students in private schools in grades 1 to 8 (elementary and middle school): 270
Here:

12.4%
California:

10.5%

Students in private schools in grades 9 to 12 (high school): 44
Here:

3.6%
California:

8.5%

Students in private undergraduate colleges: 204
Here:

14.9%
California:

15.9%
School Enrollment by Level of School for Male Students
School Enrollment by Level of School for Female Students
Age and Sex of Sensory-Disabled Noninstitutionalized Residents
Age and Sex of Physically-Disabled Noninstitutionalized Residents
Age and Sex of Mentally-Disabled Noninstitutionalized Residents
Age and Sex of Self-Care Disabled Noninstitutionalized Residents
Age and Sex of Go-Outside-Home Disabled Noninstitutionalized Residents
Age and Sex of Noninstitutionalized Residents with Employment Disability