Racine, WI (Wisconsin) Houses and Residents
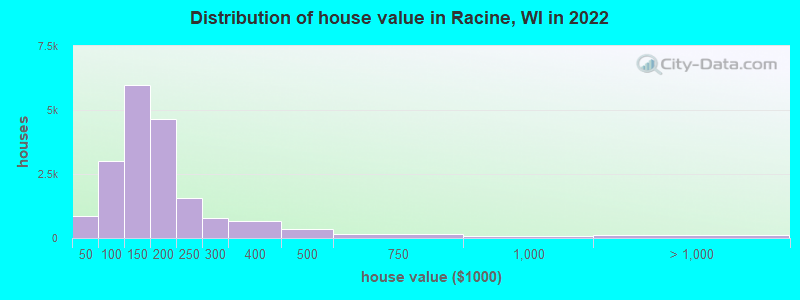
Estimated median house or condo value in 2022: $149,400 (it was $83,400 in 2000 )
Racine:
$149,400Wisconsin:
$252,800
Lower value quartile - upper value quartile: $108,900 - $202,400Mean price in 2022: Detached houses: $185,140 Here:
$185,140State:
$308,468
Townhouses or other attached units: $176,502 Here:
$176,502State:
$265,873
In 2-unit structures: $167,808 Here:
$167,808State:
$203,667
In 3-to-4-unit structures: $118,647 Here:
$118,647State:
$216,833
In 5-or-more-unit structures: $246,489 Here:
$246,489State:
$280,537
Mobile homes: $85,603 Here:
$85,603State:
$79,042
Total population: 78,065 (All urban)
Houses: 34,310 (31,263 occupied: 19,872 owner occupied, 11,391 renter occupied )
% of renters here:
36%State:
32%
Housing density: 2,208 houses/condos per square mile
Median price asked for vacant for-sale houses and condos in 2022: $83,447.
Median contract rent in 2022: $683 (lower quartile is $536, upper quartile is $897)
Median rent asked for vacant for-rent units in 2022: $1,216
Median gross rent in Racine, WI in 2022: $847
Housing units in Racine with a mortgage: 13,940 (1,540 second mortgage, 0 home equity loan, 1,082 both second mortgage and home equity loan )Houses without a mortgage: 751
Median household income for houses/condos with a mortgage: $72,355
Median household income for apartments without a mortgage: $61,975
Median monthly housing costs: $972
Data:
Median house or condo value ($)
Median house or condo value ($ change since 2000)
Median house or condo value ($) - White
Median house or condo value ($) - Black or African American
Median house or condo value ($) - Asian
Median house or condo value ($) - Hispanic or Latino
Median house or condo value ($) - American Indian and Alaska Native
Median house or condo value ($) - Multirace
Median house or condo value ($) - Other Race
Median price asked for mobile homes ($)
Household density (households per square mile)
Mean house or condo value by units in structure - 1, detached ($)
Mean house or condo value by units in structure - 1, attached ($)
Mean house or condo value by units in structure - 2 ($)
Mean house or condo value by units in structure by units in structure - 3 or 4 ($)
Mean house or condo value by units in structure - 5 or more ($)
Mean house or condo value by units in structure - Boat, RV, van, etc. ($)
Mean house or condo value by units in structure - Mobile home ($)
Median contract rent ($)
Median contract rent - Lower quartile ($)
Median contract rent - Upper quartile ($)
Median gross rent ($)
Urban houses (%)
Rural houses (%)
Houses occupied (%)
Houses occupied (% change since 2000)
Houses owner occupied (%)
Houses owner occupied (% change since 2000)
Houses renter occupied (%)
Houses renter occupied (% change since 2000)
Vacant housing units - For rent (%)
Vacant housing units - For rent (% change since 2000)
Vacant housing units - For sale only (%)
Vacant housing units - For sale only (% change since 2000)
Vacant housing units - Rented or sold, not occupied (%)
Vacant housing units - Rented or sold, not occupied (% change since 2000)
Vacant housing units - For seasonal, recreational, or occasional use (%)
Vacant housing units - For seasonal, recreational, or occasional use (% change since 2000)
Vacant housing units - For migrant workers (%)
Vacant housing units - For migrant workers (% change since 2000)
Vacant housing units - Other vacant (%)
Vacant housing units - Other vacant (% change since 2000)
Median monthly housing costs ($)
Median household income for houses/condos with a mortgage ($)
Median household income for houses/condos without a mortgage ($)
Median household income ($)
Median household income ($) - White
Median household income ($) - Black or African American
Median household income ($) - Asian
Median household income ($) - Hispanic or Latino
Median household income ($) - American Indian and Alaska Native
Median household income ($) - Multirace
Median household income ($) - Other Race
Mortgage status - with mortgage (%)
Mortgage status - with second mortgage (%)
Mortgage status - with home equity loan (%)
Mortgage status - with both second mortgage and home equity loan (%)
Mortgage status - without a mortgage (%)
Median year house/condo built
Median year apartment built
Household type by relationship - Male householder living alone (%)
Household type by relationship - Male householder not living alone (%)
Household type by relationship - Female householder living alone (%)
Household type by relationship - Female householder not living alone (%)
Household type by relationship - Opposite-Sex spouse (%)
Household type by relationship - Same-Sex spouse (%)
Household type by relationship - Opposite-Sex unmarried partner (%)
Household type by relationship - Same-Sex unmarried partner (%)
Household type by relationship - In group quarters (%)
Size of family households - 2-person household (%)
Size of family households - 3-person household (%)
Size of family households - 4-person household (%)
Size of family households - 5-person household (%)
Size of family households - 6-person household (%)
Size of family households - 7-or-more-person household (%)
Size of nonfamily households - 1-person household (%)
Size of nonfamily households - 2-person household (%)
Size of nonfamily households - 3-person household (%)
Size of nonfamily households - 4-person household (%)
Size of nonfamily households - 5-person household (%)
Size of nonfamily households - 6-person household (%)
Size of nonfamily households - 7-or-moreperson household (%)
Year house built - Built 2010 or later (%)
Year house built - Built 2000 to 2009 (%)
Year house built - Built 1990 to 1999 (%)
Year house built - Built 1980 to 1989 (%)
Year house built - Built 1970 to 1979 (%)
Year house built - Built 1960 to 1969 (%)
Year house built - Built 1950 to 1959 (%)
Year house built - Built 1940 to 1949 (%)
Year house built - Built 1939 or earlier (%)
Median number of rooms in houses and condos
Median number of rooms in apartments
Median number of bedrooms in owner occupied houses
Mean number of bedrooms in owner occupied houses
Median number of bedrooms in renter occupied houses
Mean number of bedrooms in renter occupied houses
Median number of vehichles in owner occupied houses
Mean number of vehichles in owner occupied houses
Median number of vehichles in renter occupied houses
Mean number of vehichles in renter occupied houses
Rooms in owner-occupied houses - 1 room (%)
Rooms in owner-occupied houses - 2 rooms (%)
Rooms in owner-occupied houses - 3 rooms (%)
Rooms in owner-occupied houses - 4 rooms (%)
Rooms in owner-occupied houses - 5 rooms (%)
Rooms in owner-occupied houses - 6 rooms (%)
Rooms in owner-occupied houses - 7 rooms (%)
Rooms in owner-occupied houses - 8 rooms (%)
Rooms in owner-occupied houses - 9+ rooms (%)
Rooms in renter-occupied houses - 1 room (%)
Rooms in renter-occupied houses - 2 rooms (%)
Rooms in renter-occupied houses - 3 rooms (%)
Rooms in renter-occupied houses - 4 rooms (%)
Rooms in renter-occupied houses - 5 rooms (%)
Rooms in renter-occupied houses - 6 rooms (%)
Rooms in renter-occupied houses - 7 rooms (%)
Rooms in renter-occupied houses - 8 rooms (%)
Rooms in renter-occupied houses - 9+ rooms (%)
Bedrooms in owner-occupied houses - no bedrooms (%)
Bedrooms in owner-occupied houses - 1 bedroom (%)
Bedrooms in owner-occupied houses - 2 bedrooms (%)
Bedrooms in owner-occupied houses - 3 bedrooms (%)
Bedrooms in owner-occupied houses - 4 bedrooms (%)
Bedrooms in owner-occupied houses - 5+ bedrooms (%)
Bedrooms in renter-occupied houses - no bedrooms (%)
Bedrooms in renter-occupied houses - 1 bedroom (%)
Bedrooms in renter-occupied houses - 2 bedrooms (%)
Bedrooms in renter-occupied houses - 3 bedrooms (%)
Bedrooms in renter-occupied houses - 4 bedrooms (%)
Bedrooms in renter-occupied houses - 5+ bedrooms (%)
Vehicles available in owner-occupied houses - no vehicle available (%)
Vehicles available in owner-occupied houses - 1 vehicle available(%)
Vehicles available in owner-occupied houses - 2 Vehicles available (%)
Vehicles available in owner-occupied houses - 3 Vehicles available (%)
Vehicles available in owner-occupied houses - 4 Vehicles available (%)
Vehicles available in owner-occupied houses - 5+ Vehicles available (%)
Vehicles available in renter-occupied houses - no vehicle available (%)
Vehicles available in renter-occupied houses - 1 vehicle available (%)
Vehicles available in renter-occupied houses - 2 Vehicles available (%)
Vehicles available in renter-occupied houses - 3 Vehicles available (%)
Vehicles available in renter-occupied houses - 4 Vehicles available (%)
Vehicles available in renter-occupied houses - 5+ Vehicles available (%)
Housing units in structures - 1, detached (%)
Housing units in structures - 1, attached (%)
Housing units in structures - 2 (%)
Housing units in structures - 3 or 4 (%)
Housing units in structures - 5 to 9 (%)
Housing units in structures - 10 to 19 (%)
Housing units in structures - 20 to 49 (%)
Housing units in structures - 50 or more (%)
Housing units in structures - Mobile home (%)
Housing units in structures - Boat, RV, van, etc. (%)
Housing units in structures - Owners - 1, detached (%)
Housing units in structures - Owners - 1, attached (%)
Housing units in structures - Owners - 2 (%)
Housing units in structures - Owners - 3 or 4 (%)
Housing units in structures - Owners - 5 to 9 (%)
Housing units in structures - Owners - 10 to 19 (%)
Housing units in structures - Owners - 20 to 49 (%)
Housing units in structures - Owners - 50 or more (%)
Housing units in structures - Owners - Mobile home (%)
Housing units in structures - Owners - Boat, RV, van, etc. (%)
Housing units in structures - Renters - 1, detached (%)
Housing units in structures - Renters - 1, attached (%)
Housing units in structures - Renters - 2 (%)
Housing units in structures - Renters - 3 or 4 (%)
Housing units in structures - Renters - 5 to 9 (%)
Housing units in structures - Renters - 10 to 19 (%)
Housing units in structures - Renters - 20 to 49 (%)
Housing units in structures - Renters - 50 or more (%)
Housing units in structures - Renters - Mobile home (%)
Housing units in structures - Renters - Boat, RV, van, etc. (%)
House/condo owner moved in on average (years ago)
Renter moved in on average (years ago)
Year householder moved into unit - Moved in 1999 to March 2000 (%)
Year householder moved into unit - Moved in 1999 to March 2000 (%) - White
Year householder moved into unit - Moved in 1999 to March 2000 (%) - Black or African American
Year householder moved into unit - Moved in 1999 to March 2000 (%) - Asian
Year householder moved into unit - Moved in 1999 to March 2000 (%) - Hispanic or Latino
Year householder moved into unit - Moved in 1999 to March 2000 (%) - American Indian and Alaska Native
Year householder moved into unit - Moved in 1999 to March 2000 (%) - Multirace
Year householder moved into unit - Moved in 1999 to March 2000 (%) - Other Race
Year householder moved into unit - Moved in 1995 to 1998 (%)
Year householder moved into unit - Moved in 1995 to 1998 (%) - White
Year householder moved into unit - Moved in 1995 to 1998 (%) - Black or African American
Year householder moved into unit - Moved in 1995 to 1998 (%) - Asian
Year householder moved into unit - Moved in 1995 to 1998 (%) - Hispanic or Latino
Year householder moved into unit - Moved in 1995 to 1998 (%) - American Indian and Alaska Native
Year householder moved into unit - Moved in 1995 to 1998 (%) - Multirace
Year householder moved into unit - Moved in 1995 to 1998 (%) - Other Race
Year householder moved into unit - Moved in 1990 to 1994 (%)
Year householder moved into unit - Moved in 1990 to 1994 (%) - White
Year householder moved into unit - Moved in 1990 to 1994 (%) - Black or African American
Year householder moved into unit - Moved in 1990 to 1994 (%) - Asian
Year householder moved into unit - Moved in 1990 to 1994 (%) - Hispanic or Latino
Year householder moved into unit - Moved in 1990 to 1994 (%) - American Indian and Alaska Native
Year householder moved into unit - Moved in 1990 to 1994 (%) - Multirace
Year householder moved into unit - Moved in 1990 to 1994 (%) - Other Race
Year householder moved into unit - Moved in 1980 to 1989 (%)
Year householder moved into unit - Moved in 1980 to 1989 (%) - White
Year householder moved into unit - Moved in 1980 to 1989 (%) - Black or African American
Year householder moved into unit - Moved in 1980 to 1989 (%) - Asian
Year householder moved into unit - Moved in 1980 to 1989 (%) - Hispanic or Latino
Year householder moved into unit - Moved in 1980 to 1989 (%) - American Indian and Alaska Native
Year householder moved into unit - Moved in 1980 to 1989 (%) - Multirace
Year householder moved into unit - Moved in 1980 to 1989 (%) - Other Race
Year householder moved into unit - Moved in 1970 to 1979 (%)
Year householder moved into unit - Moved in 1970 to 1979 (%) - White
Year householder moved into unit - Moved in 1970 to 1979 (%) - Black or African American
Year householder moved into unit - Moved in 1970 to 1979 (%) - Asian
Year householder moved into unit - Moved in 1970 to 1979 (%) - Hispanic or Latino
Year householder moved into unit - Moved in 1970 to 1979 (%) - American Indian and Alaska Native
Year householder moved into unit - Moved in 1970 to 1979 (%) - Multirace
Year householder moved into unit - Moved in 1970 to 1979 (%) - Other Race
Year householder moved into unit - Moved in 1969 or earlier (%)
Year householder moved into unit - Moved in 1969 or earlier (%) - White
Year householder moved into unit - Moved in 1969 or earlier (%) - Black or African American
Year householder moved into unit - Moved in 1969 or earlier (%) - Asian
Year householder moved into unit - Moved in 1969 or earlier (%) - Hispanic or Latino
Year householder moved into unit - Moved in 1969 or earlier (%) - American Indian and Alaska Native
Year householder moved into unit - Moved in 1969 or earlier (%) - Multirace
Year householder moved into unit - Moved in 1969 or earlier (%) - Other Race
Housing units lacking complete plumbing facilities (%)
Housing units lacking complete kitchen facilities (%)
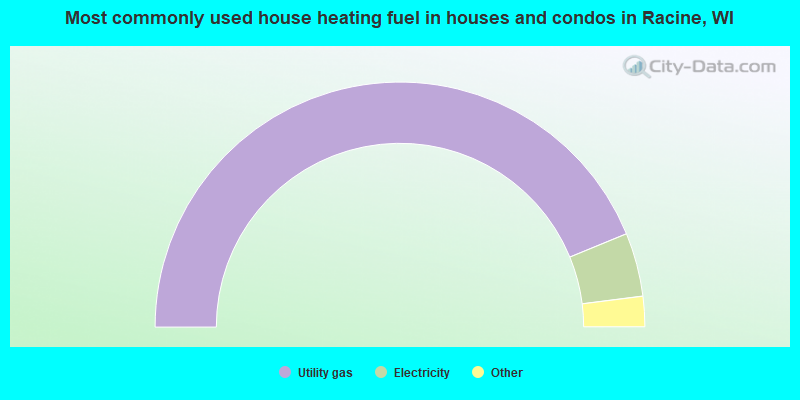
House heating fuel used in houses and condos - Utility gas (%)
House heating fuel used in houses and condos - Bottled, tank, or LP gas (%)
House heating fuel used in houses and condos - Electricity (%)
House heating fuel used in houses and condos - Fuel oil, kerosene, etc. (%)
House heating fuel used in houses and condos - Coal or coke (%)
House heating fuel used in houses and condos - Wood (%)
House heating fuel used in houses and condos - Solar energy (%)
House heating fuel used in houses and condos - Other fuel (%)
House heating fuel used in houses and condos - No fuel used (%)
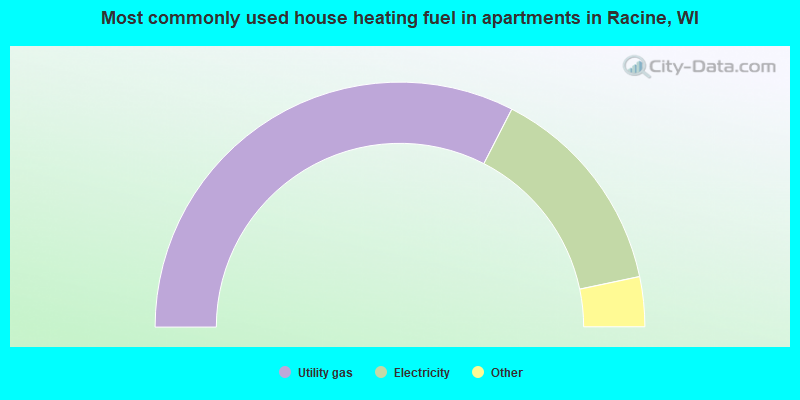
House heating fuel used in apartments - Utility gas (%)
House heating fuel used in apartments - Bottled, tank, or LP gas (%)
House heating fuel used in apartments - Electricity (%)
House heating fuel used in apartments - Fuel oil, kerosene, etc. (%)
House heating fuel used in apartments - Coal or coke (%)
House heating fuel used in apartments - Wood (%)
House heating fuel used in apartments - Solar energy (%)
House heating fuel used in apartments - Other fuel (%)
House heating fuel used in apartments - No fuel used (%)
Latest news about housing in Racine, WI collected exclusively by city-data.com from local newspapers, TV, and radio stations
Median year house/condo built: 1954Median year apartment built: 1955Household type by relationship:
Households: 76,455
Male householders: 13,388 (6,068 living alone ), Female householders: 17,875 (6,217 living alone )10,268 spouses (10,212 opposite-sex spouses ), 3,868 unmarried partners , (3,705 opposite-sex unmarried partners ), 24,330 children (20,457 natural , 655 adopted , 3,218 stepchildren ), 1,941 grandchildren , 1,076 brothers or sisters , 478 parents , 0 foster children , 999 other relatives , 1,294 non-relatives In group quarters: 938
Size of family households: 7,409 2-persons , 4,884 3-persons , 2,256 4-persons , 1,811 5-persons , 431 6-persons , 541 7-or-more-persons .
Size of nonfamily households: 12,285 1-person , 1,588 2-persons , 58 6-persons .
7,750 married couples with children. single-parent households (2,244 men , 8,063 women ).
85.7% of residents of Racine speak English at home. of residents speak Spanish at home (63% speak English very well , 13% speak English well , 15% speak English not well , 9% don't speak English at all ).of residents speak other Indo-European language at home (83% speak English very well , 14% speak English well , 3% speak English not well ).of residents speak Asian or Pacific Island language at home (59% speak English very well , 37% speak English well , 3% speak English not well , 1% don't speak English at all ).of residents speak other language at home (94% speak English very well , 6% speak English well ).
Foreign born population: 5,171 (6.8%)of them are naturalized citizens )
Median number of rooms in houses and condos:
Median number of rooms in apartments
Owner-occupied Renter-occupied
Rooms in owner-occupied houses in Racine, Wisconsin
0 1 room 69 2 rooms 243 3 rooms 2,394 4 rooms 5,068 5 rooms 5,149 6 rooms 3,028 7 rooms 1,549 8 rooms 2,372 9+ rooms
Rooms in renter-occupied apartments in Racine, Wisconsin
370 1 room 390 2 rooms 2,652 3 rooms 3,082 4 rooms 2,317 5 rooms 1,782 6 rooms 331 7 rooms 30 8 rooms 437 9+ rooms
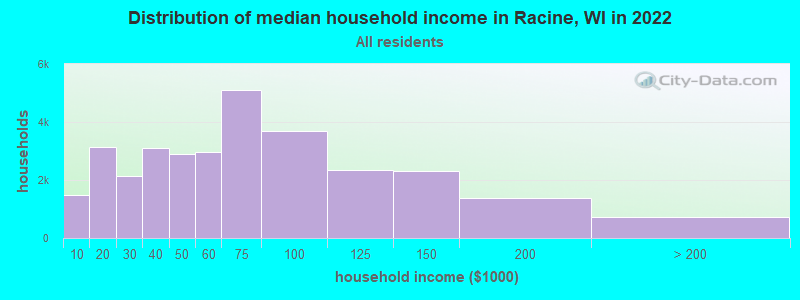
Racine, WI household income distribution 1,475 Less than $10,0003,134 $10,000 to $19,9992,146 $20,000 to $29,9993,120 $30,000 to $39,9992,889 $40,000 to $49,9992,966 $50,000 to $59,9995,116 $60,000 to $74,9993,701 $75,000 to $99,9992,341 $100,000 to $124,9992,297 $125,000 to $149,9991,366 $150,000 to $199,999712 $200,000 or more
Home value of owner - occupied houses in 2022 in Racine, WI 66 Less than $10,000105 $10,000 to $14,999210 $15,000 to $19,9999 $20,000 to $24,99931 $25,000 to $29,9999 $30,000 to $34,999139 $35,000 to $39,999292 $40,000 to $49,999206 $50,000 to $59,999624 $60,000 to $69,999464 $70,000 to $79,9991,056 $80,000 to $89,999375 $90,000 to $99,9993,400 $100,000 to $124,9992,581 $125,000 to $149,9993,313 $150,000 to $174,9991,348 $175,000 to $199,9991,542 $200,000 to $249,999767 $250,000 to $299,999670 $300,000 to $399,999364 $400,000 to $499,999149 $500,000 to $749,99970 $750,000 to $999,99928 $1,000,000 to $1,499,99998 $2,000,000 or moreRent paid by renters in 2022 in Racine, WI 35 Less than $10015 $100 to $149126 $150 to $199288 $200 to $249243 $250 to $299149 $300 to $349120 $350 to $399349 $400 to $449408 $450 to $499990 $500 to $549250 $550 to $599760 $600 to $6491,429 $650 to $699771 $700 to $749967 $750 to $7991,761 $800 to $8991,668 $900 to $9991,732 $1,000 to $1,249706 $1,250 to $1,499120 $1,500 to $1,99932 $2,000 to $2,4997 $2,500 to $2,999317 No cash rent
Percentage of workers working in this county: 70.6%Number of people working at home: 2,162 (6.2% of all workers )
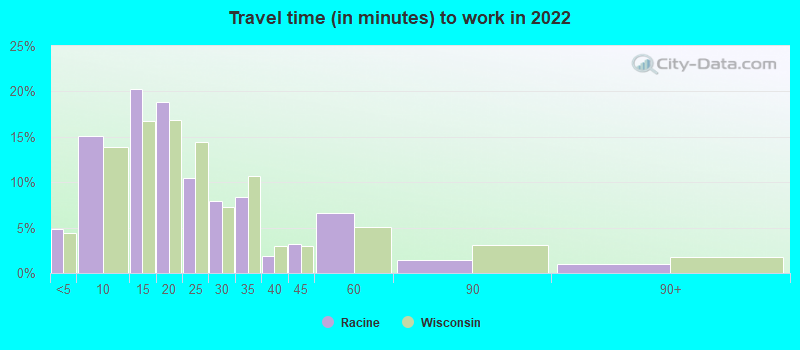
Travel time to work (commute)
Less than 5 minutes: 1,6355 to 9 minutes: 4,48010 to 14 minutes: 5,73915 to 19 minutes: 5,20720 to 24 minutes: 4,47525 to 29 minutes: 2,75930 to 34 minutes: 2,59635 to 39 minutes: 1,08740 to 44 minutes: 1,26645 to 59 minutes: 1,76660 to 89 minutes: 1,21490 or more minutes: 581
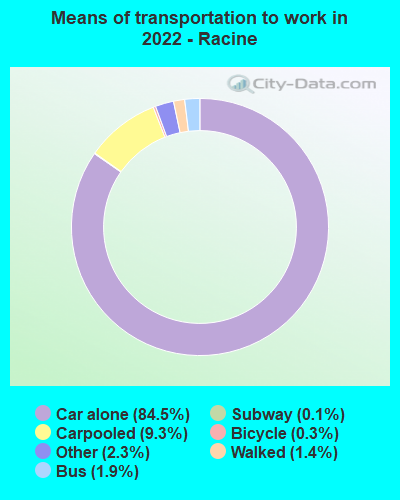
Means of transportation to work:
Drove a car alone: 23,748 (77.1%)Carpooled: 3,460 (11.2%)Bus : 540 (1.8%)Long-distance train or commuter rail : 23 (0.1%)Ferryboat: 17 (0.1%)Taxi: 756 (2.5%)Bicycle: 87 (0.3%)Walked: 475 (1.5%)Worked at home: 2,162 (7.0%)
Unemployment by race in 2022
Unemployment rate for White non-Hispanic residents 5.9% Males1.6% FemalesUnemployment rate for Black residents 14.7% Males6.9% FemalesUnemployment rate for American Indian and Alaska Native residents 8.3% FemalesUnemployment rate for Asian residents 18.3% Males12.8% FemalesUnemployment rate for other race residents 4.6% Males2.6% FemalesUnemployment rate for two or more race residents 5.2% Males1.7% FemalesUnemployment rate for Hispanic or Latino residents 4.1% Males5.3% Females
Year of entry for the foreign-born population in Racine, Wisconsin
995 2010 or later 1,373 2000 to 2009 1,163 1990 to 1999 877 1980 to 1989 669 1970 to 1979 806 Before 1970
First ancestries reported:
German: 5,095 (12.1%)
Polish: 1,369 (3.3%)
Irish: 1,349 (3.2%)
American: 897 (2.1%)
English: 797 (1.9%)
Italian: 759 (1.8%)
Danish: 666 (1.6%)
Norwegian: 469 (1.1%)
Scottish: 373 (0.9%)
European: 245 (0.6%)
Czech: 237 (0.6%)
French: 233 (0.6%)
French Canadian: 232 (0.6%)
African: 232 (0.6%)
Serbian: 215 (0.5%)
Swedish: 198 (0.5%)
Albanian: 196 (0.5%)
Scandinavian: 130 (0.3%)
Arab: 123 (0.3%)
Dutch: 96 (0.2%)
Greek: 93 (0.2%)
Croatian: 85 (0.2%)
Armenian: 76 (0.2%)
Lithuanian: 64 (0.2%)
Belgian: 62 (0.1%)
Canadian: 57 (0.1%)
Northern European: 54 (0.1%)
Ethiopian: 48 (0.1%)
Jamaican: 44 (0.1%)
Eastern European: 39 (0.09%)
Hungarian: 37 (0.09%)
Macedonian: 36 (0.09%)
British: 23 (0.05%)
Austrian: 18 (0.04%)
Russian: 18 (0.04%)
Czechoslovakian: 17 (0.04%)
Slovak: 16 (0.04%)
Finnish: 14 (0.03%)
Welsh: 14 (0.03%)
Scotch-Irish: 13 (0.03%)
Haitian: 13 (0.03%)
Brazilian: 11 (0.03%)
Swiss: 10 (0.02%)
Nigerian: 9 (0.02%)
Pennsylvania German: 8 (0.02%)
Slavic: 6 (0.01%)
Most common places of birth for foreign-born residents (%): Mexico Racine:
67.4% (3,252)Wisconsin:
29.5% (87,182)
Philippines Racine:
2.8% (137)Wisconsin:
3.1% (9,280)
Korea Racine:
2.6% (125)Wisconsin:
1.8% (5,320)
Canada Racine:
2.5% (119)Wisconsin:
2.3% (6,747)
China, excluding Hong Kong and Taiwan Racine:
2.0% (95)Wisconsin:
5.1% (15,165)
Guatemala Racine:
1.9% (91)Wisconsin:
1.0% (2,903)
Germany Racine:
1.8% (86)Wisconsin:
3.0% (8,773)
India Racine:
1.6% (79)Wisconsin:
8.0% (23,594)
Serbia Racine:
1.6% (75)Wisconsin:
0.3% (802)
Place of birth for U.S.-born residents:
This state: 54,404Other state: 15,327Northeast: 617Midwest: 10,312South: 3,487West: 911 83.9% of Racine residents lived in the same house 1 years ago.
Out of people who lived in different houses, 41.1% lived in this county.
Out of people who lived in different counties, 80.3% lived in Wisconsin.
Racine:
83.9%State average:
87.7%
Education attainment for males 25 years and older:
No schooling: 508Nursery to 4th grade: 7765th and 6th grade: 7607th and 8th grade: 3239th grade: 48410th grade: 11711th grade: 36212th grade, no diploma: 1,207High school graduate (or equivalency): 7,147Less than 1 year of college: 2,094Some college more than 1 year, no degree: 3,298Associate degree: 1,907Bachelor's degree: 3,441Master's degree: 878Professional school degree: 278Doctorate degree: 123
Education attainment for females 25 years and older:
No schooling: 119Nursery to 4th grade: 7485th and 6th grade: 6177th and 8th grade: 4019th grade: 18010th grade: 5811th grade: 1,13312th grade, no diploma: 162High school graduate (or equivalency): 7,331Less than 1 year of college: 2,026Some college more than 1 year, no degree: 4,541Associate degree: 2,463Bachelor's degree: 4,156Master's degree: 2,004Professional school degree: 140Doctorate degree: 0
Housing units in structures:
One, detached: 21,791One, attached: 595Two: 4,7773 or 4: 1,2425 to 9: 1,72410 to 19: 1,08720 to 49: 1,24750 or more: 1,639Mobile homes: 84Boats, RVs, vans, etc.: 124Housing units lacking complete plumbing facilities in 2022: 0.6%Housing units lacking complete kitchen facilities in 2022: 1.4%House/condo owner moved in on average 13 years ago
Renter moved in on average 3 years ago
Private vs. public school enrollment:
Students in private schools in grades 1 to 8 (elementary and middle school): 1,439 Here:
17.3%Wisconsin:
16.7%
Students in private schools in grades 9 to 12 (high school): 463 Students in private undergraduate colleges: 272