Quincy, MA (Massachusetts) Houses and Residents
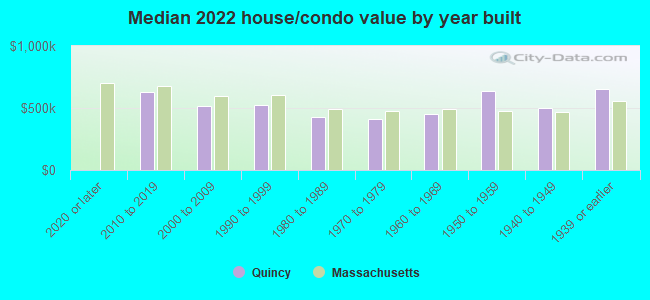
| Quincy: | $596,900 |
| Massachusetts: | $534,700 |
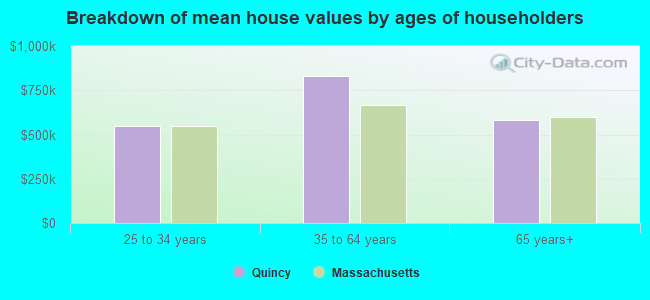
Mean price in 2022:
Detached houses: $711,544
Here: $711,544 State: $651,570 Townhouses or other attached units: $634,922
Here: $634,922 State: $617,749 In 2-unit structures: $588,613
Here: $588,613 State: $594,808 In 3-to-4-unit structures: $963,488
Here: $963,488 State: $601,912 In 5-or-more-unit structures: $432,582
Here: $432,582 State: $555,768 Mobile homes: $252,831
Here: $252,831 State: $170,209
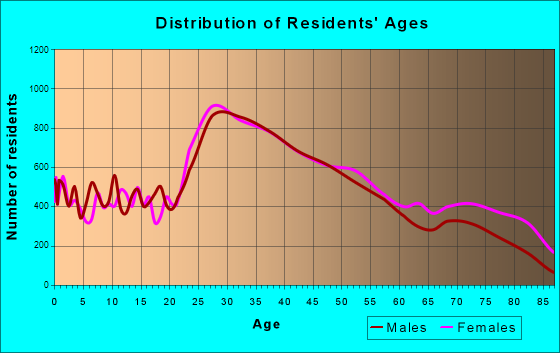
Total population: 93,397 (Urban population: 88,025, Rural population: 0)
Houses: 51,156 (46,789 occupied: 22,498 owner occupied, 24,291 renter occupied)
| % of renters here: | 52% |
| State: | 38% |
Housing density: 3,048 houses/condos per square mile
Median price asked for vacant for-sale houses and condos in 2022: $740,923.
Median contract rent in 2022: $1,759 (lower quartile is $1,236, upper quartile is over $2,000)
Median rent asked for vacant for-rent units in 2022: $2,625
Median gross rent in Quincy, MA in 2022: $1,885
Housing units in Quincy with a mortgage: 12,591 (1,369 second mortgage, 0 home equity loan, 1,271 both second mortgage and home equity loan)
Houses without a mortgage: 699
Median household income for houses/condos with a mortgage: $120,858
Median household income for apartments without a mortgage: $104,264
Median monthly housing costs: $1,828
Compare current foreclosures in Quincy, MA:
| Photo | Address | Area | Beds / Baths | Price | Details |
|---|---|---|---|---|---|

|
#1
Kendrick Ave Apt 307
Quincy, MA 02169
|
1,234 sq. feet
|
2 baths 2 beds |
show details | |

|
#2
Ballou St
Quincy, MA 02169
|
1,758 sq. feet
|
1 baths 3 beds |
show details | |

|
#3
Grand View Ave Apt 3b
Quincy, MA 02170
|
655 sq. feet
|
1 baths 1 beds |
show details | |

|
#4
Willard St Unit 402
Quincy, MA 02169
|
1,198 sq. feet
|
2 baths 2 beds |
show details | |

|
#5
Wilson Ave
Quincy, MA 02170
|
1,176 sq. feet
|
1 baths 3 beds |
show details | |

|
#6
Union St
Quincy, MA 02169
|
1,705 sq. feet
|
2 baths 4 beds |
show details | |

|
#7
Shennen St
Quincy, MA 02169
|
952 sq. feet
|
1 baths 2 beds |
show details | |

|
#8
Crescent St
Quincy, MA 02169
|
2,032 sq. feet
|
2 baths 4 beds |
show details | |

|
#9
Albatross Rd
Quincy, MA 02169
|
1,920 sq. feet
|
1 baths 4 beds |
show details | |

|
#10
Grand View Ave
Quincy, MA 02170
|
5,036 sq. feet
|
3 baths 7 beds |
show details |
| Photo | Address | Area | Beds / Baths | Price | Details |
|---|---|---|---|---|---|

|
#11
Ames St
Quincy, MA 02169
|
2,043 sq. feet
|
1 baths 3 beds |
show details | |

|
#12
Flynt St
Quincy, MA 02171
|
2,834 sq. feet
|
2 baths 3 beds |
show details | |

|
#13
Quincy Shore Dr Unit 131
Quincy, MA 02171
|
1,488 sq. feet
|
2 baths 2 beds |
show details | |

|
#14
Hatherly Rd
Quincy, MA 02170
|
1,911 sq. feet
|
3 baths 4 beds |
show details | |

|
#15
Algonquin Rd
Quincy, MA 02169
|
1,515 sq. feet
|
1 baths 2 beds |
show details | |

|
#16
Suomi Rd
Quincy, MA 02169
|
895 sq. feet
|
2 baths 2 beds |
show details | |

|
#17
Elliot Ave
Quincy, MA 02171
|
800 sq. feet
|
1 baths 2 beds |
show details | |

|
#18
Quincy Shore Dr
Quincy, MA 02171
|
1,872 sq. feet
|
1 baths 3 beds |
show details | |

|
#19
Richfield St
Quincy, MA 02171
|
1,368 sq. feet
|
1 baths 3 beds |
show details | |

|
#20
Commander Shea Blvd Apt 207
Quincy, MA 02171
|
644 sq. feet
|
1 baths 1 beds |
show details |
| Photo | Address | Area | Beds / Baths | Price | Details |
|---|---|---|---|---|---|

|
#21
Bower Rd
Quincy, MA 02169
|
1,100 sq. feet
|
2 baths 3 beds |
show details | |

|
#22
Atlantic St
Quincy, MA 02171
|
3,226 sq. feet
|
2 baths 8 beds |
show details | |

|
#23
Hodgkinson St
Quincy, MA 02169
|
1,296 sq. feet
|
1 baths 3 beds |
show details | |

|
#24
Overlook Rd
Quincy, MA 02169
|
1,714 sq. feet
|
1 baths 1 beds |
show details | |

|
#25
Standish Ave
Quincy, MA 02170
|
1,110 sq. feet
|
1 baths 2 beds |
show details | |

|
#26
Suomi 79a
Quincy, MA 02169
|
895 sq. feet
|
2 baths 2 beds |
show details | |

|
#27
Quarry St Apt 700
Quincy, MA 02169
|
1,436 sq. feet
|
1 baths 3 beds |
show details | |

|
#28
W Squantum St # 2
Quincy, MA 02171
|
3,952 sq. feet
|
4 baths 8 beds |
show details | |

|
#29
Quarry St Apt 700
Quincy, MA 02169
|
1,436 sq. feet
|
1 baths 3 beds |
show details | |

|
#30
Suomi Rd # 81a
Quincy, MA 02169
|
895 sq. feet
|
2 baths 2 beds |
show details |
| Photo | Address | Area | Beds / Baths | Price | Details |
|---|---|---|---|---|---|

|
#31
Montclair Ave
Quincy, MA 02171
|
1,216 sq. feet
|
1 baths 3 beds |
show details | |

|
#32
Glenview Rd
Quincy, MA 02169
|
1,044 sq. feet
|
1 baths 2 beds |
show details | |

|
#33
Surfside Ln
Quincy, MA 02171
|
2,594 sq. feet
|
2 baths 4 beds |
show details | |

|
#34
Sea St # 2
Quincy, MA 02169
|
762 sq. feet
|
1 baths 2 beds |
show details | |

|
#35
Lyons St
Quincy, MA 02169
|
1,125 sq. feet
|
1 baths 3 beds |
show details | |

|
#36
Charlesmount Ave
Quincy, MA 02169
|
1,080 sq. feet
|
1 baths 3 beds |
show details | |

|
#37
Stewart St
Quincy, MA 02169
|
1,142 sq. feet
|
1 baths 3 beds |
show details | |

|
#38
Franklin St Unit 205
Quincy, MA 02169
|
1,231 sq. feet
|
2 baths 2 beds |
show details | |

|
#39
Copeland St
Quincy, MA 02169
|
1,216 sq. feet
|
1 baths 3 beds |
show details | |

|
#40
South St
Quincy, MA 02169
|
2,905 sq. feet
|
4 baths 8 beds |
show details |
| Photo | Address | Area | Beds / Baths | Price | Details |
|---|---|---|---|---|---|

|
#41
French St Apt 32
Quincy, MA 02171
|
- sq. feet
|
- baths - beds |
show details | |

|
#42
Thomas Burgin Pkwy, Apt 265
Quincy, MA 02169
|
- sq. feet
|
- baths - beds |
show details | |

|
#43
Newbury Ave # 16
Quincy, MA 02171
|
- sq. feet
|
- baths - beds |
show details | |

|
#44
Rogers St # A
Quincy, MA 02169
|
- sq. feet
|
- baths - beds |
show details | |

|
#45
Dayton St
Quincy, MA 02169
|
- sq. feet
|
- baths - beds |
show details | |

|
#46
Taffrail Rd Apt 4
Quincy, MA 02169
|
- sq. feet
|
- baths - beds |
show details | |

|
#47
Apthorp St
Quincy, MA 02170
|
- sq. feet
|
- baths - beds |
show details | |

|
#48
Rhoda St
Quincy, MA 02169
|
- sq. feet
|
- baths - beds |
show details | |

|
#49
Hancock St Apt 902
Quincy, MA 02171
|
- sq. feet
|
- baths - beds |
show details | |

|
Check over 1 million property listings on Foreclosure.com!
|
browse all offers | |||

Latest news about housing in Quincy, MA collected exclusively by city-data.com from local newspapers, TV, and radio stations


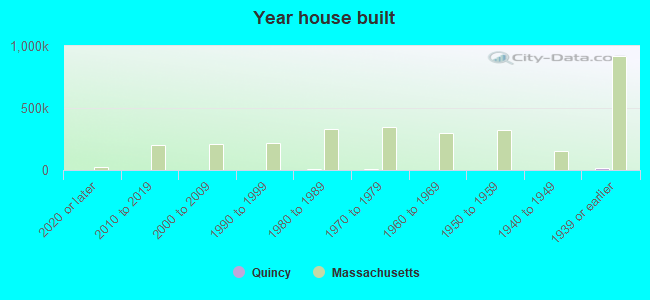
Median year apartment built: 1976
Household type by relationship:
Households: 101,716- Male householders: 23,798 (8,072 living alone), Female householders: 22,991 (10,208 living alone)
18,163 spouses (17,801 opposite-sex spouses), 3,379 unmarried partners, (3,035 opposite-sex unmarried partners), 23,064 children (22,659 natural, 149 adopted, 256 stepchildren), 723 grandchildren, 2,619 brothers or sisters, 2,568 parents, 0 foster children, 975 other relatives, 1,824 non-relatives
- In group quarters: 1,612
Size of family households: 10,381 2-persons, 6,740 3-persons, 5,389 4-persons, 1,751 5-persons, 622 6-persons, 51 7-or-more-persons.
Size of nonfamily households: 18,280 1-person, 3,450 2-persons, 45 3-persons, 80 4-persons.
10,149 married couples with children.
3,028 single-parent households (725 men, 2,303 women).
60.8% of residents of Quincy speak English at home.
3.9% of residents speak Spanish at home (68% speak English very well, 22% speak English well, 9% speak English not well, 1% don't speak English at all).
9.3% of residents speak other Indo-European language at home (63% speak English very well, 25% speak English well, 9% speak English not well, 3% don't speak English at all).
25.0% of residents speak Asian or Pacific Island language at home (36% speak English very well, 26% speak English well, 25% speak English not well, 12% don't speak English at all).
2.3% of residents speak other language at home (64% speak English very well, 29% speak English well, 4% speak English not well, 2% don't speak English at all).
Foreign born population: 36,052 (35.4%)
(56.6% of them are naturalized citizens)
| Here: | 5.7 |
| State: | 6.5 |
| Here: | 3.6 |
| State: | 4.0 |
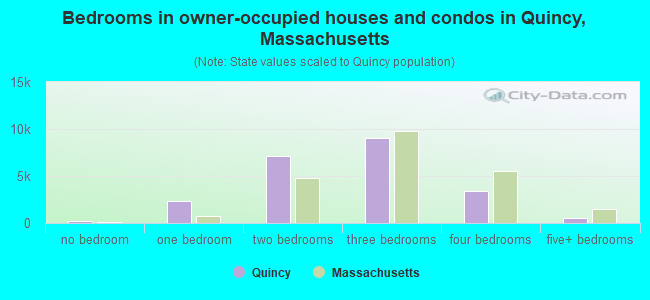
- Bedrooms in owner-occupied houses and condos in Quincy, Massachusetts
- 228no bedroom
- 2,2901 bedroom
- 7,0762 bedrooms
- 9,0113 bedrooms
- 3,3674 bedrooms
- 5265+ bedrooms
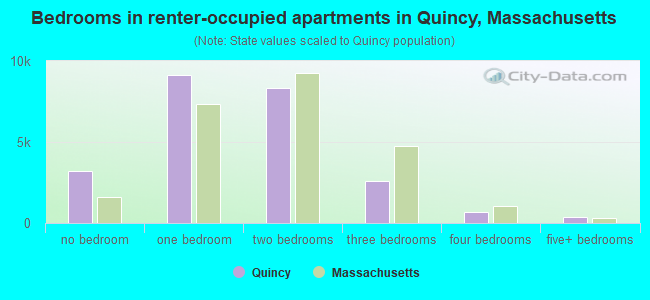
- Bedrooms in renter-occupied apartments in Quincy, Massachusetts
- 3,192no bedroom
- 9,1431 bedroom
- 8,3502 bedrooms
- 2,5673 bedrooms
- 6584 bedrooms
- 3815+ bedrooms
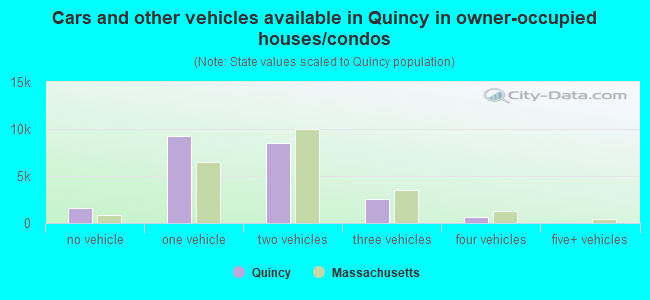
- Cars and other vehicles available in Quincy in owner-occupied houses/condos
- 1,583no vehicle
- 9,2381 vehicle
- 8,5382 vehicles
- 2,5403 vehicles
- 5994 vehicles
- 05+ vehicles
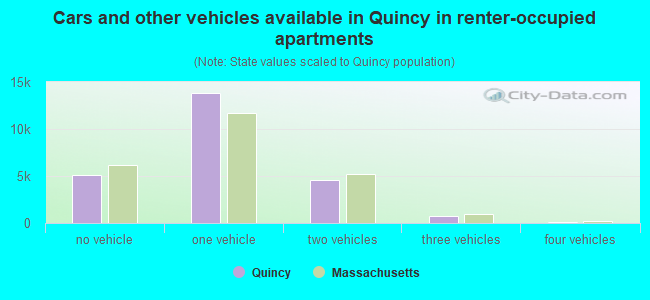
- Cars and other vehicles available in Quincy in renter-occupied apartments
- 5,088no vehicle
- 13,8561 vehicle
- 4,5602 vehicles
- 7113 vehicles
- 764 vehicles
- 05+ vehicles
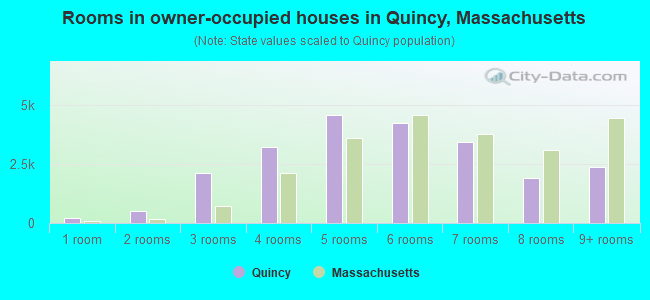
- Rooms in owner-occupied houses in Quincy, Massachusetts
- 2281 room
- 5162 rooms
- 2,1133 rooms
- 3,2134 rooms
- 4,5395 rooms
- 4,2276 rooms
- 3,4227 rooms
- 1,8878 rooms
- 2,3539+ rooms
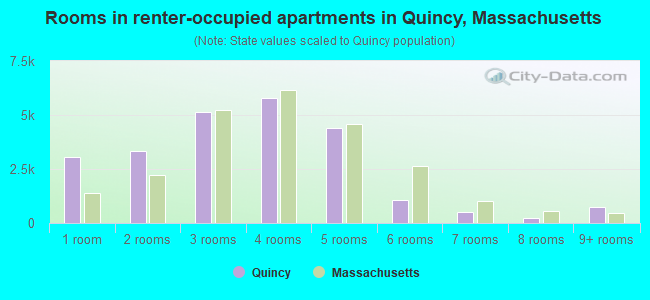
- Rooms in renter-occupied apartments in Quincy, Massachusetts
- 3,0561 room
- 3,3352 rooms
- 5,1523 rooms
- 5,8034 rooms
- 4,4155 rooms
- 1,0646 rooms
- 5197 rooms
- 2178 rooms
- 7309+ rooms
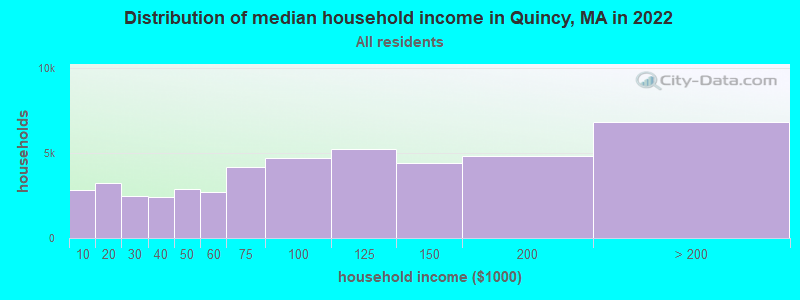
Quincy, MA household income distribution

- 2,841Less than $10,000
- 3,262$10,000 to $19,999
- 2,447$20,000 to $29,999
- 2,428$30,000 to $39,999
- 2,901$40,000 to $49,999
- 2,735$50,000 to $59,999
- 4,162$60,000 to $74,999
- 4,720$75,000 to $99,999
- 5,231$100,000 to $124,999
- 4,401$125,000 to $149,999
- 4,826$150,000 to $199,999
- 6,835$200,000 or more
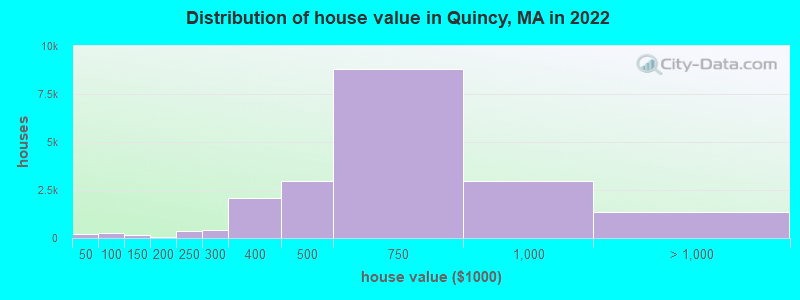
Home value of owner - occupied houses in 2022 in Quincy, MA
-
- 36Less than $10,000
- 12$15,000 to $19,999
- 76$35,000 to $39,999
- 85$40,000 to $49,999
- 83$50,000 to $59,999
- 52$60,000 to $69,999
- 37$70,000 to $79,999
- 25$80,000 to $89,999
- 125$100,000 to $124,999
- 22$125,000 to $149,999
- 23$150,000 to $174,999
- 29$175,000 to $199,999
- 370$200,000 to $249,999
- 414$250,000 to $299,999
- 2,075$300,000 to $399,999
- 2,980$400,000 to $499,999
- 8,792$500,000 to $749,999
- 2,992$750,000 to $999,999
- 766$1,000,000 to $1,499,999
- 185$1,500,000 to $1,999,999
- 418$2,000,000 or more
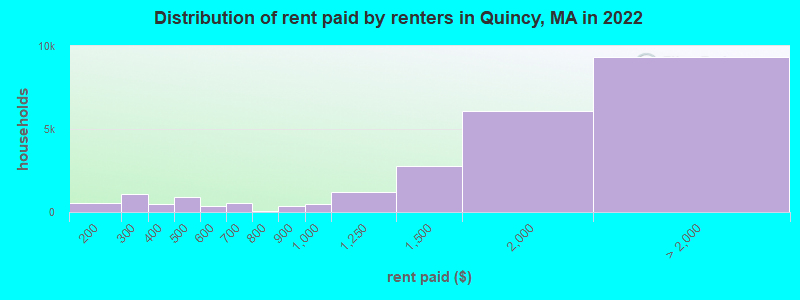
Rent paid by renters in 2022 in Quincy, MA
-
- 42Less than $100
- 166$100 to $149
- 355$150 to $199
- 718$200 to $249
- 357$250 to $299
- 427$300 to $349
- 69$350 to $399
- 258$400 to $449
- 656$450 to $499
- 251$500 to $549
- 87$550 to $599
- 571$600 to $649
- 55$700 to $749
- 370$800 to $899
- 512$900 to $999
- 1,198$1,000 to $1,249
- 2,794$1,250 to $1,499
- 6,095$1,500 to $1,999
- 5,196$2,000 to $2,499
- 2,694$2,500 to $2,999
- 460$3,000 to $3,499
- 766$3,500 or more
- 194No cash rent
Percentage of workers working in this county: 55.0%
Number of people working at home: 10,836 (18.8% of all workers)
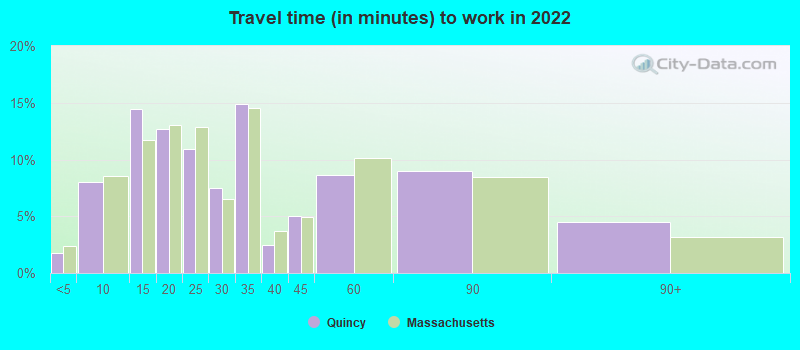
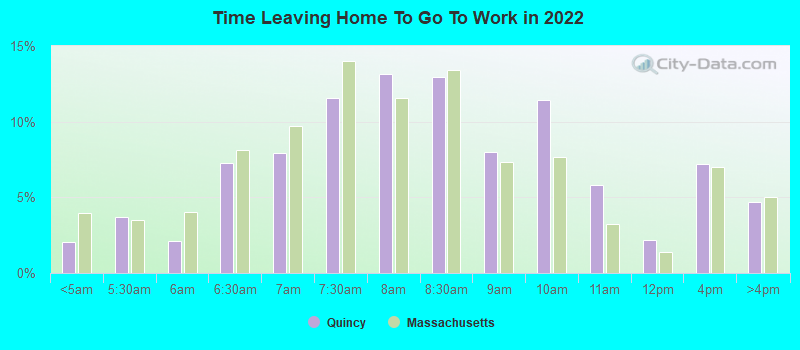
Travel time to work (commute)
- Less than 5 minutes: 1,061
- 5 to 9 minutes: 2,574
- 10 to 14 minutes: 5,910
- 15 to 19 minutes: 4,284
- 20 to 24 minutes: 3,372
- 25 to 29 minutes: 1,928
- 30 to 34 minutes: 7,011
- 35 to 39 minutes: 1,829
- 40 to 44 minutes: 3,304
- 45 to 59 minutes: 8,122
- 60 to 89 minutes: 5,588
- 90 or more minutes: 2,128
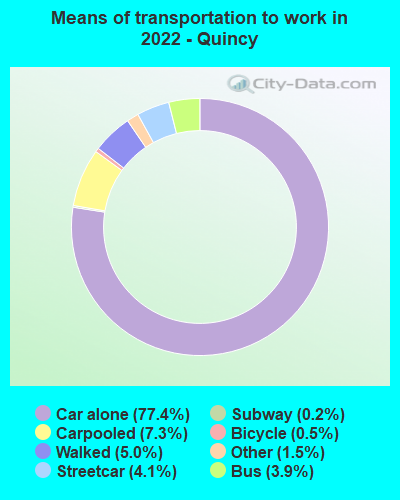
Means of transportation to work:
- Drove a car alone: 28,524 (60.1%)
- Carpooled: 2,645 (5.6%)
- Bus: 1,097 (2.3%)
- Subway or elevated rail: 1,460 (3.1%)
- Long-distance train or commuter rail: 89 (0.2%)
- Light rail, streetcar or trolley: 10 (0.0%)
- Taxi: 600 (1.3%)
- Bicycle: 120 (0.3%)
- Walked: 1,751 (3.7%)
- Worked at home: 10,836 (22.8%)
- Unemployment by race in 2022
- Unemployment rate for White non-Hispanic residents
- 7.8%Males
- 1.8%Females
- Unemployment rate for Black residents
- 21.1%Males
- 12.6%Females
- Unemployment rate for Asian residents
- 1.2%Males
- Unemployment rate for other race residents
- 5.6%Males
- 9.1%Females
- Unemployment rate for two or more race residents
- 2.2%Males
- 0.6%Females
- Unemployment rate for Hispanic or Latino residents
- 2.1%Males
- 3.2%Females
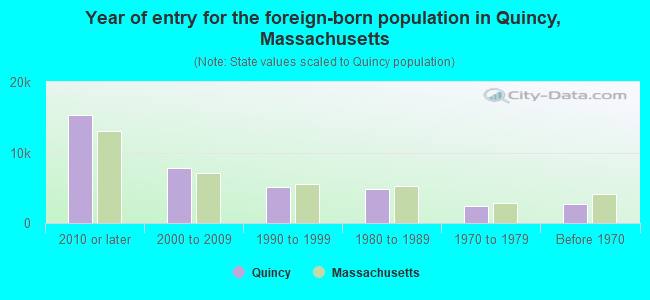
- Year of entry for the foreign-born population in Quincy, Massachusetts
- 15,3122010 or later
- 7,8542000 to 2009
- 5,0361990 to 1999
- 4,8121980 to 1989
- 2,3601970 to 1979
- 2,659Before 1970
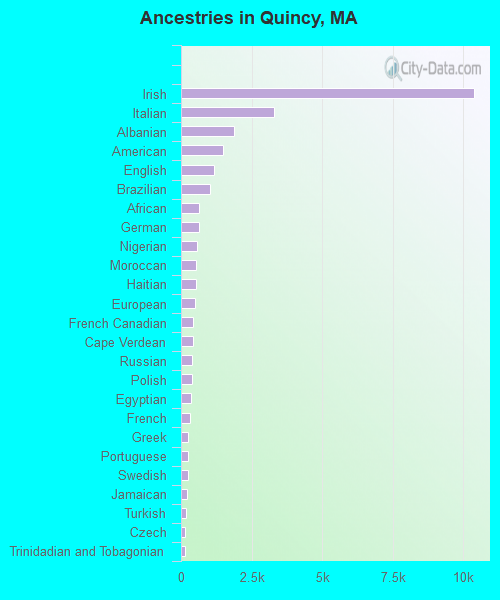
First ancestries reported:
- Irish: 10,401 (18.4%)
- Italian: 3,284 (5.8%)
- Albanian: 1,892 (3.3%)
- American: 1,505 (2.7%)
- English: 1,183 (2.1%)
- Brazilian: 1,041 (1.8%)
- African: 651 (1.1%)
- German: 627 (1.1%)
- Nigerian: 580 (1.0%)
- Moroccan: 538 (1.0%)
- Haitian: 534 (0.9%)
- European: 506 (0.9%)
- French Canadian: 413 (0.7%)
- Cape Verdean: 411 (0.7%)
- Russian: 383 (0.7%)
- Polish: 374 (0.7%)
- Egyptian: 362 (0.6%)
- French: 317 (0.6%)
- Greek: 251 (0.4%)
- Portuguese: 234 (0.4%)
- Swedish: 233 (0.4%)
- Jamaican: 201 (0.4%)
- Turkish: 180 (0.3%)
- Czech: 150 (0.3%)
- Trinidadian and Tobagonian: 141 (0.2%)
- Kenyan: 134 (0.2%)
- Lebanese: 118 (0.2%)
- West Indian: 116 (0.2%)
- Macedonian: 115 (0.2%)
- Iranian: 113 (0.2%)
- Norwegian: 112 (0.2%)
- Lithuanian: 99 (0.2%)
- Finnish: 92 (0.2%)
- Eastern European: 89 (0.2%)
- Scottish: 88 (0.2%)
- Canadian: 83 (0.1%)
- Armenian: 81 (0.1%)
- Ethiopian: 73 (0.1%)
- Scotch-Irish: 67 (0.1%)
- British: 57 (0.1%)
- Dutch: 51 (0.09%)
- Ugandan: 51 (0.09%)
- Arab: 49 (0.09%)
- Ukrainian: 45 (0.08%)
- Bulgarian: 40 (0.07%)
- Guyanese: 40 (0.07%)
- Ghanaian: 39 (0.07%)
- Romanian: 37 (0.07%)
- Austrian: 36 (0.06%)
- Danish: 30 (0.05%)
- Hungarian: 30 (0.05%)
- Latvian: 29 (0.05%)
- Serbian: 28 (0.05%)
- Swiss: 26 (0.05%)
- British West Indian: 25 (0.04%)
- Barbadian: 25 (0.04%)
- Northern European: 19 (0.03%)
- Palestinian: 18 (0.03%)
- Iraqi: 16 (0.03%)
- Jordanian: 12 (0.02%)
- Sudanese: 8 (0.01%)
- Pennsylvania German: 5 (0.01%)
- Croatian: 5 (0.01%)
- Czechoslovakian: 5 (0.01%)
- Welsh: 3 (0.01%)
Most common places of birth for foreign-born residents (%):
| Quincy: | 33.0% (11,292) |
| Massachusetts: | 8.4% (103,233) |
| Quincy: | 9.8% (3,371) |
| Massachusetts: | 3.0% (37,197) |
| Quincy: | 8.7% (2,991) |
| Massachusetts: | 6.8% (82,934) |
| Quincy: | 4.7% (1,610) |
| Massachusetts: | 1.1% (13,076) |
| Quincy: | 3.5% (1,208) |
| Massachusetts: | 7.6% (92,959) |
| Quincy: | 3.3% (1,124) |
| Massachusetts: | 0.7% (8,536) |
| Quincy: | 3.0% (1,033) |
| Massachusetts: | 0.7% (8,562) |
| Quincy: | 2.6% (894) |
| Massachusetts: | 1.1% (13,446) |
| Quincy: | 2.2% (761) |
| Massachusetts: | 2.6% (32,354) |
Place of birth for U.S.-born residents:
- This state: 50,519
- Other state: 13,514
- Northeast: 6,857
- Midwest: 2,166
- South: 2,640
- West: 1,851
86.5% of Quincy residents lived in the same house 1 years ago.
Out of people who lived in different houses, 22.7% lived in this county.
Out of people who lived in different counties, 45.7% lived in Massachusetts.
| Quincy: | 86.5% |
| State average: | 87.7% |
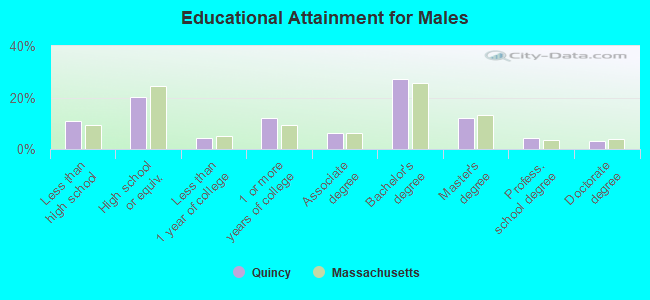
Education attainment for males 25 years and older:
- No schooling: 1,164
- Nursery to 4th grade: 84
- 5th and 6th grade: 505
- 7th and 8th grade: 527
- 9th grade: 47
- 10th grade: 778
- 11th grade: 191
- 12th grade, no diploma: 916
- High school graduate (or equivalency): 7,833
- Less than 1 year of college: 1,591
- Some college more than 1 year, no degree: 4,705
- Associate degree: 2,437
- Bachelor's degree: 10,636
- Master's degree: 4,626
- Professional school degree: 1,673
- Doctorate degree: 1,162
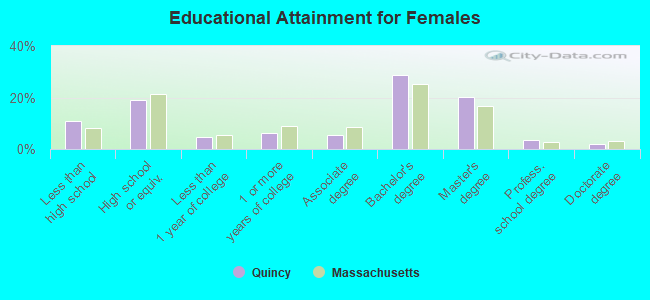
Education attainment for females 25 years and older:
- No schooling: 2,146
- Nursery to 4th grade: 413
- 5th and 6th grade: 659
- 7th and 8th grade: 267
- 9th grade: 263
- 10th grade: 45
- 11th grade: 354
- 12th grade, no diploma: 456
- High school graduate (or equivalency): 7,952
- Less than 1 year of college: 1,952
- Some college more than 1 year, no degree: 2,555
- Associate degree: 2,199
- Bachelor's degree: 11,982
- Master's degree: 8,444
- Professional school degree: 1,421
- Doctorate degree: 775
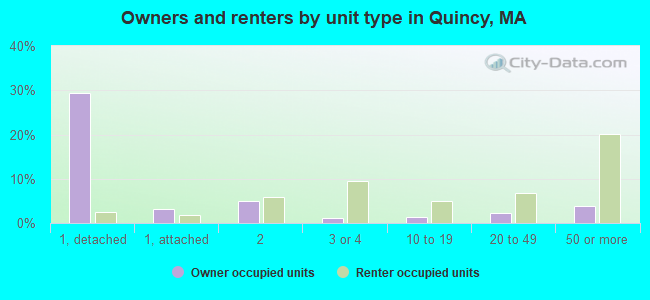
Housing units in structures:
- One, detached: 18,156
- One, attached: 2,532
- Two: 6,044
- 3 or 4: 3,203
- 5 to 9: 1,687
- 10 to 19: 1,474
- 20 to 49: 4,421
- 50 or more: 13,178
- Mobile homes: 375
- Boats, RVs, vans, etc.: 86
Housing units lacking complete kitchen facilities in 2022: 1.3%
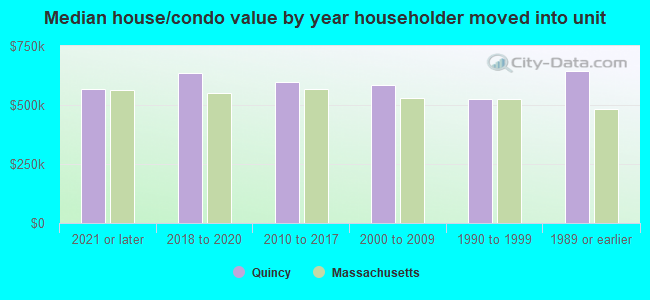
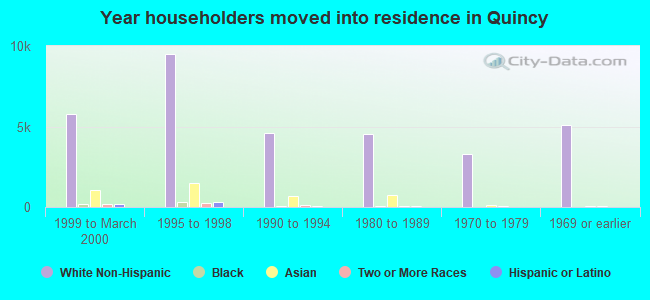
House/condo owner moved in on average 13 years ago
Renter moved in on average 3 years ago
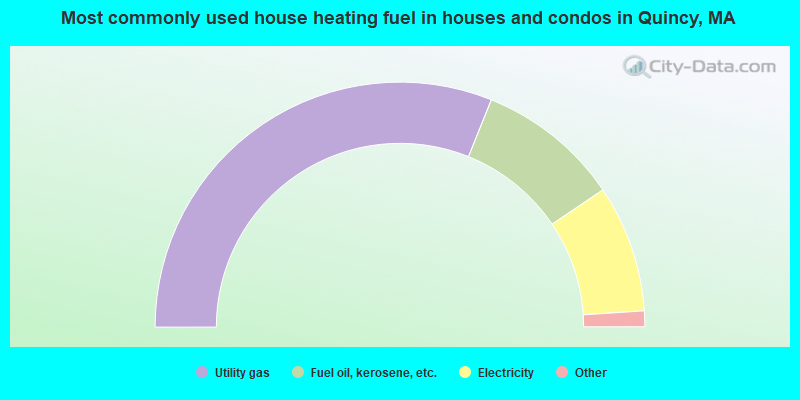
- 62.2%Utility gas
- 18.9%Fuel oil, kerosene, etc.
- 16.8%Electricity
- 1.5%Bottled, tank, or LP gas
- 0.4%Other fuel
- 0.1%No fuel used
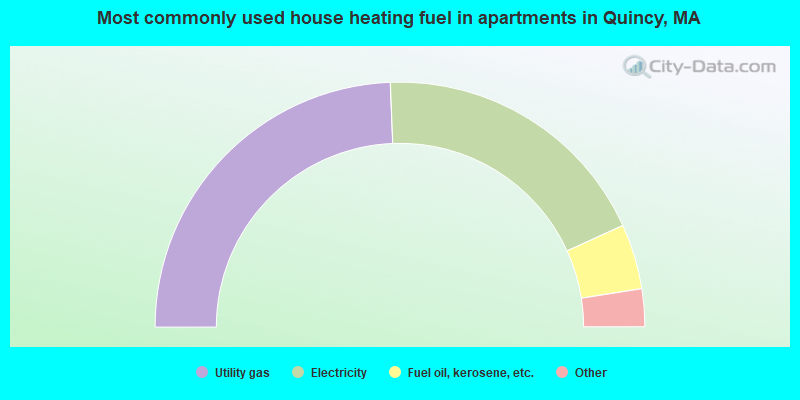
- 48.8%Utility gas
- 37.7%Electricity
- 8.6%Fuel oil, kerosene, etc.
- 3.5%Bottled, tank, or LP gas
- 0.9%No fuel used
- 0.5%Other fuel
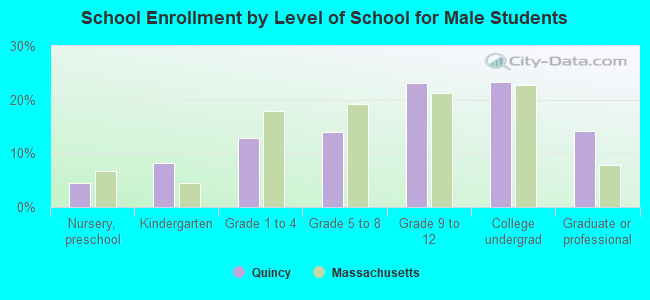
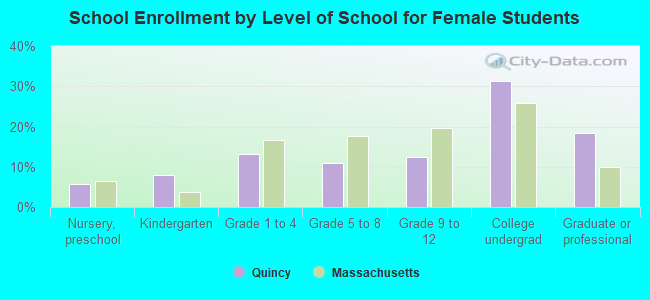
Private vs. public school enrollment:
| Here: | 2.7% |
| Massachusetts: | 10.3% |
| Here: | 11.7% |
| Massachusetts: | 12.3% |
| Here: | 26.9% |
| Massachusetts: | 51.2% |