Jump to a detailed profile or search site with Google Custom Search

Queen Creek, AZ (Arizona) Houses and Residents

Estimated median house or condo value in 2022: $632,700 (it was $179,900 in 2000)
Queen Creek:

$632,700
Arizona:

$402,800
Lower value quartile - upper value quartile: $484,700 - $808,700

Mean price in 2022:

Detached houses: $556,930
Here:

$556,930
State:

$521,408

Total population: 32,236 (Urban population: 3,551 (all inside urban clusters), Rural population: 766 (21 farm, 745 nonfarm))

Houses: 22,017 (21,058 occupied: 19,428 owner occupied, 1,630 renter occupied)

% of renters here:

8%
State:

33%

Housing density: 853 houses/condos per square mile

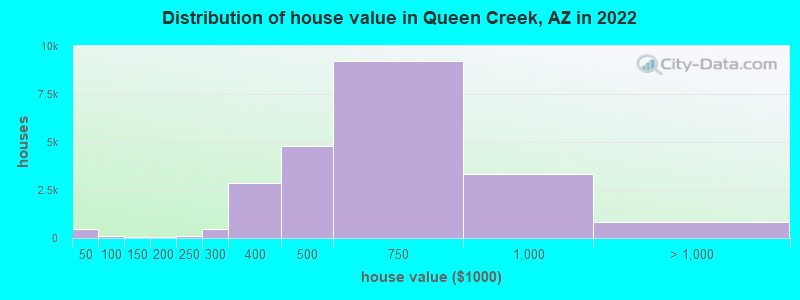
Median price asked for vacant for-sale houses and condos in 2022: $592,907.

Median contract rent in 2022: over $2,000 (lower quartile is $1,520, upper quartile is over $2,000)


Median rent asked for vacant for-rent units in 2022: $1,861


Median gross rent in Queen Creek, AZ in 2022: over $2,000

Housing units in Queen Creek with a mortgage: 15,936 (825 second mortgage, 0 home equity loan, 636 both second mortgage and home equity loan)
Houses without a mortgage: 291

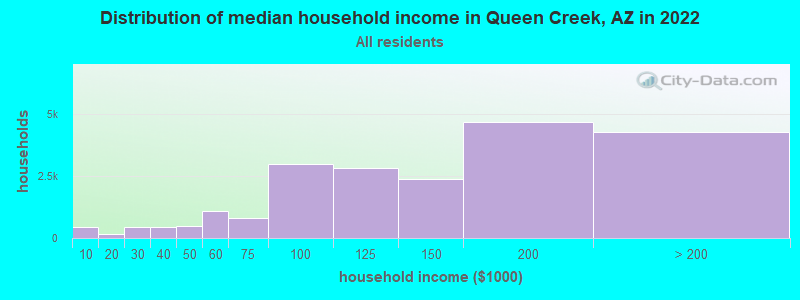
Median household income for houses/condos with a mortgage: $144,719

Median household income for apartments without a mortgage: $96,926

Median monthly housing costs: $1,909

Compare current foreclosures in Queen Creek, AZ:

Check out more offers in Queen Creek, AZ.
Powered by Foreclosure.com

Settings
X
Data:
Loading data...
Based on 2000-2022 data
Loading data...

123
Hide US histogram

Queen Creek, Arizona Age and Sex of Residents
Median year house/condo built: 2013

Median year apartment built: 2012

Household type by relationship:

Households: 69,345
  • Male householders: 12,297 (679 living alone), Female householders: 8,761 (1,705 living alone)
  • 15,224 spouses (15,078 opposite-sex spouses), 1,046 unmarried partners, (1,046 opposite-sex unmarried partners), 27,486 children (24,954 natural, 1,189 adopted, 1,343 stepchildren), 308 grandchildren, 160 brothers or sisters, 831 parents, 0 foster children, 758 other relatives, 1,859 non-relatives
  • In group quarters: 615

Size of family households: 5,399 2-persons, 2,768 3-persons, 4,174 4-persons, 2,425 5-persons, 2,148 6-persons, 428 7-or-more-persons.

Size of nonfamily households: 2,384 1-person, 1,192 2-persons, 100 4-persons, 40 5-persons.

15,852 married couples with children.
2,289 single-parent households (621 men, 1,668 women).

89.2% of residents of Queen Creek speak English at home.
6.7% of residents speak Spanish at home (72% speak English very well, 16% speak English well, 9% speak English not well, 3% don't speak English at all).
1.2% of residents speak other Indo-European language at home (85% speak English very well, 12% speak English well, 2% speak English not well).
2.2% of residents speak Asian or Pacific Island language at home (73% speak English very well, 22% speak English well, 2% speak English not well, 3% don't speak English at all).
0.4% of residents speak other language at home (95% speak English very well, 5% speak English not well).

Foreign born population: 3,541 (5.1%)
(68.3% of them are naturalized citizens)

Median number of rooms in houses and condos:
Here:

6.8
State:

6.0

Median number of rooms in apartments
Here:

4.9
State:

4.1

Owner-occupied Renter-occupied
Bedrooms in owner-occupied houses and condos in Queen Creek, Arizona
  • Bedrooms in owner-occupied houses and condos in Queen Creek, Arizona
  • 40no bedroom
  • 491 bedroom
  • 1,7312 bedrooms
  • 6,4503 bedrooms
  • 7,1514 bedrooms
  • 4,0075+ bedrooms
Bedrooms in renter-occupied apartments in Queen Creek, Arizona
  • Bedrooms in renter-occupied apartments in Queen Creek, Arizona
  • 65no bedroom
  • 851 bedroom
  • 2032 bedrooms
  • 9583 bedrooms
  • 2794 bedrooms
  • 405+ bedrooms
Owner-occupied Renter-occupied
Cars and other vehicles available in Queen Creek in owner-occupied houses/condos
  • Cars and other vehicles available in Queen Creek in owner-occupied houses/condos
  • 367no vehicle
  • 3,4171 vehicle
  • 9,2642 vehicles
  • 4,3083 vehicles
  • 1,4854 vehicles
  • 5875+ vehicles
Cars and other vehicles available in Queen Creek in renter-occupied apartments
  • Cars and other vehicles available in Queen Creek in renter-occupied apartments
  • 112no vehicle
  • 8011 vehicle
  • 6122 vehicles
  • 03 vehicles
  • 1054 vehicles
  • 05+ vehicles
Owner-occupied Renter-occupied
Rooms in owner-occupied houses in Queen Creek, Arizona
  • Rooms in owner-occupied houses in Queen Creek, Arizona
  • 01 room
  • 152 rooms
  • 3013 rooms
  • 7714 rooms
  • 2,3435 rooms
  • 3,5906 rooms
  • 3,2657 rooms
  • 2,5088 rooms
  • 4,6249+ rooms
Rooms in renter-occupied apartments in Queen Creek, Arizona
  • Rooms in renter-occupied apartments in Queen Creek, Arizona
  • 331 room
  • 262 rooms
  • 1643 rooms
  • 2844 rooms
  • 5105 rooms
  • 4016 rooms
  • 1957 rooms
  • 3758 rooms
  • 2449+ rooms
Year house built
Median 2022 house/condo value by year built
Median house/condo value by year householder moved into unit
Breakdown of mean house values by ages of householders
  • Queen Creek, AZ household income distribution

  • Distribution of median household income in Queen Creek, AZ in 2022
  • 430Less than $10,000
  • 181$10,000 to $19,999
  • 459$20,000 to $29,999
  • 435$30,000 to $39,999
  • 498$40,000 to $49,999
  • 1,106$50,000 to $59,999
  • 806$60,000 to $74,999
  • 2,989$75,000 to $99,999
  • 2,836$100,000 to $124,999
  • 2,375$125,000 to $149,999
  • 4,671$150,000 to $199,999
  • 4,272$200,000 or more
  • Home value of owner - occupied houses in 2022 in Queen Creek, AZ

  • Distribution of house value in Queen Creek, AZ in 2022
  • 259Less than $10,000
  • 9$15,000 to $19,999
  • 35$30,000 to $34,999
  • 19$35,000 to $39,999
  • 120$40,000 to $49,999
  • 6$90,000 to $99,999
  • 26$100,000 to $124,999
  • 3$125,000 to $149,999
  • 6$150,000 to $174,999
  • 51$175,000 to $199,999
  • 85$200,000 to $249,999
  • 467$250,000 to $299,999
  • 2,878$300,000 to $399,999
  • 4,773$400,000 to $499,999
  • 9,241$500,000 to $749,999
  • 3,337$750,000 to $999,999
  • 651$1,000,000 to $1,499,999
  • 113$1,500,000 to $1,999,999
  • 89$2,000,000 or more
  • Rent paid by renters in 2022 in Queen Creek, AZ

  • Distribution of rent paid by renters in Queen Creek, AZ in 2022
  • 27$800 to $899
  • 22$900 to $999
  • 93$1,000 to $1,249
  • 395$1,250 to $1,499
  • 1,040$1,500 to $1,999
  • 1,151$2,000 to $2,499
  • 55$2,500 to $2,999
  • 35$3,000 to $3,499
  • 107No cash rent
Time Leaving Home To Go To Work in 2022

Percentage of workers working in this county: 87.3%
Number of people working at home: 8,313 (27.7% of all workers)

Travel time (in minutes) to work in 2022

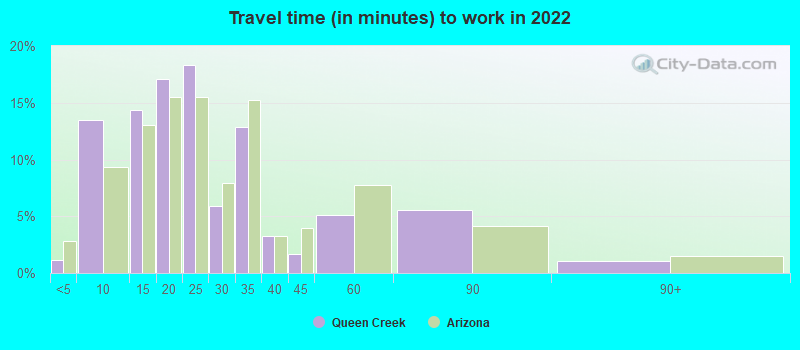
Travel time to work (commute)

  • Less than 5 minutes: 186
  • 5 to 9 minutes: 2,924
  • 10 to 14 minutes: 1,943
  • 15 to 19 minutes: 2,237
  • 20 to 24 minutes: 2,589
  • 25 to 29 minutes: 1,464
  • 30 to 34 minutes: 3,316
  • 35 to 39 minutes: 1,559
  • 40 to 44 minutes: 3,053
  • 45 to 59 minutes: 4,494
  • 60 to 89 minutes: 1,225
  • 90 or more minutes: 139
Means of transportation to work in 2022 - Queen Creek

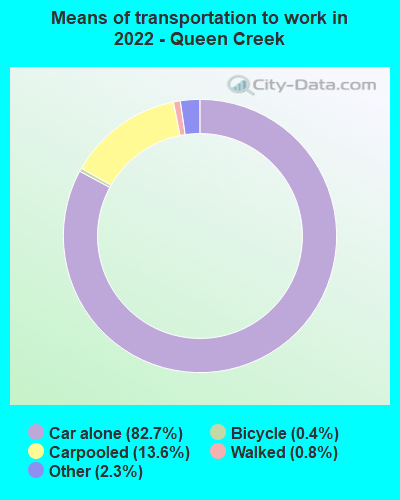
Means of transportation to work:

  • Drove a car alone: 11,168 (53.9%)
  • Carpooled: 1,971 (9.5%)
  • Bus: 6 (0.0%)
  • Ferryboat: 6 (0.0%)
  • Taxi: 394 (1.9%)
  • Bicycle: 48 (0.2%)
  • Walked: 114 (0.5%)
  • Worked at home: 8,313 (40.1%)
Class of Workers in 2022
  • Unemployment by race in 2022
  • Unemployment rate for White non-Hispanic residents
  • 0.7%Males
  • Unemployment rate for Black residents
  • 16.6%Males
  • 1.8%Females
  • Unemployment rate for Asian residents
  • 2.5%Males
  • 3.0%Females
  • Unemployment rate for two or more race residents
  • 1.4%Males
  • 8.7%Females
  • Unemployment rate for Hispanic or Latino residents
  • 1.1%Males
  • 1.9%Females
Year of entry for the foreign-born population in Queen Creek, Arizona
  • Year of entry for the foreign-born population in Queen Creek, Arizona
  • 5872010 or later
  • 7142000 to 2009
  • 9371990 to 1999
  • 1701980 to 1989
  • 631970 to 1979
  • 62Before 1970
Ancestries in Queen Creek, AZ

First ancestries reported:

  • English: 3,839 (14.0%)
  • American: 3,270 (11.9%)
  • German: 2,528 (9.2%)
  • European: 1,902 (6.9%)
  • Irish: 1,253 (4.6%)
  • Italian: 1,113 (4.1%)
  • Polish: 751 (2.7%)
  • Norwegian: 574 (2.1%)
  • Scottish: 361 (1.3%)
  • Greek: 278 (1.0%)
  • African: 214 (0.8%)
  • Northern European: 195 (0.7%)
  • Scotch-Irish: 194 (0.7%)
  • Swedish: 177 (0.6%)
  • Danish: 156 (0.6%)
  • French: 151 (0.6%)
  • Canadian: 137 (0.5%)
  • French Canadian: 113 (0.4%)
  • Russian: 96 (0.4%)
  • Dutch: 88 (0.3%)
  • Eastern European: 85 (0.3%)
  • Finnish: 83 (0.3%)
  • Lithuanian: 71 (0.3%)
  • Arab: 68 (0.2%)
  • Welsh: 65 (0.2%)
  • British: 63 (0.2%)
  • Hungarian: 49 (0.2%)
  • Assyrian: 31 (0.1%)
  • Jamaican: 30 (0.1%)
  • Lebanese: 29 (0.1%)
  • Portuguese: 25 (0.09%)
  • Scandinavian: 23 (0.08%)
  • Liberian: 23 (0.08%)
  • Slavic: 21 (0.08%)
  • Armenian: 17 (0.06%)
  • Czechoslovakian: 16 (0.06%)
  • Austrian: 15 (0.05%)
  • Belgian: 11 (0.04%)
  • Serbian: 8 (0.03%)
  • Romanian: 2 (0.01%)

Most common places of birth for foreign-born residents (%):

Mexico
Queen Creek:

27.6% (980)
Arizona:

53.4% (500,086)

Philippines
Queen Creek:

7.2% (255)
Arizona:

3.2% (30,378)

Canada
Queen Creek:

7.0% (248)
Arizona:

4.3% (40,102)

Vietnam
Queen Creek:

5.6% (200)
Arizona:

2.1% (19,199)

Korea
Queen Creek:

5.5% (194)
Arizona:

1.2% (11,275)

India
Queen Creek:

5.1% (180)
Arizona:

4.5% (41,719)

Germany
Queen Creek:

4.8% (171)
Arizona:

1.5% (14,058)

Nigeria
Queen Creek:

3.0% (107)
Arizona:

0.4% (3,330)

England
Queen Creek:

2.8% (99)
Arizona:

1.1% (9,889)

Liberia
Queen Creek:

2.1% (76)
Arizona:

0.1% (1,015)

Spain
Queen Creek:

2.0% (70)
Arizona:

0.2% (1,678)

Japan
Queen Creek:

1.9% (69)
Arizona:

0.6% (6,077)

United Kingdom, excluding England and Scotland
Queen Creek:

1.8% (65)
Arizona:

0.7% (6,565)

Greece
Queen Creek:

1.7% (59)
Arizona:

0.1% (1,080)

Place of birth for U.S.-born residents:

  • This state: 28,586
  • Other state: 36,688
  • Northeast: 4,152
  • Midwest: 9,968
  • South: 3,873
  • West: 18,695

88.3% of Queen Creek residents lived in the same house 1 years ago.
   Out of people who lived in different houses, 32.5% lived in this county.
   Out of people who lived in different counties, 22.5% lived in Arizona.


Queen Creek:

88.3%
State average:

86.0%

Education attainment for males 25 years and older:

  • No schooling: 336
  • Nursery to 4th grade: 0
  • 5th and 6th grade: 0
  • 7th and 8th grade: 17
  • 9th grade: 0
  • 10th grade: 168
  • 11th grade: 247
  • 12th grade, no diploma: 29
  • High school graduate (or equivalency): 3,882
  • Less than 1 year of college: 1,261
  • Some college more than 1 year, no degree: 2,881
  • Associate degree: 2,204
  • Bachelor's degree: 7,134
  • Master's degree: 1,739
  • Professional school degree: 208
  • Doctorate degree: 458
Educational Attainment for Males

Education attainment for females 25 years and older:

  • No schooling: 309
  • Nursery to 4th grade: 0
  • 5th and 6th grade: 0
  • 7th and 8th grade: 132
  • 9th grade: 0
  • 10th grade: 121
  • 11th grade: 0
  • 12th grade, no diploma: 105
  • High school graduate (or equivalency): 3,994
  • Less than 1 year of college: 1,447
  • Some college more than 1 year, no degree: 2,907
  • Associate degree: 2,148
  • Bachelor's degree: 6,951
  • Master's degree: 2,155
  • Professional school degree: 259
  • Doctorate degree: 363
Educational Attainment for Females
Queen Creek marital status for males
Queen Creek marital status for females

Housing units in structures:

  • One, detached: 19,419
  • One, attached: 313
  • Two: 39
  • 3 or 4: 39
  • 5 to 9: 140
  • 10 to 19: 169
  • 50 or more: 265
  • Mobile homes: 165
Housing units lacking complete plumbing facilities in 2022: 0.4%

Housing units lacking complete kitchen facilities in 2022: 0.4%

House/condo owner moved in on average 4 years ago

Renter moved in on average 2 years ago

Year householders moved into residence in Queen Creek
Houses and condos Apartments
Most commonly used house heating fuel in houses and condos in Queen Creek, AZ
  • 62.4%Utility gas
  • 34.8%Electricity
  • 1.6%Bottled, tank, or LP gas
  • 0.4%Wood
  • 0.4%Solar energy
  • 0.3%No fuel used
Most commonly used house heating fuel in apartments in Queen Creek, AZ
  • 55.4%Electricity
  • 40.1%Utility gas
  • 2.7%Bottled, tank, or LP gas
  • 1.1%Solar energy
  • 0.5%Fuel oil, kerosene, etc.
  • 0.2%No fuel used

Private vs. public school enrollment:

Students in private schools in grades 1 to 8 (elementary and middle school): 1,815
Here:

15.8%
Arizona:

10.4%

Students in private schools in grades 9 to 12 (high school): 468
Here:

11.0%
Arizona:

8.8%

Students in private undergraduate colleges: 222
Here:

7.5%
Arizona:

13.1%
School Enrollment by Level of School for Male Students
School Enrollment by Level of School for Female Students
Age and Sex of Sensory-Disabled Noninstitutionalized Residents
Age and Sex of Physically-Disabled Noninstitutionalized Residents
Age and Sex of Mentally-Disabled Noninstitutionalized Residents
Age and Sex of Self-Care Disabled Noninstitutionalized Residents
Age and Sex of Go-Outside-Home Disabled Noninstitutionalized Residents
Age and Sex of Noninstitutionalized Residents with Employment Disability