Pulaski, TN (Tennessee) Houses and Residents
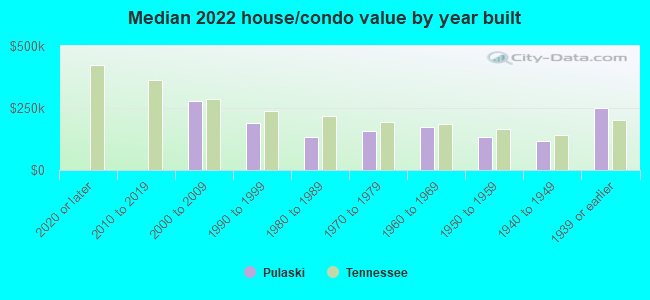
| Pulaski: | $160,008 |
| Tennessee: | $284,800 |
Mean price in 2022:
Detached houses: $195,004
Here: $195,004 State: $374,382 Mobile homes: $66,296
Here: $66,296 State: $101,421
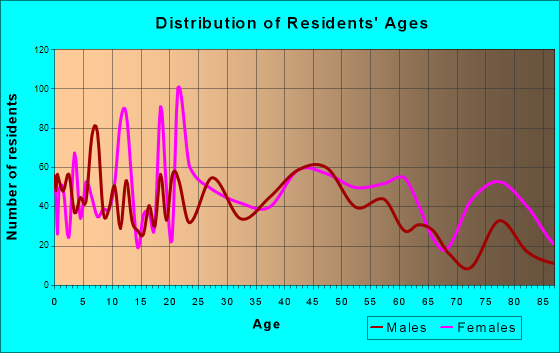
Total population: 7,625 (Urban population: 7,370 (all inside urban clusters), Rural population: 183 (all nonfarm))
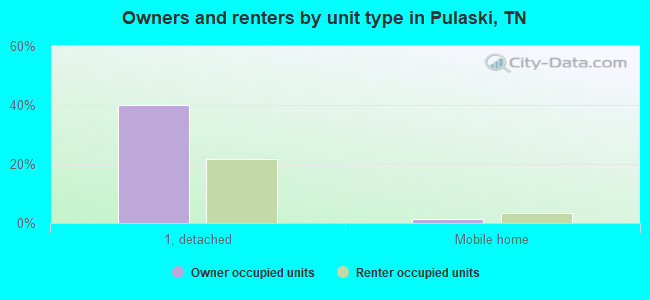
Houses: 4,067 (3,417 occupied: 1,438 owner occupied, 2,040 renter occupied)
| % of renters here: | 59% |
| State: | 33% |
Housing density: 620 houses/condos per square mile
Median price asked for vacant for-sale houses and condos in 2022: $270,037.
Median contract rent in 2022: $624 (lower quartile is $511, upper quartile is $872)
Median rent asked for vacant for-rent units in 2022: $668
Median gross rent in Pulaski, TN in 2022: $844
Housing units in Pulaski with a mortgage: 633 (53 second mortgage, 0 home equity loan, 45 both second mortgage and home equity loan)
Houses without a mortgage: 0
Median household income for houses/condos with a mortgage: $69,149
Median household income for apartments without a mortgage: $50,134
Median monthly housing costs: $796
Compare current foreclosures in Pulaski, TN:
| Photo | Address | Area | Beds / Baths | Price | Details |
|---|---|---|---|---|---|

|
#1
Meadowbrook Dr
Pulaski, TN 38478
|
1,010 sq. feet
|
1 baths - beds |
show details | |

|
#2
Crooked Hill Rd
Pulaski, TN 38478
|
1,104 sq. feet
|
2 baths - beds |
show details | |

|
#3
Park St
Pulaski, TN 38478
|
1,166 sq. feet
|
2 baths - beds |
show details | |

|
#4
Amy Dr
Pulaski, TN 38478
|
1,528 sq. feet
|
2 baths - beds |
show details | |

|
#5
Brenda Dr
Pulaski, TN 38478
|
1,200 sq. feet
|
1 baths - beds |
show details | |

|
#6
Bodenham Rd
Pulaski, TN 38478
|
1,065 sq. feet
|
1 baths - beds |
show details | |

|
#7
Lincoln St
Pulaski, TN 38478
|
720 sq. feet
|
2 baths - beds |
show details | |

|
#8
Richland Dr
Pulaski, TN 38478
|
1,170 sq. feet
|
1 baths - beds |
show details | |

|
#9
Mckibbon Ln
Pulaski, TN 38478
|
1,400 sq. feet
|
2 baths - beds |
show details | |

|
#10
Cleveland St
Pulaski, TN 38478
|
1,401 sq. feet
|
1 baths - beds |
show details |
| Photo | Address | Area | Beds / Baths | Price | Details |
|---|---|---|---|---|---|

|
#11
Five Points Rd
Pulaski, TN 38478
|
3,808 sq. feet
|
3 baths - beds |
show details | |

|
#12
Rocky Rd
Pulaski, TN 38478
|
1,933 sq. feet
|
2 baths - beds |
show details | |

|
#13
Wilson Ave
Pulaski, TN 38478
|
1,920 sq. feet
|
1 baths - beds |
show details | |

|
#14
Meadowbrook Dr
Pulaski, TN 38478
|
1,022 sq. feet
|
1 baths - beds |
show details | |

|
#15
Bluebird Ln
Pulaski, TN 38478
|
1,775 sq. feet
|
2 baths - beds |
show details | |

|
#16
Meadowbrook Dr
Pulaski, TN 38478
|
1,010 sq. feet
|
1 baths - beds |
show details | |

|
#17
Beverly Dr
Pulaski, TN 38478
|
1,413 sq. feet
|
1 baths - beds |
show details | |

|
#18
Vales Mill Rd
Pulaski, TN 38478
|
1,456 sq. feet
|
1 baths - beds |
show details | |

|
#19
Mill St
Pulaski, TN 38478
|
- sq. feet
|
- baths - beds |
show details | |

|
#20
Old Smith Hollow Rd
Pulaski, TN 38478
|
- sq. feet
|
- baths - beds |
show details |
| Photo | Address | Area | Beds / Baths | Price | Details |
|---|---|---|---|---|---|

|
#21
Magazine Rd
Pulaski, TN 38478
|
- sq. feet
|
- baths - beds |
show details | |

|
#22
Gordon Ln
Pulaski, TN 38478
|
- sq. feet
|
- baths - beds |
show details | |

|
#23
Ball Hollow Rd
Pulaski, TN 38478
|
960 sq. feet
|
- baths - beds |
show details | |

|
#24
Bunker Hill Rd
Pulaski, TN 38478
|
- sq. feet
|
- baths - beds |
show details | |

|
#25
S 6th St
Pulaski, TN 38478
|
- sq. feet
|
- baths - beds |
show details | |

|
#26
Garden Meadows Dr
Pulaski, TN 38478
|
- sq. feet
|
- baths - beds |
show details | |

|
#27
Cleveland St Apt D3
Pulaski, TN 38478
|
- sq. feet
|
- baths - beds |
show details | |

|
#28
Hidden Hills Rd
Pulaski, TN 38478
|
- sq. feet
|
- baths - beds |
show details | |

|
#29
Trotwood Dr
Pulaski, TN 38478
|
- sq. feet
|
- baths - beds |
show details | |

|
#30
Tanglewood Dr
Pulaski, TN 38478
|
- sq. feet
|
- baths - beds |
show details |
| Photo | Address | Area | Beds / Baths | Price | Details |
|---|---|---|---|---|---|

|
#31
Magazine Rd Apt B4
Pulaski, TN 38478
|
- sq. feet
|
- baths - beds |
show details | |

|
#32
Pisgah Pike
Pulaski, TN 38478
|
- sq. feet
|
- baths - beds |
show details | |

|
#33
Brittneys Blvd
Pulaski, TN 38478
|
- sq. feet
|
- baths - beds |
show details | |

|
#34
Guthrie Rd
Pulaski, TN 38478
|
1,216 sq. feet
|
- baths - beds |
show details | |

|
#35
E Woodring St
Pulaski, TN 38478
|
- sq. feet
|
- baths - beds |
show details | |

|
#36
Lewisburg Hwy
Pulaski, TN 38478
|
- sq. feet
|
- baths - beds |
show details | |

|
#37
Desperado Ave
Pulaski, TN 38478
|
- sq. feet
|
- baths - beds |
show details | |

|
#38
Chicken Creek Rd
Pulaski, TN 38478
|
- sq. feet
|
- baths - beds |
show details | |

|
#39
S 6th St
Pulaski, TN 38478
|
- sq. feet
|
- baths - beds |
show details | |

|
Check over 1 million property listings on Foreclosure.com!
|
browse all offers | |||

Latest news about housing in Pulaski, TN collected exclusively by city-data.com from local newspapers, TV, and radio stations

 | Murfreesboro vs Hendersonville for retirement (15 replies) |
| East TN vs Cumberland Plateau (27 replies) |
| Brentwood, TN and Surrounding Areas (16 replies) |
| Columbia area towns? (20 replies) |
| Pulaski TN vs. Taft TN (10 replies) |
| 5 Tennessee cities among America's "great affordable college towns" (10 replies) |
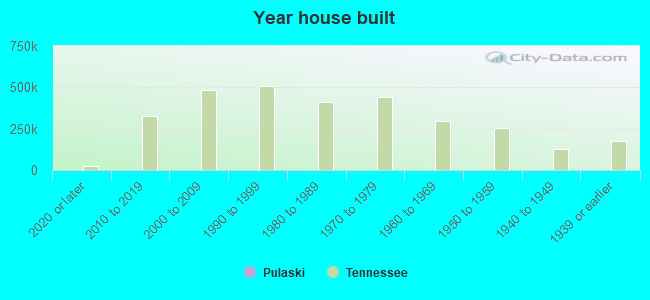
Median year apartment built: 1978
Household type by relationship:
Households: 8,453- Male householders: 1,365 (344 living alone), Female householders: 2,011 (845 living alone)
1,064 spouses (1,064 opposite-sex spouses), 356 unmarried partners, (356 opposite-sex unmarried partners), 2,259 children (1,825 natural, 51 adopted, 382 stepchildren), 138 grandchildren, 180 brothers or sisters, 73 parents, 46 foster children, 131 other relatives, 129 non-relatives
- In group quarters: 696
Size of family households: 1,204 2-persons, 607 3-persons, 168 4-persons, 94 5-persons, 7 6-persons.
Size of nonfamily households: 1,210 1-person, 144 2-persons, 18 3-persons, 18 5-persons.
426 married couples with children.
1,119 single-parent households (364 men, 755 women).
94.9% of residents of Pulaski speak English at home.
4.6% of residents speak Spanish at home (74% speak English very well, 26% speak English well).
0.2% of residents speak other Indo-European language at home (20% speak English very well, 80% speak English well).
0.3% of residents speak Asian or Pacific Island language at home (45% speak English very well, 55% speak English not well).
Foreign born population: 185 (2.2%)
(26.5% of them are naturalized citizens)
| Here: | 6.2 |
| State: | 6.5 |
| Here: | 4.3 |
| State: | 4.4 |
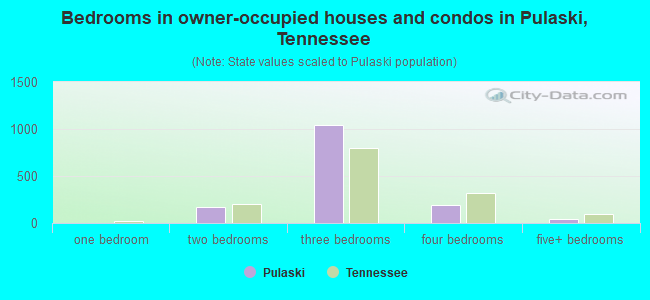
- Bedrooms in owner-occupied houses and condos in Pulaski, Tennessee
- 0no bedroom
- 01 bedroom
- 1672 bedrooms
- 1,0393 bedrooms
- 1894 bedrooms
- 445+ bedrooms
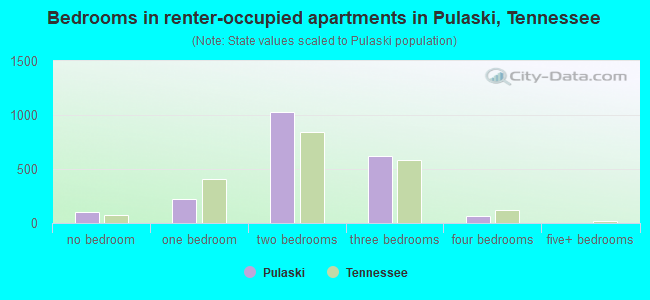
- Bedrooms in renter-occupied apartments in Pulaski, Tennessee
- 103no bedroom
- 2221 bedroom
- 1,0272 bedrooms
- 6203 bedrooms
- 684 bedrooms
- 05+ bedrooms
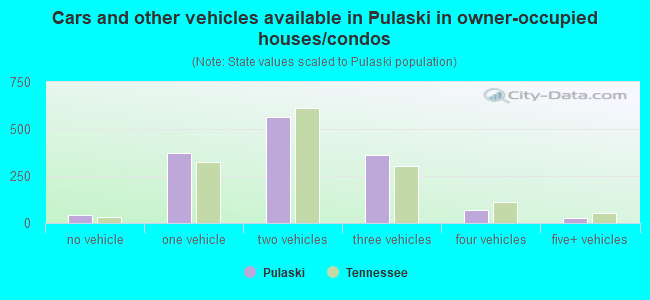
- Cars and other vehicles available in Pulaski in owner-occupied houses/condos
- 40no vehicle
- 3751 vehicle
- 5662 vehicles
- 3633 vehicles
- 684 vehicles
- 265+ vehicles
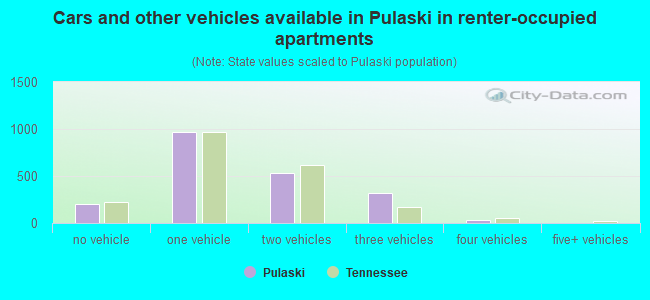
- Cars and other vehicles available in Pulaski in renter-occupied apartments
- 202no vehicle
- 9631 vehicle
- 5272 vehicles
- 3203 vehicles
- 284 vehicles
- 05+ vehicles
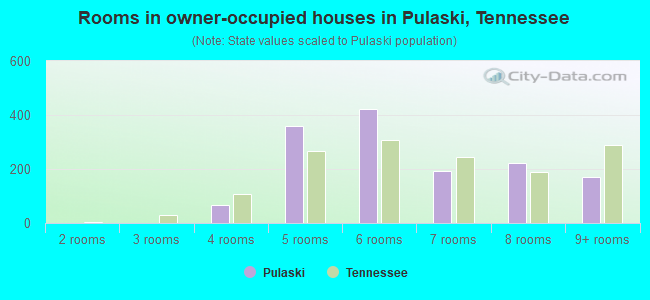
- Rooms in owner-occupied houses in Pulaski, Tennessee
- 01 room
- 02 rooms
- 03 rooms
- 664 rooms
- 3615 rooms
- 4236 rooms
- 1927 rooms
- 2248 rooms
- 1729+ rooms
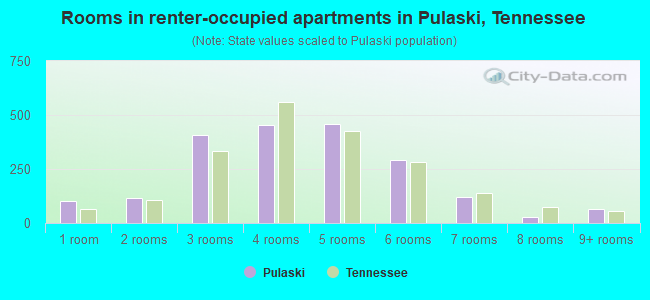
- Rooms in renter-occupied apartments in Pulaski, Tennessee
- 1031 room
- 1152 rooms
- 4073 rooms
- 4534 rooms
- 4585 rooms
- 2926 rooms
- 1197 rooms
- 298 rooms
- 649+ rooms
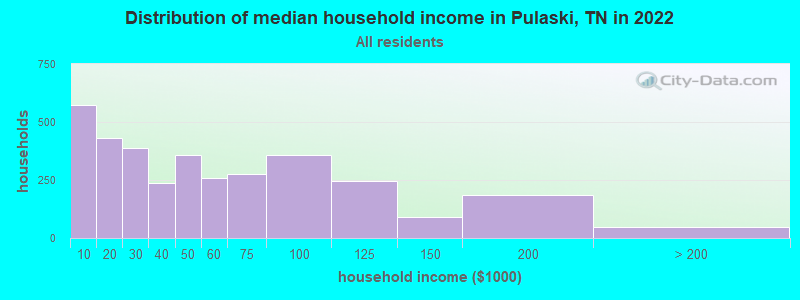
Pulaski, TN household income distribution

- 574Less than $10,000
- 433$10,000 to $19,999
- 387$20,000 to $29,999
- 237$30,000 to $39,999
- 357$40,000 to $49,999
- 260$50,000 to $59,999
- 276$60,000 to $74,999
- 356$75,000 to $99,999
- 244$100,000 to $124,999
- 89$125,000 to $149,999
- 187$150,000 to $199,999
- 48$200,000 or more
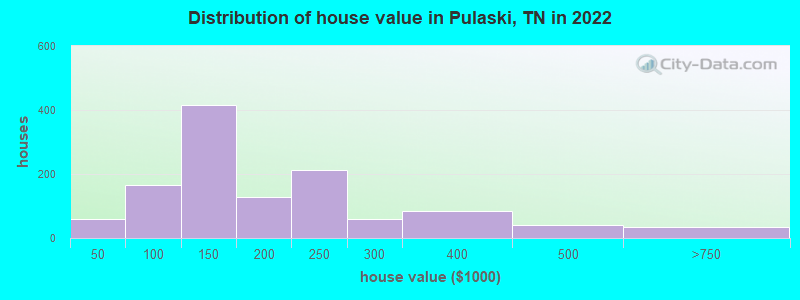
Home value of owner - occupied houses in 2022 in Pulaski, TN
-
- 17Less than $10,000
- 17$35,000 to $39,999
- 23$40,000 to $49,999
- 13$60,000 to $69,999
- 16$70,000 to $79,999
- 52$80,000 to $89,999
- 58$90,000 to $99,999
- 320$100,000 to $124,999
- 96$125,000 to $149,999
- 74$150,000 to $174,999
- 52$175,000 to $199,999
- 212$200,000 to $249,999
- 59$250,000 to $299,999
- 84$300,000 to $399,999
- 40$400,000 to $499,999
- 32$500,000 to $749,999
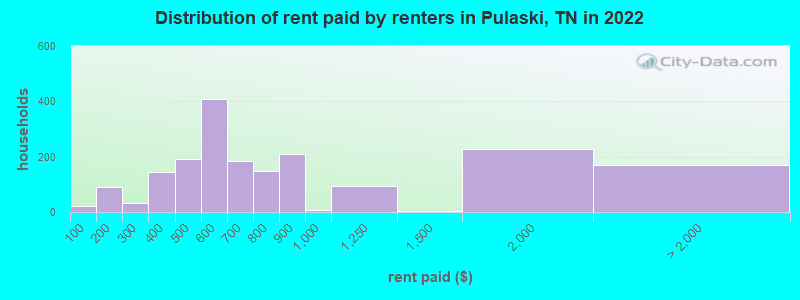
Rent paid by renters in 2022 in Pulaski, TN
-
- 20Less than $100
- 24$100 to $149
- 67$150 to $199
- 25$200 to $249
- 5$250 to $299
- 126$300 to $349
- 18$350 to $399
- 63$400 to $449
- 127$450 to $499
- 245$500 to $549
- 161$550 to $599
- 118$600 to $649
- 66$650 to $699
- 74$700 to $749
- 74$750 to $799
- 207$800 to $899
- 9$900 to $999
- 94$1,000 to $1,249
- 4$1,250 to $1,499
- 228$1,500 to $1,999
- 169No cash rent
Percentage of workers working in this county: 67.8%
Number of people working at home: 169 (5.4% of all workers)
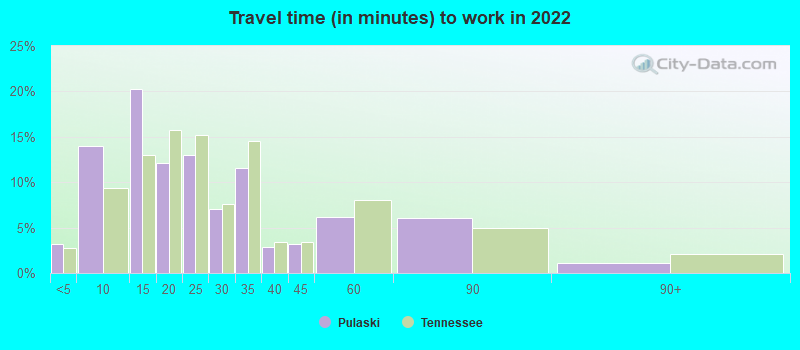
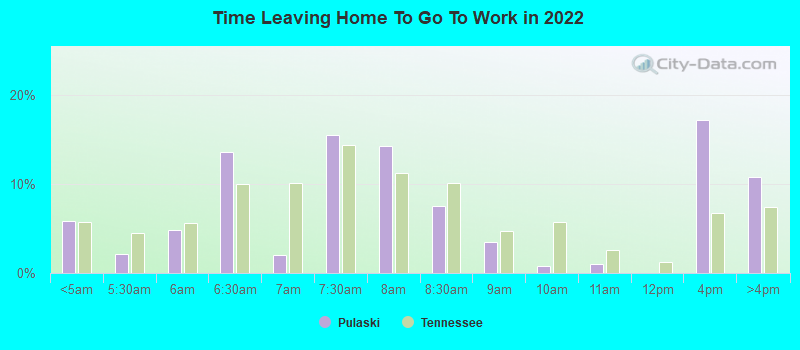
Travel time to work (commute)
- Less than 5 minutes: 147
- 5 to 9 minutes: 742
- 10 to 14 minutes: 630
- 15 to 19 minutes: 129
- 20 to 24 minutes: 139
- 25 to 29 minutes: 103
- 30 to 34 minutes: 257
- 35 to 39 minutes: 89
- 40 to 44 minutes: 117
- 45 to 59 minutes: 187
- 60 to 89 minutes: 368
- 90 or more minutes: 0
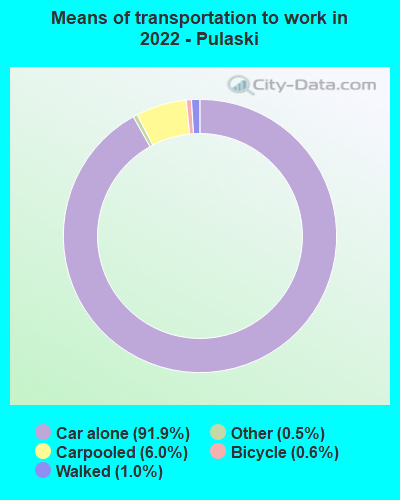
Means of transportation to work:
- Drove a car alone: 6,050 (86.0%)
- Carpooled: 418 (5.9%)
- Taxi: 40 (0.6%)
- Bicycle: 46 (0.7%)
- Walked: 66 (0.9%)
- Worked at home: 169 (2.4%)
- Unemployment by race in 2022
- Unemployment rate for White non-Hispanic residents
- 3.4%Males
- 6.8%Females
- Unemployment rate for Black residents
- 15.9%Females
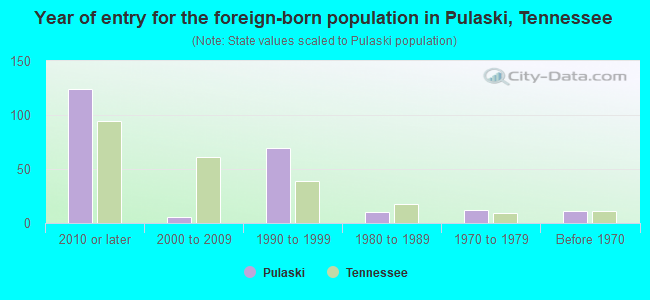
- Year of entry for the foreign-born population in Pulaski, Tennessee
- 1242010 or later
- 62000 to 2009
- 691990 to 1999
- 101980 to 1989
- 121970 to 1979
- 11Before 1970
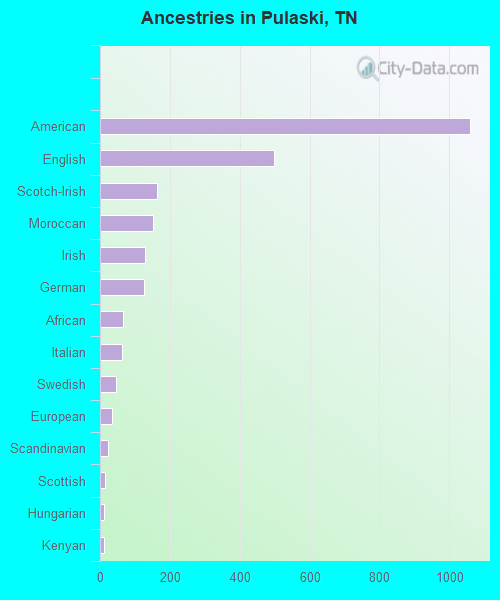
First ancestries reported:
- American: 1,061 (22.0%)
- English: 497 (10.3%)
- Scotch-Irish: 164 (3.4%)
- Moroccan: 152 (3.1%)
- Irish: 130 (2.7%)
- German: 125 (2.6%)
- African: 67 (1.4%)
- Italian: 64 (1.3%)
- Swedish: 45 (0.9%)
- European: 33 (0.7%)
- Scandinavian: 23 (0.5%)
- Scottish: 13 (0.3%)
- Hungarian: 12 (0.2%)
- Kenyan: 11 (0.2%)
- British: 9 (0.2%)
- Australian: 3 (0.06%)
Most common places of birth for foreign-born residents (%):
| Pulaski: | 40.5% (75) |
| Tennessee: | 23.0% (86,435) |
| Pulaski: | 36.2% (67) |
| Tennessee: | 0.3% (1,109) |
| Pulaski: | 11.9% (22) |
| Tennessee: | 2.2% (8,261) |
| Pulaski: | 5.9% (11) |
| Tennessee: | 0.5% (1,886) |
| Pulaski: | 4.9% (9) |
| Tennessee: | 0.2% (939) |
| Pulaski: | 3.2% (6) |
| Tennessee: | 0.9% (3,225) |
| Pulaski: | 1.6% (3) |
| Tennessee: | 0.2% (671) |
Place of birth for U.S.-born residents:
- This state: 5,569
- Other state: 2,649
- Northeast: 106
- Midwest: 776
- South: 1,404
- West: 354
79.8% of Pulaski residents lived in the same house 1 years ago.
Out of people who lived in different houses, 37.7% lived in this county.
Out of people who lived in different counties, 70.4% lived in Tennessee.
| Pulaski: | 79.8% |
| State average: | 87.0% |
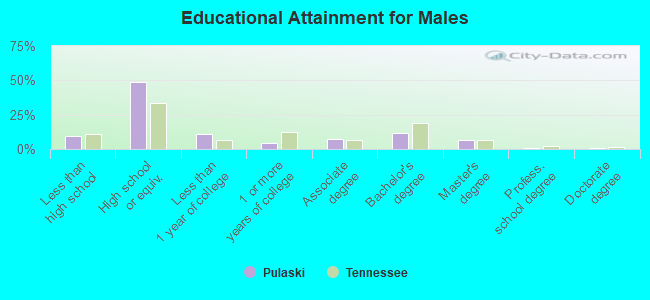
Education attainment for males 25 years and older:
- No schooling: 42
- Nursery to 4th grade: 0
- 5th and 6th grade: 0
- 7th and 8th grade: 50
- 9th grade: 7
- 10th grade: 7
- 11th grade: 44
- 12th grade, no diploma: 80
- High school graduate (or equivalency): 1,211
- Less than 1 year of college: 278
- Some college more than 1 year, no degree: 99
- Associate degree: 171
- Bachelor's degree: 286
- Master's degree: 162
- Professional school degree: 16
- Doctorate degree: 15
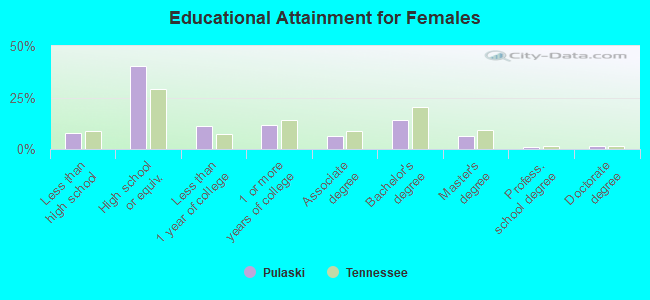
Education attainment for females 25 years and older:
- No schooling: 12
- Nursery to 4th grade: 0
- 5th and 6th grade: 0
- 7th and 8th grade: 47
- 9th grade: 19
- 10th grade: 31
- 11th grade: 99
- 12th grade, no diploma: 46
- High school graduate (or equivalency): 1,287
- Less than 1 year of college: 349
- Some college more than 1 year, no degree: 367
- Associate degree: 198
- Bachelor's degree: 455
- Master's degree: 208
- Professional school degree: 27
- Doctorate degree: 41
Housing units in structures:
- One, detached: 2,512
- One, attached: 144
- Two: 294
- 3 or 4: 207
- 5 to 9: 213
- 10 to 19: 229
- 20 to 49: 179
- 50 or more: 11
- Mobile homes: 274
Housing units lacking complete kitchen facilities in 2022: 3.1%
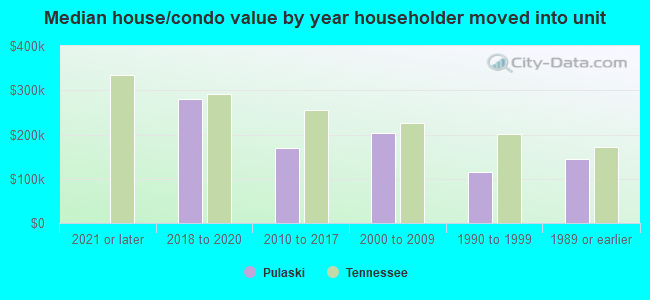
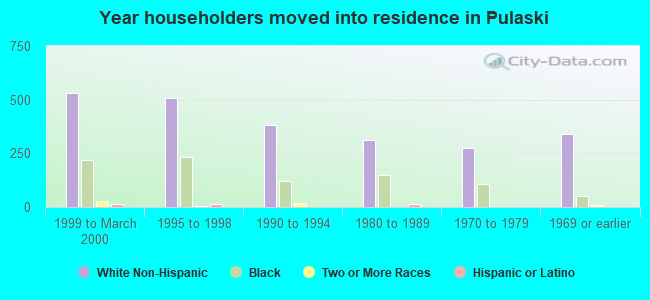
House/condo owner moved in on average 19 years ago
Renter moved in on average 3 years ago
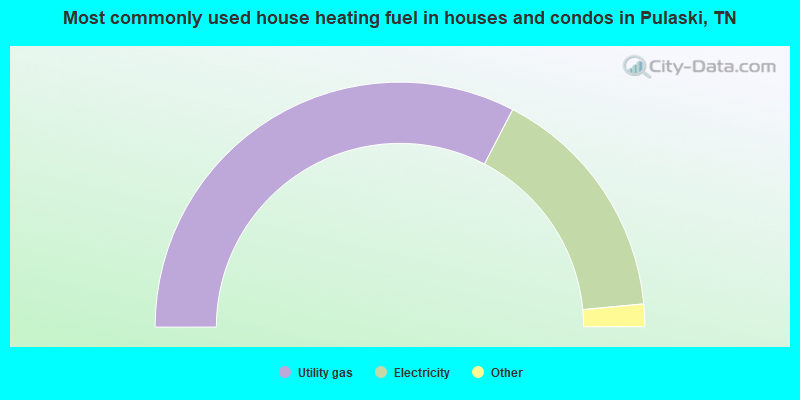
- 65.3%Utility gas
- 31.8%Electricity
- 2.1%Fuel oil, kerosene, etc.
- 0.8%Wood
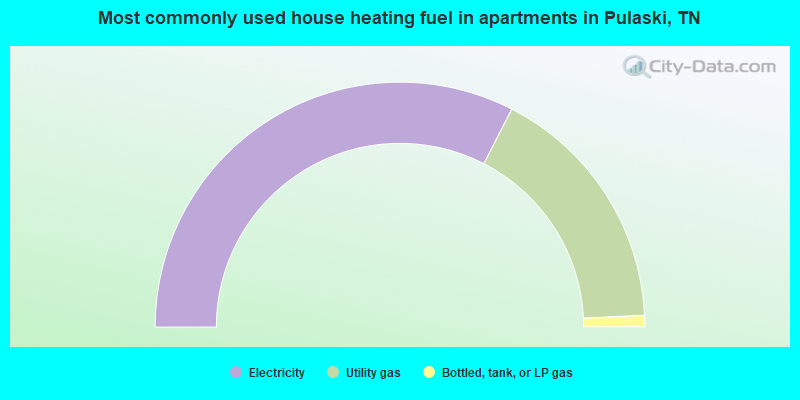
- 65.1%Electricity
- 33.4%Utility gas
- 1.5%Bottled, tank, or LP gas
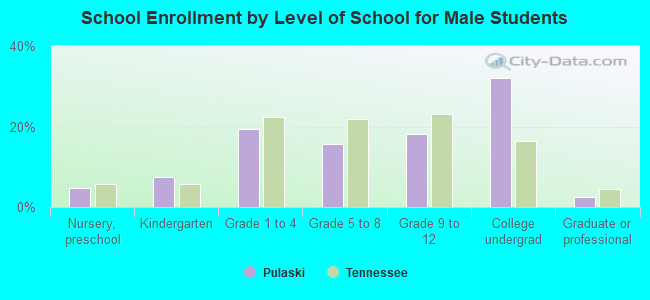
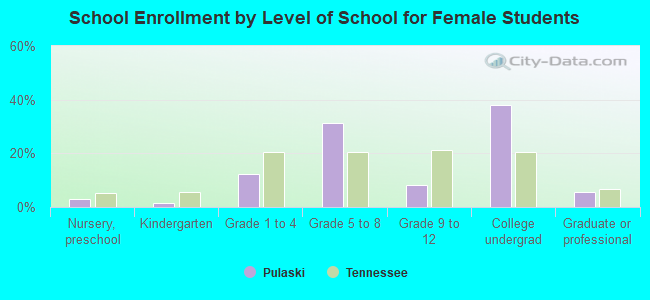
Private vs. public school enrollment:
| Here: | 5.9% |
| Tennessee: | 15.0% |
| Here: | 0.0% |
| Tennessee: | 16.2% |
| Here: | 37.5% |
| Tennessee: | 23.5% |