Preston, MD (Maryland) Houses and Residents
| Preston: | $248,695 |
| Maryland: | $398,100 |
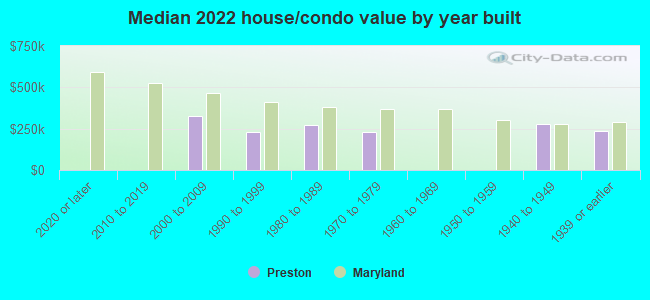
Mean price in 2022:
Detached houses: $290,686
Here: $290,686 State: $526,819
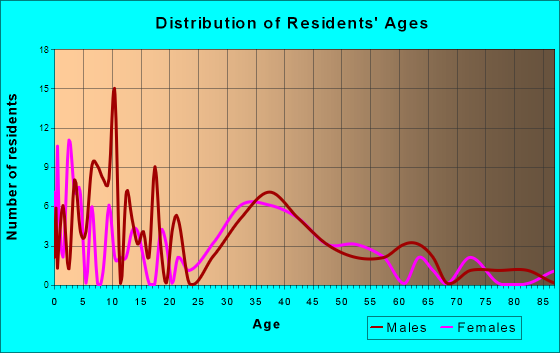
Total population: 690 (Urban population: 0, Rural population: 575 (6 farm, 569 nonfarm))
Houses: 324 (297 occupied: 185 owner occupied, 115 renter occupied)
| % of renters here: | 38% |
| State: | 32% |
Housing density: 578 houses/condos per square mile
Median price asked for vacant for-sale houses and condos in 2022 in this county: $227,401.
Median contract rent in 2022: $824 (lower quartile is $740, upper quartile is $1,057)
Median rent asked for vacant for-rent units in 2022: $817
Median gross rent in Preston, MD in 2022: $1,113
Housing units in Preston with a mortgage: 163 (5 second mortgage, 0 home equity loan, 4 both second mortgage and home equity loan)
Houses without a mortgage: 0
Median household income for houses/condos with a mortgage: $116,349
Median household income for apartments without a mortgage: $40,803
Median monthly housing costs: $1,413
Compare current foreclosures near Preston, MD:
| Photo | Address | Area | Beds / Baths | Price | Details |
|---|---|---|---|---|---|

|
#1
Lednum Ave
Preston, MD 21655
|
- sq. feet
|
2 baths 3 beds |
show details | |

|
#2
Marsh Creek Rd
Preston, MD 21655
|
- sq. feet
|
1 baths 2 beds |
show details | |

|
#3
Everlea Ct
Preston, MD 21655
|
1,344 sq. feet
|
2 baths - beds |
show details | |

|
#4
Hog Creek Rd
Preston, MD 21655
|
1,344 sq. feet
|
2 baths - beds |
show details | |

|
#5
Apple Ln
Preston, MD 21655
|
1,440 sq. feet
|
1 baths - beds |
show details | |

|
#6
Carrs Creek Ln
Preston, MD 21655
|
1,756 sq. feet
|
1 baths - beds |
show details | |

|
#7
Harmony Rd
Preston, MD 21655
|
960 sq. feet
|
1 baths - beds |
show details | |

|
#8
Main St
Preston, MD 21655
|
2,175 sq. feet
|
2 baths - beds |
show details | |

|
#9
Drummer Dr
Preston, MD 21655
|
1,800 sq. feet
|
1 baths - beds |
show details | |

|
#10
Harmony Rd
Preston, MD 21655
|
1,968 sq. feet
|
1 baths - beds |
show details |
| Photo | Address | Area | Beds / Baths | Price | Details |
|---|---|---|---|---|---|

|
#11
Apple Ln
Preston, MD 21655
|
1,575 sq. feet
|
2 baths - beds |
show details | |

|
#12
Statum Rd
Preston, MD 21655
|
1,344 sq. feet
|
2 baths - beds |
show details | |

|
#13
Wood Wharf Rd
Preston, MD 21655
|
- sq. feet
|
- baths - beds |
show details | |

|
#14
Skipton Cordova Rd
Cordova, MD 21625
|
1,256 sq. feet
|
2 baths 2 beds |
$128,250
|
show details |

|
#15
Magnolia Dr
Seaford, DE 19973
|
1,804 sq. feet
|
3 baths 4 beds |
show details | |

|
#16
Hynson Rd
Hurlock, MD 21643
|
- sq. feet
|
2 baths 3 beds |
show details | |

|
#17
Beaver Neck Village Rd
Linkwood, MD 21835
|
1,344 sq. feet
|
2 baths 3 beds |
show details | |

|
#18
E Spruce St
Seaford, DE 19973
|
1,900 sq. feet
|
2 baths 3 beds |
show details | |

|
#19
W Central Ave
Federalsburg, MD 21632
|
1,670 sq. feet
|
1 baths 4 beds |
show details | |

|
#20
Mill St
Secretary, MD 21664
|
- sq. feet
|
2 baths - beds |
show details |
| Photo | Address | Area | Beds / Baths | Price | Details |
|---|---|---|---|---|---|

|
#21
Main St
Trappe, MD 21673
|
1,480 sq. feet
|
1 baths - beds |
show details | |

|
#22
S Main St
Hurlock, MD 21643
|
1,757 sq. feet
|
2 baths - beds |
show details | |

|
#23
Gannon Cir
Easton, MD 21601
|
1,856 sq. feet
|
2 baths - beds |
show details | |

|
#24
Race St
Cambridge, MD 21613
|
1,495 sq. feet
|
2 baths - beds |
show details | |

|
#25
Liberty Ln
Easton, MD 21601
|
1,732 sq. feet
|
3 baths - beds |
show details | |

|
#26
W End Ave
Cambridge, MD 21613
|
1,326 sq. feet
|
1 baths - beds |
show details | |

|
#27
Maryland Ave
Cambridge, MD 21613
|
1,463 sq. feet
|
1 baths - beds |
show details | |

|
#28
Fairfield Ct
Denton, MD 21629
|
1,684 sq. feet
|
3 baths - beds |
show details | |

|
#29
S Paula Lynne Dr
Seaford, DE 19973
|
3,200 sq. feet
|
- baths 3 beds |
show details | |

|
#30
Church Hall Rd
Royal Oak, MD 21662
|
1,944 sq. feet
|
2 baths - beds |
show details |
| Photo | Address | Area | Beds / Baths | Price | Details |
|---|---|---|---|---|---|

|
#31
Foy Rd
Denton, MD 21629
|
716 sq. feet
|
1 baths - beds |
show details | |

|
#32
William St
Cambridge, MD 21613
|
2,256 sq. feet
|
2 baths - beds |
show details | |

|
#33
Dorchester Ave
Cambridge, MD 21613
|
1,852 sq. feet
|
2 baths - beds |
show details | |

|
#34
Bonnie Brook Rd
Cambridge, MD 21613
|
1,040 sq. feet
|
1 baths - beds |
show details | |

|
#35
Evergreen Rd
Oxford, MD 21654
|
1,232 sq. feet
|
2 baths - beds |
show details | |

|
#36
Lockerman St
Denton, MD 21629
|
1,392 sq. feet
|
1 baths - beds |
show details | |

|
#37
Longwoods Rd
Easton, MD 21601
|
2,266 sq. feet
|
3 baths - beds |
show details | |

|
#38
Painted Fern Rd
Denton, MD 21629
|
4,222 sq. feet
|
4 baths - beds |
show details | |

|
#39
Burrsville Rd
Denton, MD 21629
|
2,262 sq. feet
|
2 baths - beds |
show details | |

|
#40
Rosemont Ave
Cambridge, MD 21613
|
672 sq. feet
|
1 baths - beds |
show details |
| Photo | Address | Area | Beds / Baths | Price | Details |
|---|---|---|---|---|---|

|
#41
High St
Cambridge, MD 21613
|
1,232 sq. feet
|
1 baths - beds |
show details | |

|
#42
Drawbridge Rd
Cambridge, MD 21613
|
1,008 sq. feet
|
1 baths - beds |
show details | |

|
#43
Appleby School Rd
Cambridge, MD 21613
|
2,152 sq. feet
|
2 baths - beds |
show details | |

|
#44
Double Fork Rd
Greenwood, DE 19950
|
1,568 sq. feet
|
- baths 3 beds |
show details | |

|
#45
Central Ave
Cambridge, MD 21613
|
948 sq. feet
|
1 baths - beds |
show details | |

|
#46
Stone Boundary Rd
Cambridge, MD 21613
|
1,590 sq. feet
|
1 baths - beds |
show details | |

|
#47
Center St
Cambridge, MD 21613
|
576 sq. feet
|
1 baths - beds |
show details | |

|
#48
Caribbean Ave
Cambridge, MD 21613
|
3,023 sq. feet
|
2 baths - beds |
show details | |

|
#49
Cypress Ct
Denton, MD 21629
|
2,986 sq. feet
|
2 baths - beds |
show details | |

|
Check over 1 million property listings on Foreclosure.com!
|
browse all offers | |||

Latest news about housing in Preston, MD collected exclusively by city-data.com from local newspapers, TV, and radio stations


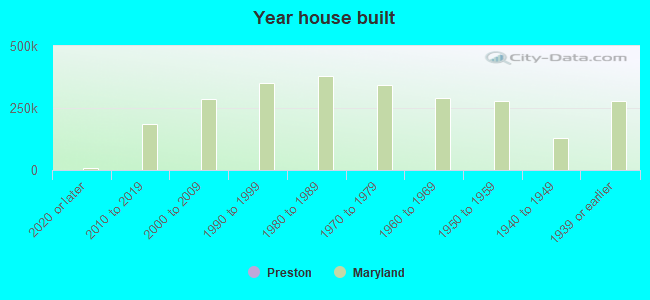
Median year apartment built: 1947
Household type by relationship:
Households: 816- Male householders: 69 (20 living alone), Female householders: 225 (51 living alone)
145 spouses (140 opposite-sex spouses), 19 unmarried partners, (19 opposite-sex unmarried partners), 274 children (271 natural, 3 adopted, 0 stepchildren), 0 grandchildren, 8 brothers or sisters, 15 parents, 0 foster children, 14 other relatives, 47 non-relatives
Size of family households: 65 2-persons, 59 3-persons, 31 4-persons, 37 5-persons, 9 6-persons, 7 7-or-more-persons.
Size of nonfamily households: 74 1-person, 5 2-persons, 9 3-persons.
166 married couples with children.
77 single-parent households (15 men, 62 women).
92.8% of residents of Preston speak English at home.
0.4% of residents speak Spanish at home (100% speak English very well).
4.9% of residents speak other Indo-European language at home (44% speak English very well, 42% speak English well, 14% speak English not well).
Foreign born population: 39 (4.8%)
(12.8% of them are naturalized citizens)
| Here: | 7.3 |
| State: | 7.3 |
| Here: | 5.6 |
| State: | 4.2 |
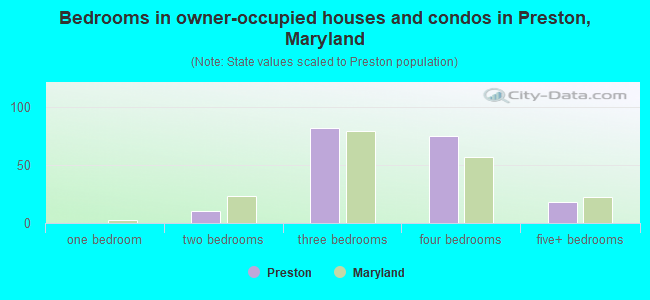
- Bedrooms in owner-occupied houses and condos in Preston, Maryland
- 0no bedroom
- 01 bedroom
- 102 bedrooms
- 823 bedrooms
- 754 bedrooms
- 185+ bedrooms
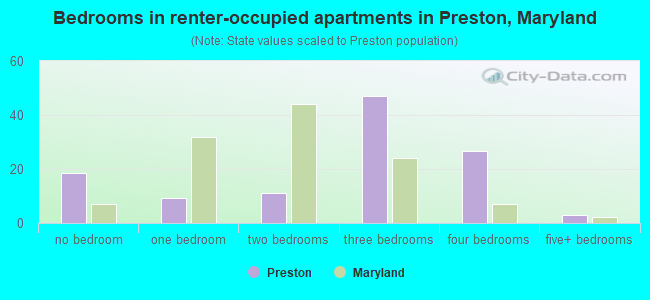
- Bedrooms in renter-occupied apartments in Preston, Maryland
- 18no bedroom
- 91 bedroom
- 112 bedrooms
- 473 bedrooms
- 274 bedrooms
- 35+ bedrooms
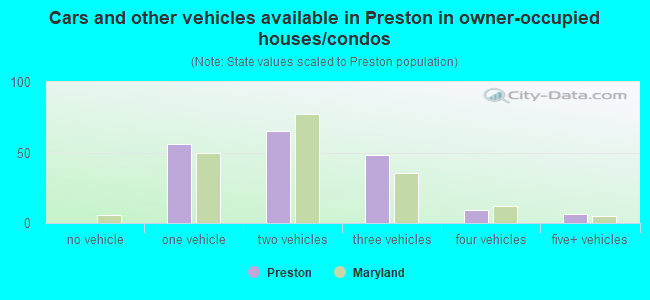
- Cars and other vehicles available in Preston in owner-occupied houses/condos
- 0no vehicle
- 561 vehicle
- 662 vehicles
- 483 vehicles
- 94 vehicles
- 65+ vehicles
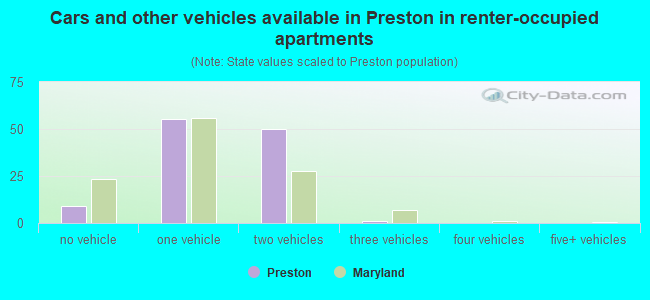
- Cars and other vehicles available in Preston in renter-occupied apartments
- 9no vehicle
- 551 vehicle
- 502 vehicles
- 13 vehicles
- 04 vehicles
- 05+ vehicles
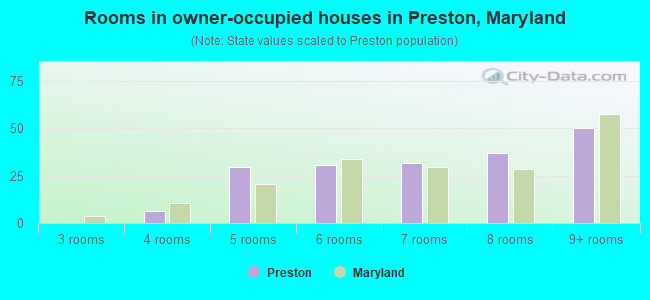
- Rooms in owner-occupied houses in Preston, Maryland
- 01 room
- 02 rooms
- 03 rooms
- 64 rooms
- 305 rooms
- 316 rooms
- 327 rooms
- 378 rooms
- 509+ rooms
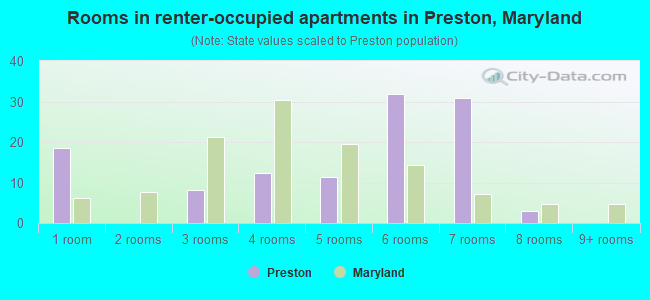
- Rooms in renter-occupied apartments in Preston, Maryland
- 181 room
- 02 rooms
- 83 rooms
- 124 rooms
- 115 rooms
- 326 rooms
- 317 rooms
- 38 rooms
- 09+ rooms
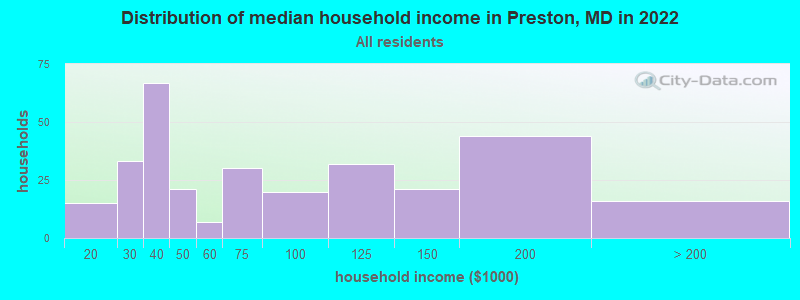
Preston, MD household income distribution

- 15$10,000 to $19,999
- 33$20,000 to $29,999
- 67$30,000 to $39,999
- 21$40,000 to $49,999
- 7$50,000 to $59,999
- 30$60,000 to $74,999
- 20$75,000 to $99,999
- 32$100,000 to $124,999
- 21$125,000 to $149,999
- 44$150,000 to $199,999
- 16$200,000 or more
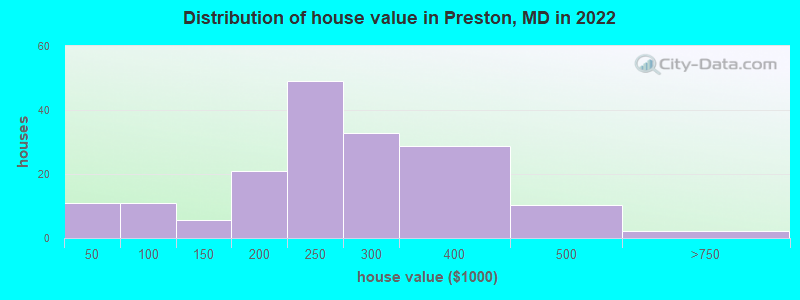
Home value of owner - occupied houses in 2022 in Preston, MD
-
- 3$15,000 to $19,999
- 3$20,000 to $24,999
- 3$40,000 to $49,999
- 7$90,000 to $99,999
- 4$100,000 to $124,999
- 0$125,000 to $149,999
- 6$150,000 to $174,999
- 14$175,000 to $199,999
- 49$200,000 to $249,999
- 32$250,000 to $299,999
- 28$300,000 to $399,999
- 10$400,000 to $499,999
- 2$500,000 to $749,999
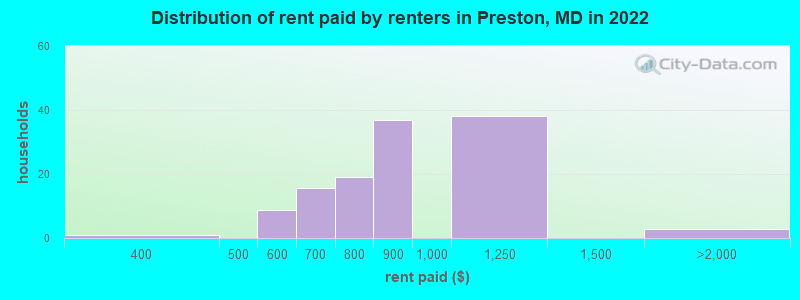
Rent paid by renters in 2022 in Preston, MD
-
- 0$350 to $399
- 8$550 to $599
- 15$600 to $649
- 18$750 to $799
- 36$800 to $899
- 38$1,000 to $1,249
- 2$1,500 to $1,999
Percentage of workers working in this county: 39.8%
Number of people working at home: 104 (25.6% of all workers)

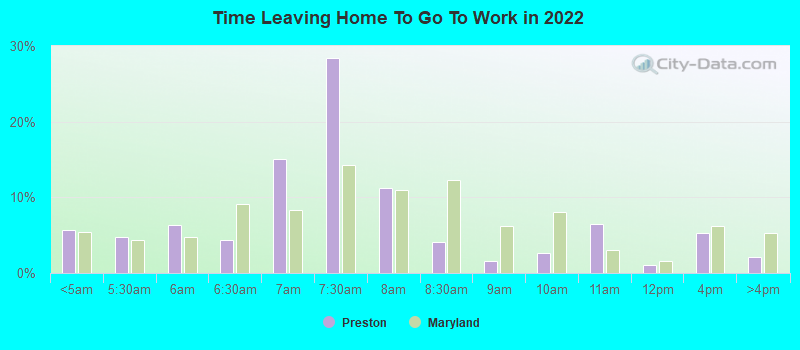
Travel time to work (commute)
- Less than 5 minutes: 3
- 5 to 9 minutes: 20
- 10 to 14 minutes: 31
- 15 to 19 minutes: 69
- 20 to 24 minutes: 92
- 25 to 29 minutes: 14
- 30 to 34 minutes: 22
- 35 to 39 minutes: 17
- 40 to 44 minutes: 1
- 45 to 59 minutes: 19
- 60 to 89 minutes: 12
- 90 or more minutes: 9
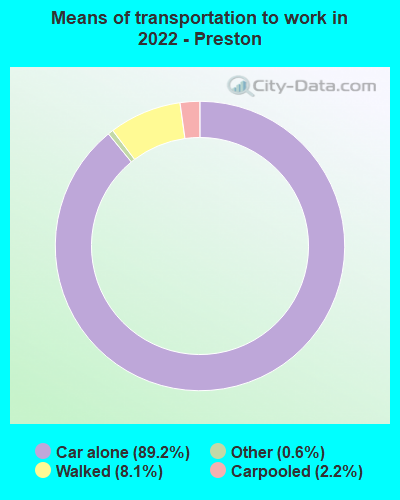
Means of transportation to work:
- Drove a car alone: 436 (79.1%)
- Carpooled: 9 (1.6%)
- Taxi: 5 (0.9%)
- Walked: 35 (6.4%)
- Worked at home: 31 (5.6%)
- Unemployment by race in 2022
- Unemployment rate for White non-Hispanic residents
- 0.9%Males
- 0.4%Females
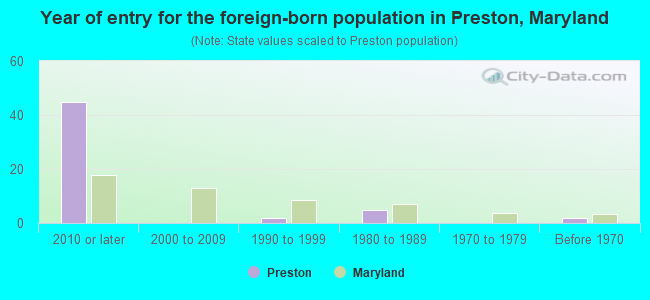
- Year of entry for the foreign-born population in Preston, Maryland
- 452010 or later
- 02000 to 2009
- 21990 to 1999
- 51980 to 1989
- 01970 to 1979
- 2Before 1970
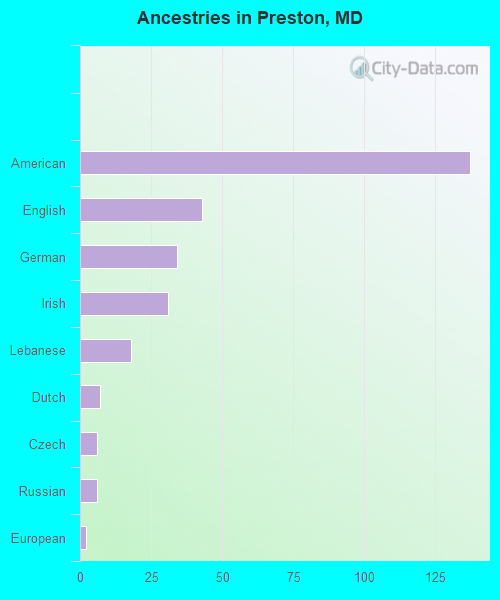
First ancestries reported:
- American: 137 (37.6%)
- English: 43 (11.8%)
- German: 34 (9.3%)
- Irish: 31 (8.5%)
- Lebanese: 18 (4.9%)
- Dutch: 7 (1.9%)
- Czech: 6 (1.6%)
- Russian: 6 (1.6%)
- European: 2 (0.5%)
Most common places of birth for foreign-born residents (%):
| Preston: | 71.8% (28) |
| Maryland: | 6.4% (61,725) |
| Preston: | 17.9% (7) |
| Maryland: | 1.0% (9,481) |
| Preston: | 2.6% (1) |
| Maryland: | 0.6% (5,899) |
Place of birth for U.S.-born residents:
- This state: 617
- Other state: 153
- Northeast: 57
- Midwest: 12
- South: 53
- West: 31
97.8% of Preston residents lived in the same house 1 years ago.
Out of people who lived in different houses, 26.3% lived in this county.
Out of people who lived in different counties, 100.0% lived in Maryland.
| Preston: | 97.8% |
| State average: | 88.5% |
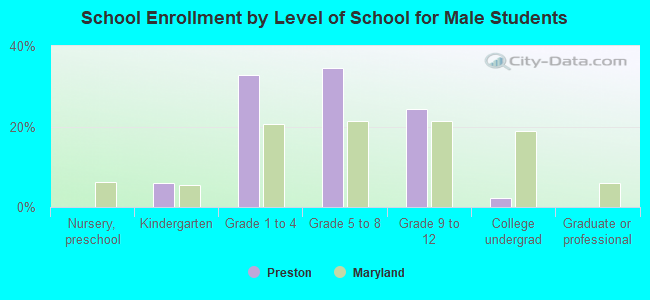
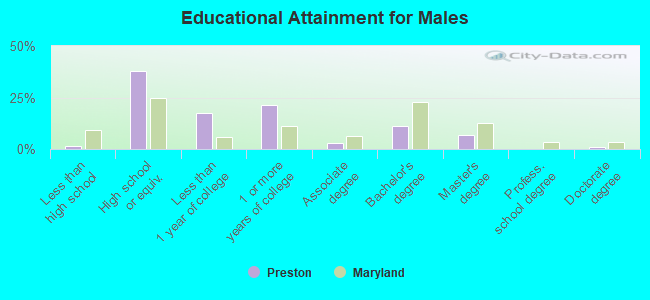
Education attainment for males 25 years and older:
- No schooling: 0
- Nursery to 4th grade: 0
- 5th and 6th grade: 0
- 7th and 8th grade: 1
- 9th grade: 0
- 10th grade: 3
- 11th grade: 0
- 12th grade, no diploma: 0
- High school graduate (or equivalency): 93
- Less than 1 year of college: 43
- Some college more than 1 year, no degree: 53
- Associate degree: 7
- Bachelor's degree: 27
- Master's degree: 17
- Professional school degree: 0
- Doctorate degree: 2
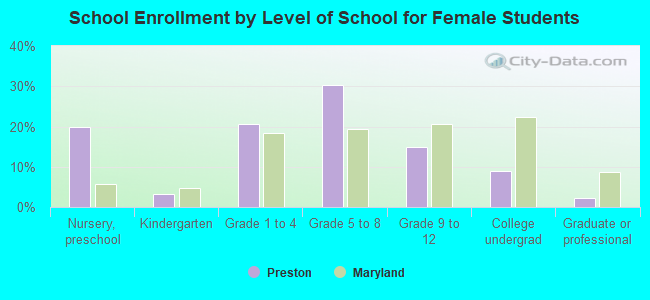
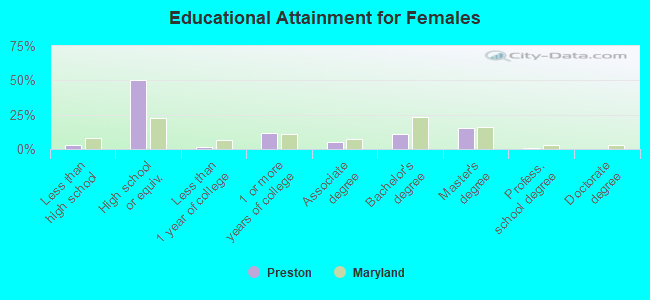
Education attainment for females 25 years and older:
- No schooling: 0
- Nursery to 4th grade: 0
- 5th and 6th grade: 0
- 7th and 8th grade: 2
- 9th grade: 2
- 10th grade: 0
- 11th grade: 2
- 12th grade, no diploma: 3
- High school graduate (or equivalency): 141
- Less than 1 year of college: 5
- Some college more than 1 year, no degree: 33
- Associate degree: 15
- Bachelor's degree: 31
- Master's degree: 44
- Professional school degree: 3
- Doctorate degree: 1
Housing units in structures:
- One, detached: 276
- One, attached: 14
- 5 to 9: 24
- 10 to 19: 10
Housing units lacking complete kitchen facilities in 2022: 3.4%
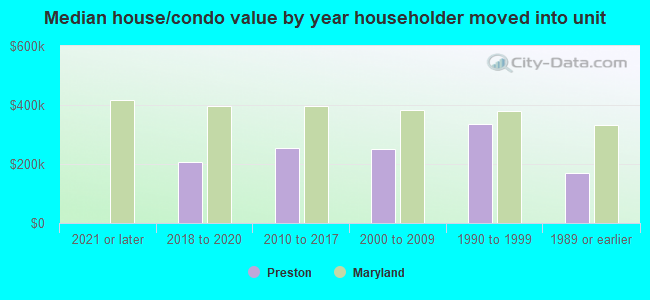
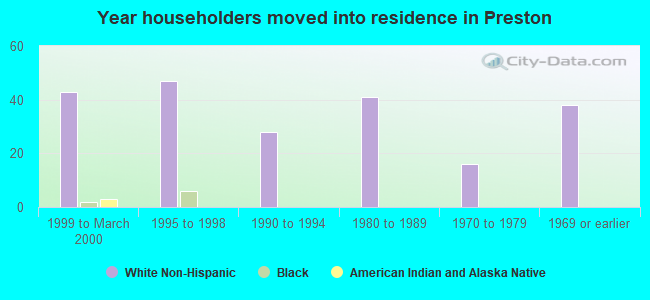
House/condo owner moved in on average 11 years ago
Renter moved in on average 6 years ago
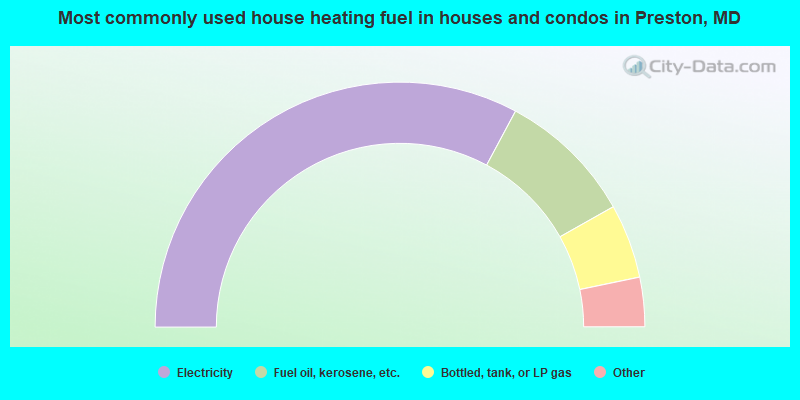
- 66.3%Electricity
- 18.2%Fuel oil, kerosene, etc.
- 9.9%Bottled, tank, or LP gas
- 3.3%Wood
- 1.1%Solar energy
- 1.1%Other fuel
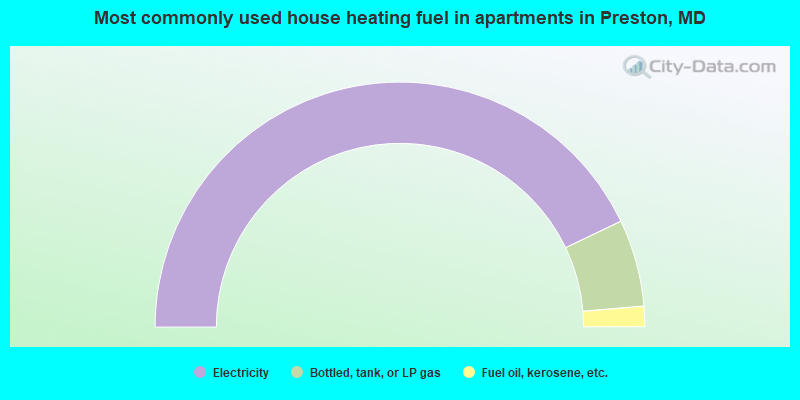
- 85.8%Electricity
- 11.5%Bottled, tank, or LP gas
- 2.7%Fuel oil, kerosene, etc.
Private vs. public school enrollment:
| Here: | 0.0% |
| Maryland: | 15.2% |
| Here: | 5.0% |
| Maryland: | 14.4% |
| Here: | 0.0% |
| Maryland: | 20.2% |