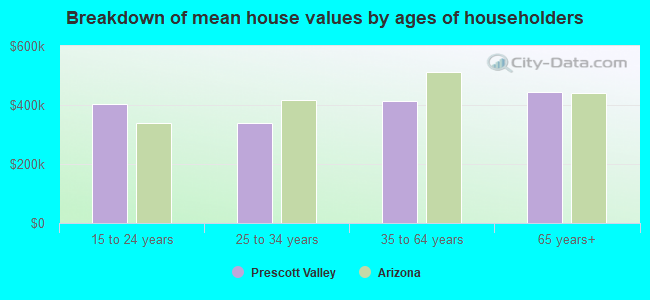
Prescott Valley, AZ (Arizona) Houses and Residents
| Prescott Valley: | $419,486 |
| Arizona: | $402,800 |
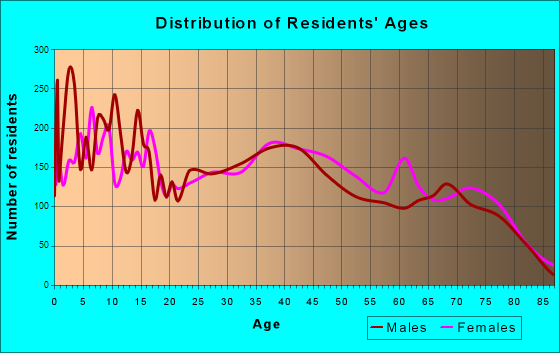
Total population: 41,075 (Urban population: 21,251 (21,223 inside urbanized areas, 28 inside urban clusters), Rural population: 2,346 (all nonfarm))
Houses: 21,881 (20,500 occupied: 14,650 owner occupied, 5,936 renter occupied)
| % of renters here: | 29% |
| State: | 33% |
Housing density: 690 houses/condos per square mile
Median price asked for vacant for-sale houses and condos in 2022: $571,711.
Median contract rent in 2022: $1,227 (lower quartile is $824, upper quartile is $1,632)
Median rent asked for vacant for-rent units in 2022: $1,001
Median gross rent in Prescott Valley, AZ in 2022: $1,393
Housing units in Prescott Valley with a mortgage: 8,991 (366 second mortgage, 11 home equity loan, 347 both second mortgage and home equity loan)
Houses without a mortgage: 0
Median household income for houses/condos with a mortgage: $79,427
Median household income for apartments without a mortgage: $60,733
Median monthly housing costs: $1,224
Compare current foreclosures in Prescott Valley, AZ:
| Photo | Address | Area | Beds / Baths | Price | Details |
|---|---|---|---|---|---|

|
#1
N Sheridan Ln
Prescott Valley, AZ 86314
|
1,419 sq. feet
|
2 baths 3 beds |
show details | |

|
#2
N Catherine Dr
Prescott Valley, AZ 86314
|
1,261 sq. feet
|
2 baths 3 beds |
show details | |

|
#3
E Manley Dr
Prescott Valley, AZ 86314
|
989 sq. feet
|
2 baths 2 beds |
show details | |

|
#4
E Ackland Dr
Prescott Valley, AZ 86314
|
1,459 sq. feet
|
2 baths 4 beds |
show details | |

|
#5
N Taylor Dr
Prescott Valley, AZ 86314
|
1,512 sq. feet
|
2 baths 3 beds |
show details | |

|
#6
N Mobile Cir E
Prescott Valley, AZ 86314
|
- sq. feet
|
1 baths 3 beds |
show details | |

|
#7
N Catherine Dr
Prescott Valley, AZ 86314
|
1,395 sq. feet
|
2 baths 3 beds |
show details | |

|
#8
N Tevy Trl
Prescott Valley, AZ 86315
|
2,151 sq. feet
|
- baths - beds |
show details | |

|
#9
N Navajo Dr Apt B
Prescott Valley, AZ 86314
|
- sq. feet
|
- baths - beds |
show details | |

|
#10
N Truwood Dr Apt B
Prescott Valley, AZ 86314
|
- sq. feet
|
- baths - beds |
show details |
| Photo | Address | Area | Beds / Baths | Price | Details |
|---|---|---|---|---|---|

|
#11
E Galaxy Way
Prescott Valley, AZ 86314
|
1,743 sq. feet
|
- baths - beds |
show details | |

|
#12
E Marrow Rd
Prescott Valley, AZ 86315
|
- sq. feet
|
- baths - beds |
show details | |

|
#13
E Livingston Loop
Prescott Valley, AZ 86314
|
- sq. feet
|
- baths - beds |
show details | |

|
#14
N Gallery Ln
Prescott Valley, AZ 86314
|
1,501 sq. feet
|
- baths - beds |
show details | |

|
#15
E Devon Ct
Prescott Valley, AZ 86314
|
- sq. feet
|
- baths - beds |
show details | |

|
#16
E Quasar Rd
Prescott Valley, AZ 86315
|
- sq. feet
|
- baths - beds |
show details | |

|
#17
N Date Creek Dr
Prescott Valley, AZ 86314
|
1,374 sq. feet
|
- baths - beds |
show details | |

|
#18
N Mobile Cir E
Prescott Valley, AZ 86314
|
- sq. feet
|
- baths - beds |
show details | |

|
#19
N Command Point Dr
Prescott Valley, AZ 86315
|
1,804 sq. feet
|
- baths - beds |
show details | |

|
#20
N Cinnabar Dr
Prescott Valley, AZ 86314
|
1,465 sq. feet
|
- baths - beds |
show details |
| Photo | Address | Area | Beds / Baths | Price | Details |
|---|---|---|---|---|---|

|
#21
E Powers Ave
Prescott Valley, AZ 86314
|
1,596 sq. feet
|
- baths - beds |
show details | |

|
#22
N Ardmore Ave
Prescott Valley, AZ 86314
|
- sq. feet
|
- baths - beds |
show details | |

|
#23
N Sheridan Ln
Prescott Valley, AZ 86314
|
1,994 sq. feet
|
- baths - beds |
show details | |

|
#24
N Fence Post Pl
Prescott Valley, AZ 86314
|
- sq. feet
|
- baths - beds |
show details | |

|
#25
E Greer Ln
Prescott Valley, AZ 86314
|
- sq. feet
|
- baths - beds |
show details | |

|
#26
E Danielle Dr
Prescott Valley, AZ 86315
|
- sq. feet
|
- baths - beds |
show details | |

|
#27
N Navajo Dr
Prescott Valley, AZ 86314
|
1,434 sq. feet
|
- baths - beds |
show details | |

|
#28
N Dryden St
Prescott Valley, AZ 86314
|
- sq. feet
|
- baths - beds |
show details | |

|
#29
N Valorie Dr
Prescott Valley, AZ 86314
|
- sq. feet
|
- baths - beds |
show details | |

|
#30
E Las Flores Ave
Prescott Valley, AZ 86314
|
1,336 sq. feet
|
- baths - beds |
show details |
| Photo | Address | Area | Beds / Baths | Price | Details |
|---|---|---|---|---|---|

|
#31
N Catherine Dr
Prescott Valley, AZ 86314
|
1,277 sq. feet
|
- baths - beds |
show details | |

|
#32
N Navajo Dr
Prescott Valley, AZ 86314
|
1,513 sq. feet
|
- baths - beds |
show details | |

|
#33
E Yellowglen Dr
Prescott Valley, AZ 86314
|
1,442 sq. feet
|
- baths - beds |
show details | |

|
#34
E Lantern Ln E
Prescott Valley, AZ 86314
|
1,224 sq. feet
|
- baths - beds |
show details | |

|
#35
N Lava Ln
Prescott Valley, AZ 86314
|
1,692 sq. feet
|
- baths - beds |
show details | |

|
#36
E Lantern Ln W
Prescott Valley, AZ 86314
|
1,874 sq. feet
|
- baths - beds |
show details | |

|
#37
E Beckett Trl
Prescott Valley, AZ 86314
|
- sq. feet
|
- baths - beds |
show details | |

|
#38
N Carla Vista Dr
Prescott Valley, AZ 86314
|
1,164 sq. feet
|
- baths - beds |
show details | |

|
#39
N Marden Ln
Prescott Valley, AZ 86314
|
- sq. feet
|
- baths - beds |
show details | |

|
#40
N Date Creek Dr
Prescott Valley, AZ 86314
|
1,564 sq. feet
|
- baths - beds |
show details |
| Photo | Address | Area | Beds / Baths | Price | Details |
|---|---|---|---|---|---|

|
#41
E Beckett Trl
Prescott Valley, AZ 86314
|
- sq. feet
|
- baths - beds |
show details | |

|
#42
E Prickly Pear Path
Prescott Valley, AZ 86315
|
1,753 sq. feet
|
- baths - beds |
show details | |

|
#43
E Bravo Ln
Prescott Valley, AZ 86314
|
2,619 sq. feet
|
- baths - beds |
show details | |

|
#44
N Moonlight Way
Prescott Valley, AZ 86314
|
840 sq. feet
|
- baths - beds |
show details | |

|
#45
E Nancy Rd
Prescott Valley, AZ 86314
|
1,248 sq. feet
|
- baths - beds |
show details | |

|
#46
N Valorie Dr
Prescott Valley, AZ 86314
|
- sq. feet
|
- baths - beds |
show details | |

|
Check over 1 million property listings on Foreclosure.com!
|
browse all offers | |||


 | How are the Valley View Apartments in Prescott Valley? (0 replies) |
| Flipped Homes (23 replies) |
| What's up with all the foreclosed homes below $200k? (19 replies) |
| Prescott Valley changing its identity (1 reply) |
| Hilo Hawai'i to Prescott Move – What’s up with the seemingly overpriced homes? (45 replies) |
| 3000+ Proposed Housing Units In Dewey (23 replies) |
Median year apartment built: 2004
Household type by relationship:
Households: 48,667- Male householders: 10,779 (2,376 living alone), Female householders: 9,689 (2,955 living alone)
10,604 spouses (10,538 opposite-sex spouses), 1,599 unmarried partners, (1,587 opposite-sex unmarried partners), 10,634 children (9,611 natural, 346 adopted, 675 stepchildren), 1,081 grandchildren, 525 brothers or sisters, 501 parents, 53 foster children, 817 other relatives, 2,114 non-relatives
- In group quarters: 267
Size of family households: 8,127 2-persons, 2,179 3-persons, 1,570 4-persons, 1,248 5-persons, 309 6-persons, 178 7-or-more-persons.
Size of nonfamily households: 5,188 1-person, 1,100 2-persons, 454 3-persons, 75 4-persons, 7 6-persons.
5,222 married couples with children.
2,361 single-parent households (1,182 men, 1,179 women).
84.7% of residents of Prescott Valley speak English at home.
13.8% of residents speak Spanish at home (56% speak English very well, 21% speak English well, 16% speak English not well, 6% don't speak English at all).
1.1% of residents speak other Indo-European language at home (71% speak English very well, 19% speak English well, 10% speak English not well).
0.7% of residents speak Asian or Pacific Island language at home (59% speak English very well, 38% speak English well, 3% speak English not well).
0.2% of residents speak other language at home (63% speak English very well, 37% speak English well).
Foreign born population: 3,891 (8.0%)
(48.5% of them are naturalized citizens)
| Here: | 5.7 |
| State: | 6.0 |
| Here: | 4.4 |
| State: | 4.1 |
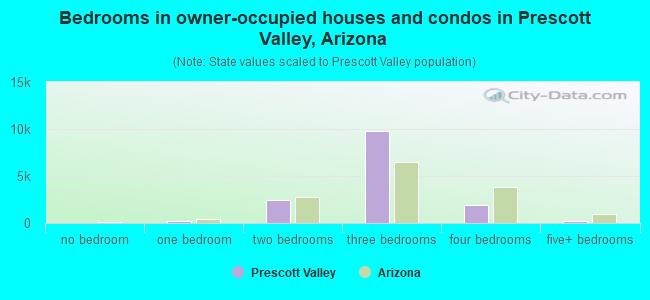
- Bedrooms in owner-occupied houses and condos in Prescott Valley, Arizona
- 23no bedroom
- 2391 bedroom
- 2,4062 bedrooms
- 9,8183 bedrooms
- 1,9164 bedrooms
- 2485+ bedrooms
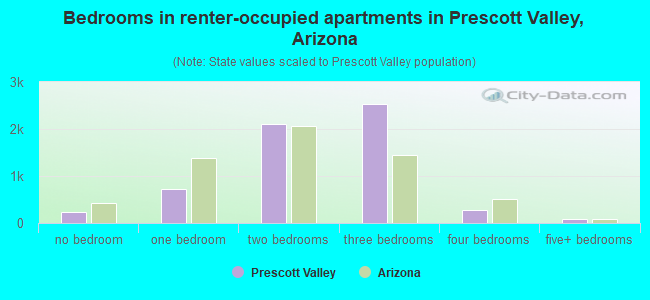
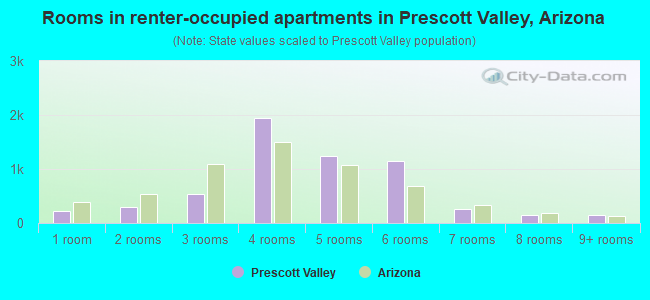
- Bedrooms in renter-occupied apartments in Prescott Valley, Arizona
- 224no bedroom
- 7291 bedroom
- 2,1012 bedrooms
- 2,5293 bedrooms
- 2794 bedrooms
- 755+ bedrooms
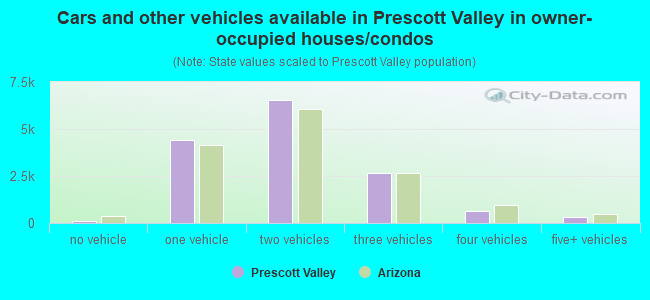
- Cars and other vehicles available in Prescott Valley in owner-occupied houses/condos
- 88no vehicle
- 4,4091 vehicle
- 6,5242 vehicles
- 2,6503 vehicles
- 6374 vehicles
- 3425+ vehicles
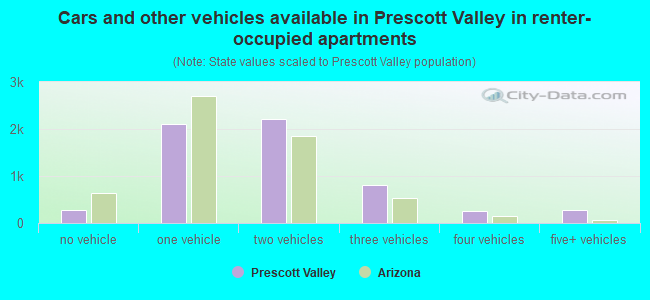
- Cars and other vehicles available in Prescott Valley in renter-occupied apartments
- 277no vehicle
- 2,1131 vehicle
- 2,2122 vehicles
- 8043 vehicles
- 2494 vehicles
- 2825+ vehicles
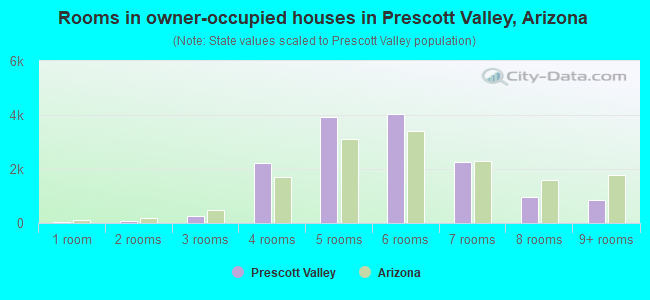
- Rooms in owner-occupied houses in Prescott Valley, Arizona
- 231 room
- 852 rooms
- 2683 rooms
- 2,2344 rooms
- 3,9255 rooms
- 4,0416 rooms
- 2,2687 rooms
- 9508 rooms
- 8579+ rooms
- Rooms in renter-occupied apartments in Prescott Valley, Arizona
- 2241 room
- 2952 rooms
- 5343 rooms
- 1,9394 rooms
- 1,2485 rooms
- 1,1456 rooms
- 2517 rooms
- 1558 rooms
- 1469+ rooms
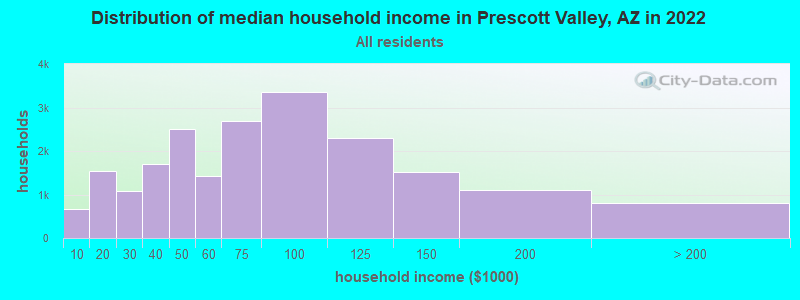
Prescott Valley, AZ household income distribution

- 657Less than $10,000
- 1,533$10,000 to $19,999
- 1,079$20,000 to $29,999
- 1,696$30,000 to $39,999
- 2,508$40,000 to $49,999
- 1,418$50,000 to $59,999
- 2,684$60,000 to $74,999
- 3,345$75,000 to $99,999
- 2,296$100,000 to $124,999
- 1,522$125,000 to $149,999
- 1,093$150,000 to $199,999
- 798$200,000 or more
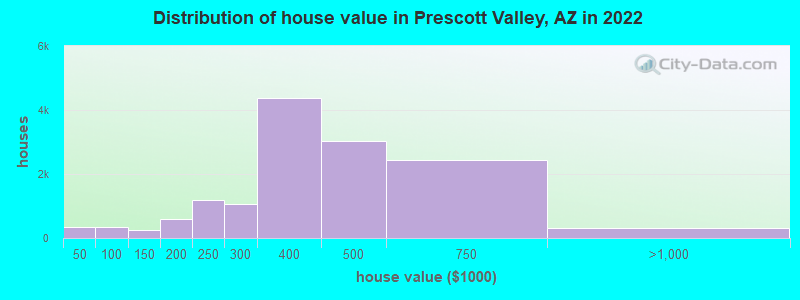
Home value of owner - occupied houses in 2022 in Prescott Valley, AZ
-
- 63Less than $10,000
- 13$10,000 to $14,999
- 19$15,000 to $19,999
- 42$20,000 to $24,999
- 14$30,000 to $34,999
- 166$35,000 to $39,999
- 38$40,000 to $49,999
- 8$50,000 to $59,999
- 33$60,000 to $69,999
- 89$70,000 to $79,999
- 94$80,000 to $89,999
- 66$90,000 to $99,999
- 134$100,000 to $124,999
- 109$125,000 to $149,999
- 460$150,000 to $174,999
- 139$175,000 to $199,999
- 1,191$200,000 to $249,999
- 1,074$250,000 to $299,999
- 4,385$300,000 to $399,999
- 3,017$400,000 to $499,999
- 2,426$500,000 to $749,999
- 278$750,000 to $999,999
- 37$1,000,000 to $1,499,999
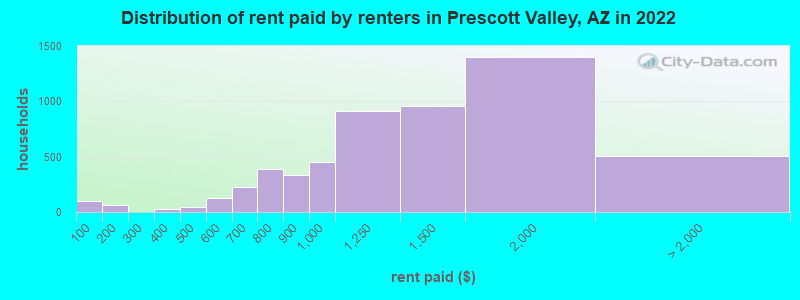
Rent paid by renters in 2022 in Prescott Valley, AZ
-
- 97Less than $100
- 64$150 to $199
- 11$300 to $349
- 19$350 to $399
- 48$450 to $499
- 114$500 to $549
- 14$550 to $599
- 81$600 to $649
- 148$650 to $699
- 55$700 to $749
- 329$750 to $799
- 331$800 to $899
- 448$900 to $999
- 911$1,000 to $1,249
- 959$1,250 to $1,499
- 1,398$1,500 to $1,999
- 269$2,000 to $2,499
- 240No cash rent
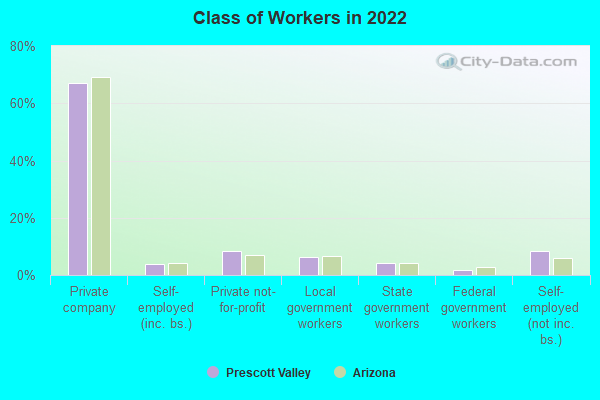
Percentage of workers working in this county: 98.8%
Number of people working at home: 2,883 (14.3% of all workers)
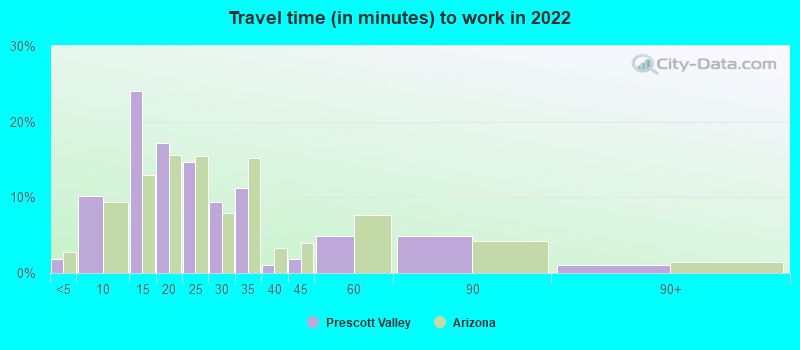
Travel time to work (commute)
- Less than 5 minutes: 211
- 5 to 9 minutes: 1,525
- 10 to 14 minutes: 4,188
- 15 to 19 minutes: 3,020
- 20 to 24 minutes: 3,123
- 25 to 29 minutes: 1,576
- 30 to 34 minutes: 2,460
- 35 to 39 minutes: 67
- 40 to 44 minutes: 298
- 45 to 59 minutes: 282
- 60 to 89 minutes: 446
- 90 or more minutes: 393
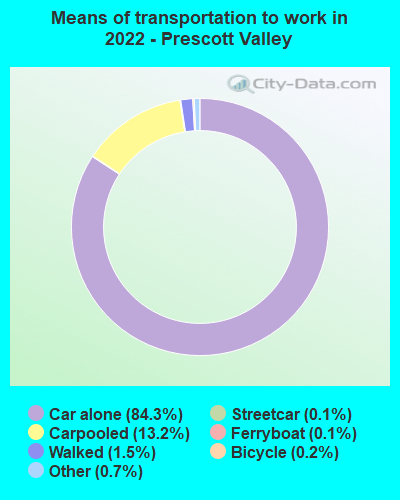
Means of transportation to work:
- Drove a car alone: 11,660 (71.2%)
- Carpooled: 1,587 (9.7%)
- Subway or elevated rail: 18 (0.1%)
- Ferryboat: 19 (0.1%)
- Taxi: 89 (0.5%)
- Bicycle: 31 (0.2%)
- Walked: 178 (1.1%)
- Worked at home: 2,883 (17.6%)
- Unemployment by race in 2022
- Unemployment rate for White non-Hispanic residents
- 1.5%Males
- 4.8%Females
- Unemployment rate for American Indian and Alaska Native residents
- 23.7%Females
- Unemployment rate for other race residents
- 3.9%Females
- Unemployment rate for two or more race residents
- 0.8%Males
- 16.8%Females
- Unemployment rate for Hispanic or Latino residents
- 1.8%Males
- 16.5%Females
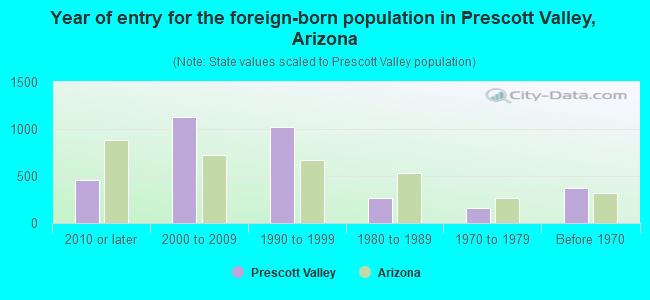
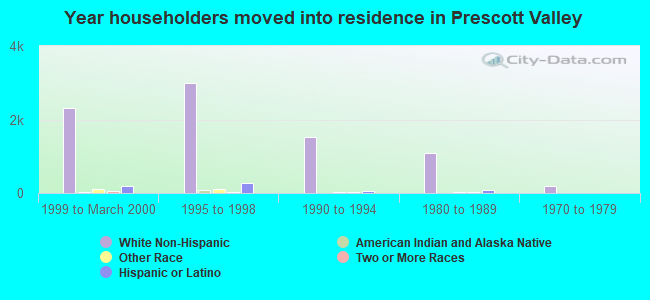
- Year of entry for the foreign-born population in Prescott Valley, Arizona
- 4552010 or later
- 1,1272000 to 2009
- 1,0181990 to 1999
- 2681980 to 1989
- 1631970 to 1979
- 374Before 1970
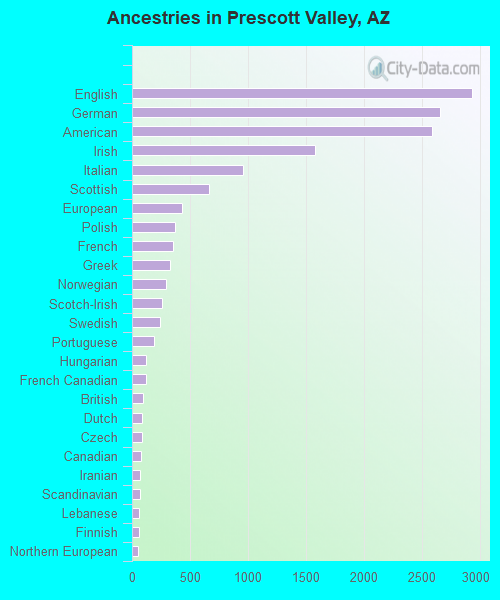
First ancestries reported:
- English: 2,932 (13.6%)
- German: 2,659 (12.3%)
- American: 2,587 (12.0%)
- Irish: 1,577 (7.3%)
- Italian: 955 (4.4%)
- Scottish: 664 (3.1%)
- European: 429 (2.0%)
- Polish: 369 (1.7%)
- French: 355 (1.6%)
- Greek: 329 (1.5%)
- Norwegian: 291 (1.3%)
- Scotch-Irish: 263 (1.2%)
- Swedish: 244 (1.1%)
- Portuguese: 192 (0.9%)
- Hungarian: 120 (0.6%)
- French Canadian: 117 (0.5%)
- British: 93 (0.4%)
- Dutch: 88 (0.4%)
- Czech: 86 (0.4%)
- Canadian: 78 (0.4%)
- Iranian: 73 (0.3%)
- Scandinavian: 65 (0.3%)
- Lebanese: 60 (0.3%)
- Finnish: 58 (0.3%)
- Northern European: 55 (0.3%)
- Russian: 54 (0.2%)
- Romanian: 52 (0.2%)
- Armenian: 48 (0.2%)
- Syrian: 34 (0.2%)
- Palestinian: 30 (0.1%)
- Jamaican: 28 (0.1%)
- Eastern European: 26 (0.1%)
- Welsh: 18 (0.08%)
- Luxembourger: 14 (0.06%)
- Lithuanian: 13 (0.06%)
- Czechoslovakian: 12 (0.06%)
- Croatian: 11 (0.05%)
- Turkish: 10 (0.05%)
- Danish: 6 (0.03%)
- Serbian: 6 (0.03%)
Most common places of birth for foreign-born residents (%):
| Prescott Valley: | 65.3% (2,546) |
| Arizona: | 53.4% (500,086) |
| Prescott Valley: | 3.4% (132) |
| Arizona: | 4.3% (40,102) |
| Prescott Valley: | 2.7% (107) |
| Arizona: | 1.5% (14,058) |
| Prescott Valley: | 2.5% (97) |
| Arizona: | 2.1% (19,199) |
| Prescott Valley: | 2.3% (89) |
| Arizona: | 0.6% (5,893) |
| Prescott Valley: | 2.2% (87) |
| Arizona: | 2.3% (21,275) |
| Prescott Valley: | 1.6% (64) |
| Arizona: | 0.5% (5,025) |
| Prescott Valley: | 1.6% (62) |
| Arizona: | 3.2% (30,378) |
| Prescott Valley: | 1.6% (62) |
| Arizona: | 0.4% (3,628) |
Place of birth for U.S.-born residents:
- This state: 15,179
- Other state: 29,116
- Northeast: 3,354
- Midwest: 7,477
- South: 3,367
- West: 15,335
84.2% of Prescott Valley residents lived in the same house 1 years ago.
Out of people who lived in different houses, 27.5% lived in this county.
Out of people who lived in different counties, 36.5% lived in Arizona.
| Prescott Valley: | 84.2% |
| State average: | 86.0% |
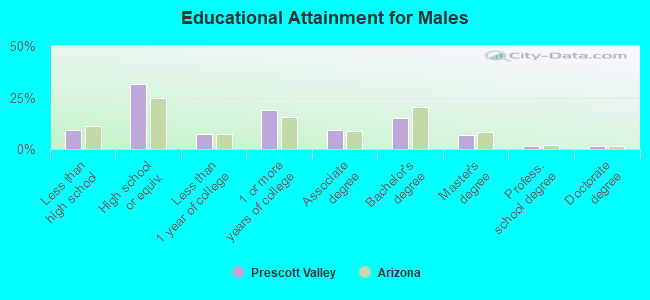
Education attainment for males 25 years and older:
- No schooling: 307
- Nursery to 4th grade: 4
- 5th and 6th grade: 48
- 7th and 8th grade: 74
- 9th grade: 250
- 10th grade: 202
- 11th grade: 537
- 12th grade, no diploma: 230
- High school graduate (or equivalency): 5,668
- Less than 1 year of college: 1,290
- Some college more than 1 year, no degree: 3,416
- Associate degree: 1,622
- Bachelor's degree: 2,727
- Master's degree: 1,209
- Professional school degree: 222
- Doctorate degree: 231
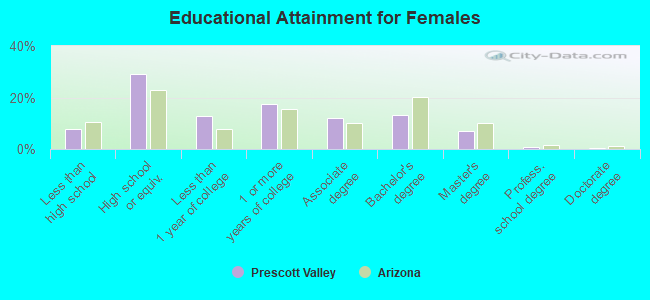
Education attainment for females 25 years and older:
- No schooling: 129
- Nursery to 4th grade: 47
- 5th and 6th grade: 149
- 7th and 8th grade: 134
- 9th grade: 209
- 10th grade: 170
- 11th grade: 279
- 12th grade, no diploma: 337
- High school graduate (or equivalency): 5,323
- Less than 1 year of college: 2,322
- Some college more than 1 year, no degree: 3,184
- Associate degree: 2,188
- Bachelor's degree: 2,433
- Master's degree: 1,252
- Professional school degree: 139
- Doctorate degree: 96
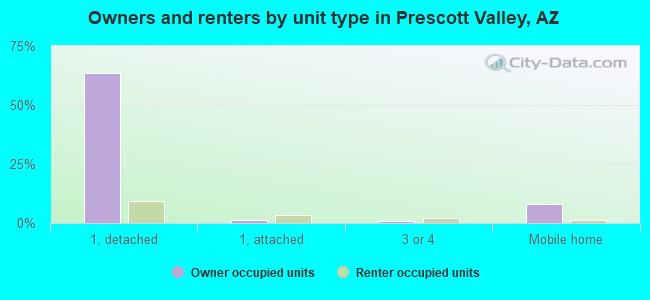
Housing units in structures:
- One, detached: 15,281
- One, attached: 955
- Two: 1,029
- 3 or 4: 932
- 5 to 9: 378
- 10 to 19: 131
- 20 to 49: 162
- 50 or more: 277
- Mobile homes: 2,720
- Boats, RVs, vans, etc.: 11
Median worth of mobile homes: $214,147
Housing units lacking complete kitchen facilities in 2022: 0.6%
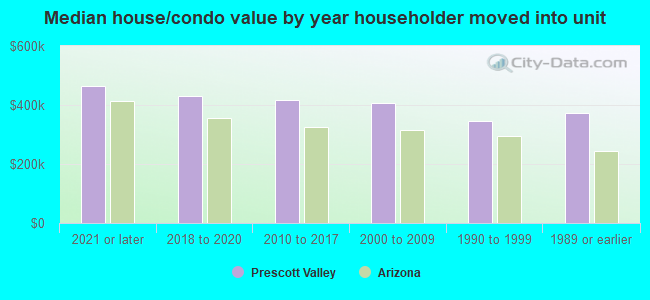
House/condo owner moved in on average 7 years ago
Renter moved in on average 1 years ago
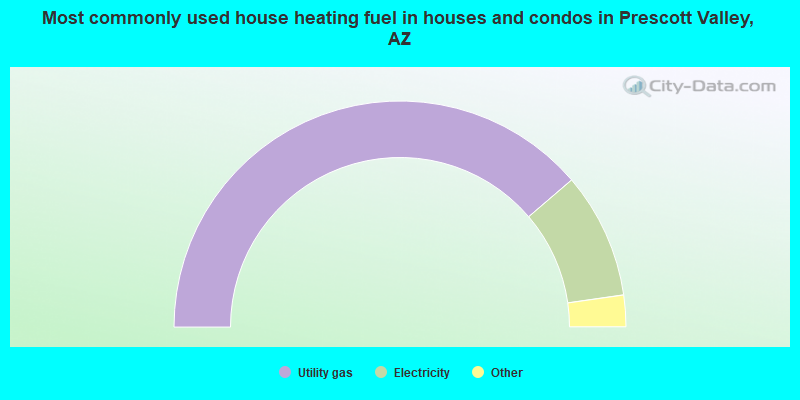
- 77.4%Utility gas
- 18.0%Electricity
- 2.9%Bottled, tank, or LP gas
- 1.2%Wood
- 0.4%Solar energy
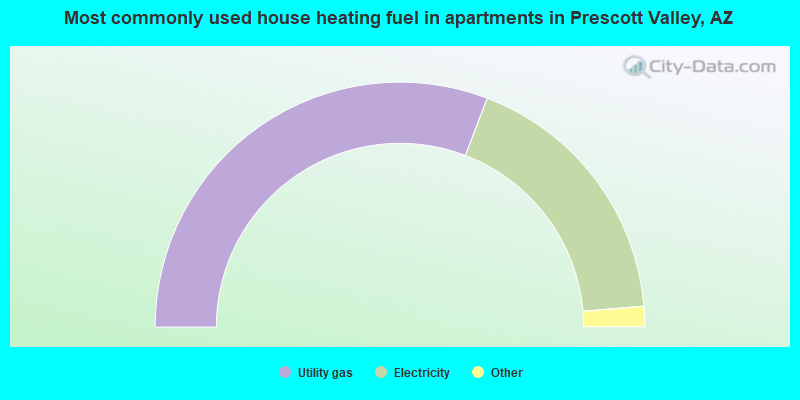
- 61.6%Utility gas
- 35.7%Electricity
- 2.3%Bottled, tank, or LP gas
- 0.3%Other fuel
- 0.1%No fuel used
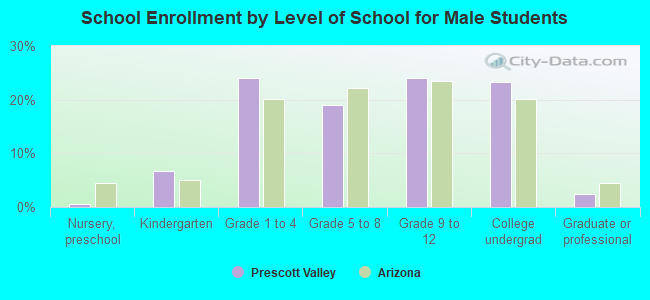
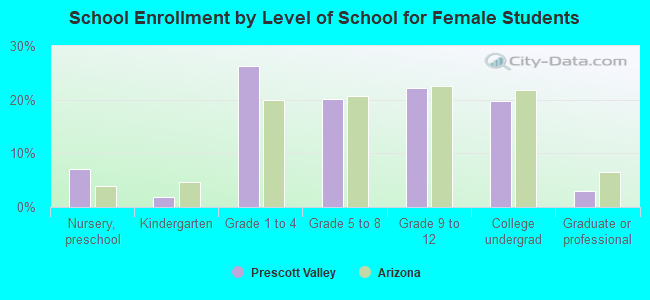
Private vs. public school enrollment:
| Here: | 9.2% |
| Arizona: | 10.4% |
| Here: | 6.3% |
| Arizona: | 8.8% |
| Here: | 26.1% |
| Arizona: | 13.1% |