Prattville, AL (Alabama) Houses and Residents
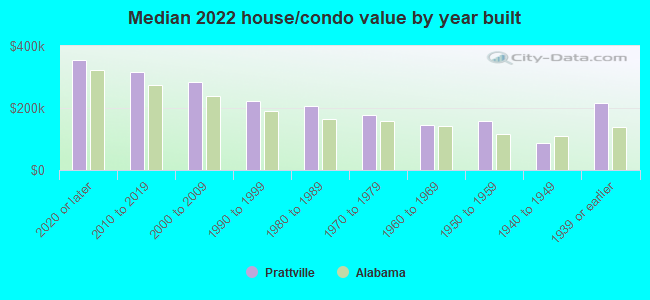
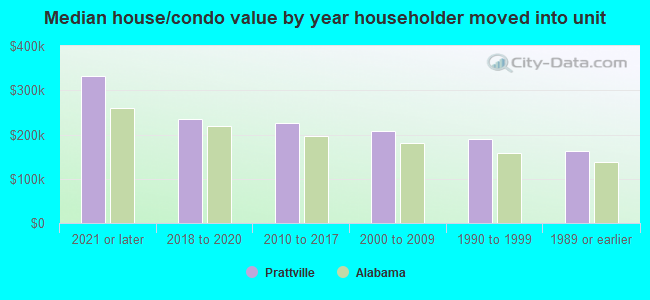
| Prattville: | $219,825 |
| Alabama: | $200,900 |
Mean price in 2022:
Detached houses: $251,252
Here: $251,252 State: $273,076 Townhouses or other attached units: $166,117
Here: $166,117 State: $222,857 Mobile homes: $30,057
Here: $30,057 State: $77,780
Total population: 35,317 (Urban population: 23,882 (all inside urban clusters), Rural population: 414 (all nonfarm))
Houses: 15,831 (14,812 occupied: 10,095 owner occupied, 5,073 renter occupied)
| % of renters here: | 33% |
| State: | 30% |
Housing density: 683 houses/condos per square mile
Median price asked for vacant for-sale houses and condos in 2022: $197,009.
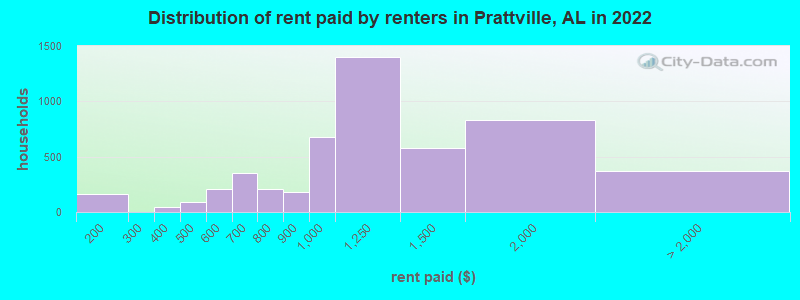
Median contract rent in 2022: $1,057 (lower quartile is $851, upper quartile is $1,314)
Median rent asked for vacant for-rent units in 2022: $1,777
Median gross rent in Prattville, AL in 2022: $1,244
Housing units in Prattville with a mortgage: 6,828 (599 second mortgage, 5 home equity loan, 312 both second mortgage and home equity loan)
Houses without a mortgage: 33
Median household income for houses/condos with a mortgage: $97,732
Median household income for apartments without a mortgage: $62,540
Median monthly housing costs: $1,122
Compare current foreclosures in Prattville, AL:
| Photo | Address | Area | Beds / Baths | Price | Details |
|---|---|---|---|---|---|

|
#1
A Longview Heights Rd
Prattville, AL 36067
|
1,010 sq. feet
|
1 baths 2 beds |
$169,900
|
show details |

|
#2
County Road 13
Prattville, AL 36067
|
1,590 sq. feet
|
2 baths 3 beds |
show details | |

|
#3
Upper Kingston Rd
Prattville, AL 36067
|
1,050 sq. feet
|
2 baths - beds |
show details | |

|
#4
County Road 59
Prattville, AL 36067
|
1,925 sq. feet
|
3 baths - beds |
show details | |

|
#5
Clifton Dr
Prattville, AL 36067
|
2,030 sq. feet
|
2 baths - beds |
show details | |

|
#6
Chancellor Ridge Rd
Prattville, AL 36066
|
2,576 sq. feet
|
2 baths - beds |
show details | |

|
#7
Julia Ct
Prattville, AL 36066
|
1,404 sq. feet
|
1 baths - beds |
show details | |

|
#8
Summer Ln
Prattville, AL 36066
|
1,723 sq. feet
|
2 baths - beds |
show details | |

|
#9
Mimosa Rd
Prattville, AL 36067
|
1,325 sq. feet
|
2 baths - beds |
show details | |

|
#10
Juniper Ct
Prattville, AL 36067
|
1,312 sq. feet
|
2 baths - beds |
show details |
| Photo | Address | Area | Beds / Baths | Price | Details |
|---|---|---|---|---|---|

|
#11
Spanish Oak Dr
Prattville, AL 36067
|
1,262 sq. feet
|
3 baths - beds |
show details | |

|
#12
Amanda Ln
Prattville, AL 36066
|
1,520 sq. feet
|
2 baths - beds |
show details | |

|
#13
Stonewall Dr
Prattville, AL 36067
|
1,920 sq. feet
|
1 baths - beds |
show details | |

|
#14
S Memorial Dr
Prattville, AL 36067
|
1,920 sq. feet
|
2 baths - beds |
show details | |

|
#15
Highway 14 W
Prattville, AL 36067
|
1,438 sq. feet
|
2 baths - beds |
show details | |

|
#16
Mt Airy Dr
Prattville, AL 36067
|
1,266 sq. feet
|
2 baths - beds |
show details | |

|
#17
Spencer St
Prattville, AL 36066
|
1,120 sq. feet
|
1 baths - beds |
show details | |

|
#18
Sheila Blvd
Prattville, AL 36066
|
1,346 sq. feet
|
2 baths - beds |
show details | |

|
#19
Kingswood Dr
Prattville, AL 36067
|
1,474 sq. feet
|
2 baths - beds |
show details | |

|
#20
Mountain Laurel Rd
Prattville, AL 36066
|
1,332 sq. feet
|
2 baths - beds |
show details |
| Photo | Address | Area | Beds / Baths | Price | Details |
|---|---|---|---|---|---|

|
#21
Cedar Ridge Loop
Prattville, AL 36067
|
1,447 sq. feet
|
2 baths - beds |
show details | |

|
#22
Bedford Ter
Prattville, AL 36066
|
2,288 sq. feet
|
2 baths - beds |
show details | |

|
#23
Magnolia Dr
Prattville, AL 36067
|
1,375 sq. feet
|
2 baths - beds |
show details | |

|
#24
Tara Dr
Prattville, AL 36066
|
1,992 sq. feet
|
2 baths - beds |
show details | |

|
#25
Murfee Dr
Prattville, AL 36066
|
1,122 sq. feet
|
2 baths - beds |
show details | |

|
#26
Sheila Blvd
Prattville, AL 36066
|
1,353 sq. feet
|
2 baths - beds |
show details | |

|
#27
West Dr
Prattville, AL 36067
|
1,356 sq. feet
|
2 baths - beds |
show details | |

|
#28
Chancellor Ridge Rd
Prattville, AL 36066
|
2,176 sq. feet
|
2 baths - beds |
show details | |

|
#29
Running Brook Dr
Prattville, AL 36066
|
2,516 sq. feet
|
3 baths - beds |
show details | |

|
#30
Huie St
Prattville, AL 36066
|
2,008 sq. feet
|
2 baths - beds |
show details |
| Photo | Address | Area | Beds / Baths | Price | Details |
|---|---|---|---|---|---|

|
#31
Mimosa Rd
Prattville, AL 36067
|
1,331 sq. feet
|
2 baths - beds |
show details | |

|
#32
Mt Airy Dr
Prattville, AL 36067
|
1,728 sq. feet
|
2 baths - beds |
show details | |

|
#33
Radburn Way
Prattville, AL 36066
|
1,144 sq. feet
|
2 baths - beds |
show details | |

|
#34
Wetumpka St
Prattville, AL 36067
|
2,146 sq. feet
|
2 baths - beds |
show details | |

|
#35
Tara Dr
Prattville, AL 36066
|
1,614 sq. feet
|
2 baths - beds |
show details | |

|
#36
Boxwood Rd
Prattville, AL 36067
|
2,121 sq. feet
|
2 baths - beds |
show details | |

|
#37
Gardenia Ct
Prattville, AL 36067
|
1,050 sq. feet
|
2 baths - beds |
show details | |

|
#38
County Road 19 N
Prattville, AL 36067
|
1,200 sq. feet
|
2 baths - beds |
show details | |

|
#39
Joyce St
Prattville, AL 36066
|
1,248 sq. feet
|
2 baths - beds |
show details | |

|
#40
County Road 107
Prattville, AL 36066
|
1,200 sq. feet
|
2 baths - beds |
show details |
| Photo | Address | Area | Beds / Baths | Price | Details |
|---|---|---|---|---|---|

|
#41
Mimosa Rd
Prattville, AL 36067
|
1,491 sq. feet
|
2 baths - beds |
show details | |

|
#42
County Road 46
Prattville, AL 36067
|
2,201 sq. feet
|
2 baths - beds |
show details | |

|
#43
Virginia St
Prattville, AL 36066
|
1,344 sq. feet
|
2 baths - beds |
show details | |

|
#44
Creely Dr
Prattville, AL 36066
|
3,184 sq. feet
|
4 baths - beds |
show details | |

|
#45
Ashton Oak Dr
Prattville, AL 36066
|
1,994 sq. feet
|
2 baths - beds |
show details | |

|
#46
Janice St
Prattville, AL 36066
|
1,403 sq. feet
|
2 baths - beds |
show details | |

|
#47
Pickett St
Prattville, AL 36067
|
1,218 sq. feet
|
2 baths - beds |
show details | |

|
#48
Jenny Dr
Prattville, AL 36066
|
2,676 sq. feet
|
2 baths - beds |
show details | |

|
#49
Lambert Ln
Prattville, AL 36067
|
1,913 sq. feet
|
2 baths - beds |
show details | |

|
Check over 1 million property listings on Foreclosure.com!
|
browse all offers | |||

Latest news about housing in Prattville, AL collected exclusively by city-data.com from local newspapers, TV, and radio stations

 | UPDATED: New and Upcoming Projects. (3757 replies) |
| Prattville area (2 replies) |
| Montgomery bad for crime (6 replies) |
| Selma? (16 replies) |
| Grad student at ASU looking to rent a home, suggestions on realtor (1 reply) |
| Young family looking at a potential move to Birmingham. Looking for input... (57 replies) |
Median year apartment built: 1998
Household type by relationship:
Households: 38,474- Male householders: 7,190 (1,404 living alone), Female householders: 7,485 (2,467 living alone)
7,817 spouses (7,745 opposite-sex spouses), 591 unmarried partners, (573 opposite-sex unmarried partners), 11,563 children (10,754 natural, 182 adopted, 625 stepchildren), 912 grandchildren, 553 brothers or sisters, 488 parents, 43 foster children, 588 other relatives, 772 non-relatives
- In group quarters: 469
Size of family households: 4,394 2-persons, 2,934 3-persons, 2,017 4-persons, 855 5-persons, 243 6-persons, 126 7-or-more-persons.
Size of nonfamily households: 4,003 1-person, 531 2-persons, 48 3-persons, 15 4-persons, 5 5-persons.
6,274 married couples with children.
1,645 single-parent households (316 men, 1,329 women).
94.0% of residents of Prattville speak English at home.
2.2% of residents speak Spanish at home (86% speak English very well, 12% speak English well, 2% speak English not well).
1.3% of residents speak other Indo-European language at home (54% speak English very well, 46% speak English well).
2.0% of residents speak Asian or Pacific Island language at home (69% speak English very well, 27% speak English well, 2% speak English not well, 2% don't speak English at all).
0.5% of residents speak other language at home (5% speak English very well, 28% speak English well, 67% speak English not well).
Foreign born population: 1,583 (4.1%)
(54.7% of them are naturalized citizens)
| Here: | 6.6 |
| State: | 6.5 |
| Here: | 5.2 |
| State: | 4.7 |
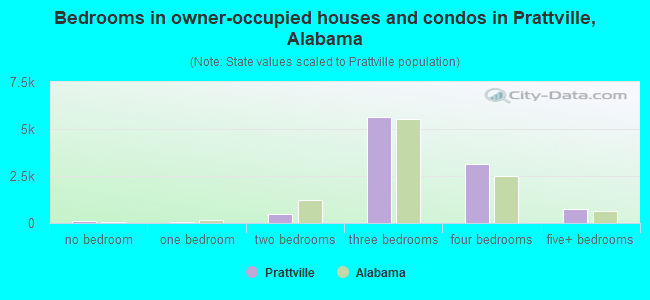
- Bedrooms in owner-occupied houses and condos in Prattville, Alabama
- 83no bedroom
- 571 bedroom
- 4752 bedrooms
- 5,6313 bedrooms
- 3,1164 bedrooms
- 7335+ bedrooms
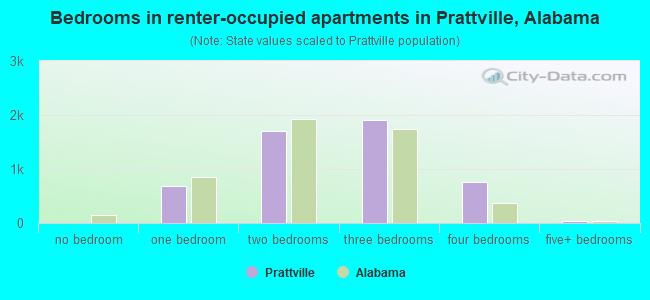
- Bedrooms in renter-occupied apartments in Prattville, Alabama
- 9no bedroom
- 6761 bedroom
- 1,6972 bedrooms
- 1,8993 bedrooms
- 7564 bedrooms
- 355+ bedrooms
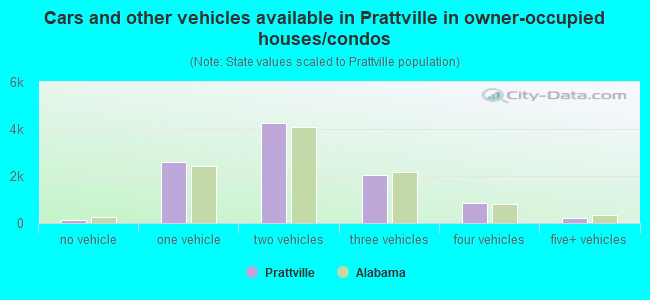
- Cars and other vehicles available in Prattville in owner-occupied houses/condos
- 147no vehicle
- 2,5971 vehicle
- 4,2612 vehicles
- 2,0473 vehicles
- 8324 vehicles
- 2115+ vehicles
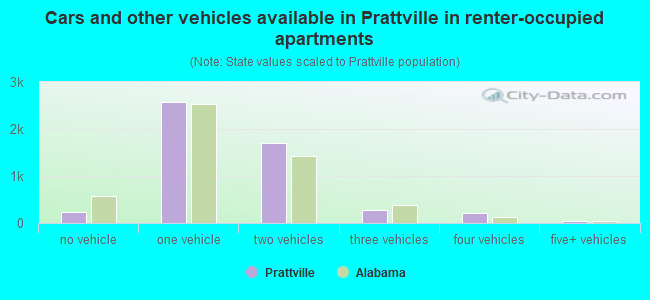
- Cars and other vehicles available in Prattville in renter-occupied apartments
- 237no vehicle
- 2,5791 vehicle
- 1,7082 vehicles
- 2873 vehicles
- 2144 vehicles
- 505+ vehicles
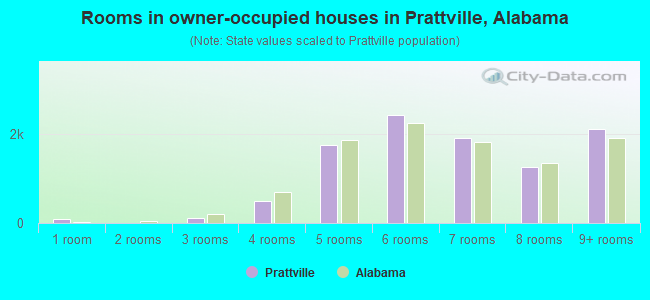
- Rooms in owner-occupied houses in Prattville, Alabama
- 831 room
- 02 rooms
- 1053 rooms
- 5014 rooms
- 1,7375 rooms
- 2,4186 rooms
- 1,8927 rooms
- 1,2508 rooms
- 2,1099+ rooms
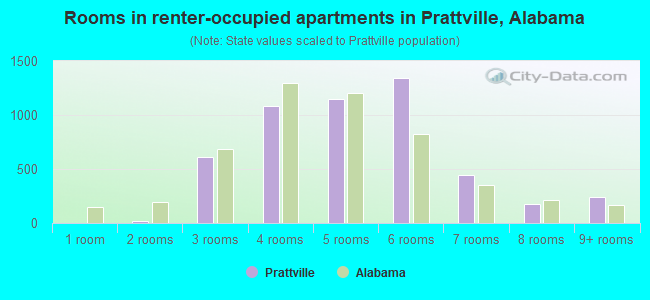
- Rooms in renter-occupied apartments in Prattville, Alabama
- 31 room
- 192 rooms
- 6083 rooms
- 1,0814 rooms
- 1,1485 rooms
- 1,3466 rooms
- 4497 rooms
- 1758 rooms
- 2459+ rooms
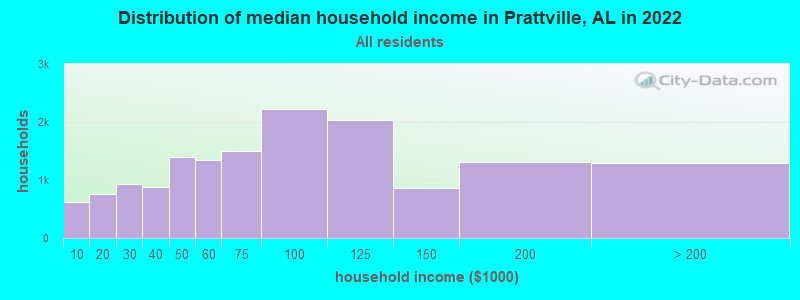
Prattville, AL household income distribution

- 623Less than $10,000
- 763$10,000 to $19,999
- 924$20,000 to $29,999
- 886$30,000 to $39,999
- 1,405$40,000 to $49,999
- 1,343$50,000 to $59,999
- 1,500$60,000 to $74,999
- 2,228$75,000 to $99,999
- 2,035$100,000 to $124,999
- 869$125,000 to $149,999
- 1,307$150,000 to $199,999
- 1,298$200,000 or more
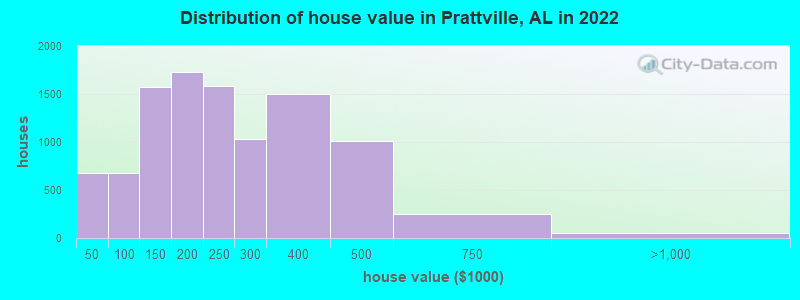
Home value of owner - occupied houses in 2022 in Prattville, AL
-
- 138Less than $10,000
- 141$10,000 to $14,999
- 79$15,000 to $19,999
- 116$20,000 to $24,999
- 22$25,000 to $29,999
- 34$30,000 to $34,999
- 52$35,000 to $39,999
- 87$40,000 to $49,999
- 113$50,000 to $59,999
- 90$60,000 to $69,999
- 32$70,000 to $79,999
- 168$80,000 to $89,999
- 183$90,000 to $99,999
- 764$100,000 to $124,999
- 804$125,000 to $149,999
- 754$150,000 to $174,999
- 975$175,000 to $199,999
- 1,584$200,000 to $249,999
- 1,028$250,000 to $299,999
- 1,501$300,000 to $399,999
- 1,009$400,000 to $499,999
- 247$500,000 to $749,999
- 28$750,000 to $999,999
- 4$1,000,000 to $1,499,999
- 17$2,000,000 or more
Rent paid by renters in 2022 in Prattville, AL
-
- 2Less than $100
- 41$100 to $149
- 123$150 to $199
- 4$300 to $349
- 38$350 to $399
- 28$400 to $449
- 58$450 to $499
- 92$500 to $549
- 115$550 to $599
- 317$600 to $649
- 36$650 to $699
- 156$700 to $749
- 53$750 to $799
- 184$800 to $899
- 674$900 to $999
- 1,403$1,000 to $1,249
- 579$1,250 to $1,499
- 830$1,500 to $1,999
- 63$2,000 to $2,499
- 12$2,500 to $2,999
- 24$3,000 to $3,499
- 266No cash rent
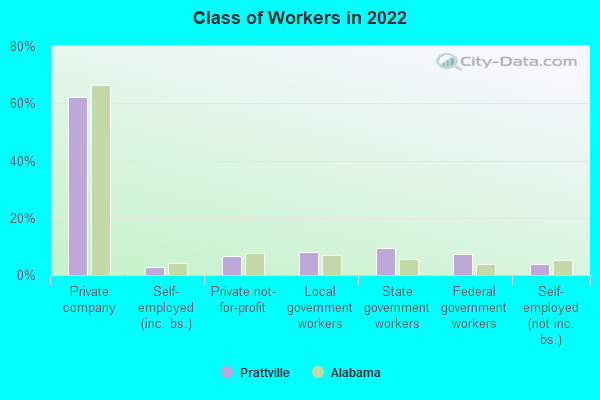
Percentage of workers working in this county: 37.9%
Number of people working at home: 1,632 (8.5% of all workers)
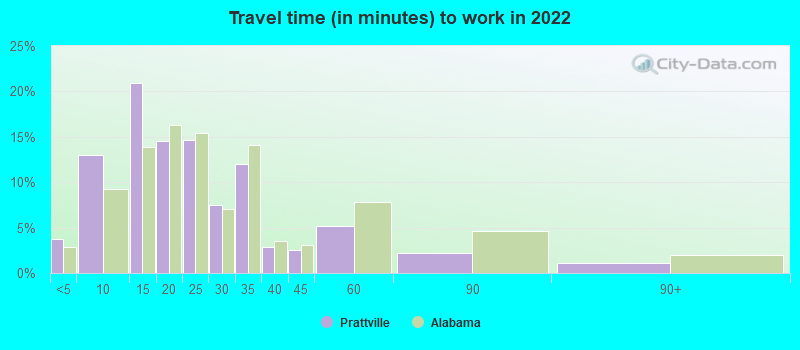
Travel time to work (commute)
- Less than 5 minutes: 575
- 5 to 9 minutes: 1,771
- 10 to 14 minutes: 2,597
- 15 to 19 minutes: 1,875
- 20 to 24 minutes: 3,550
- 25 to 29 minutes: 1,602
- 30 to 34 minutes: 3,250
- 35 to 39 minutes: 393
- 40 to 44 minutes: 485
- 45 to 59 minutes: 704
- 60 to 89 minutes: 525
- 90 or more minutes: 187
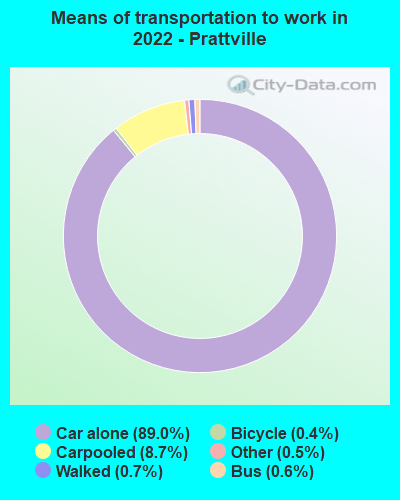
Means of transportation to work:
- Drove a car alone: 11,538 (79.2%)
- Carpooled: 1,144 (7.9%)
- Bus: 70 (0.5%)
- Taxi: 88 (0.6%)
- Bicycle: 46 (0.3%)
- Walked: 102 (0.7%)
- Worked at home: 1,632 (11.2%)
- Unemployment by race in 2022
- Unemployment rate for White non-Hispanic residents
- 0.9%Males
- 3.1%Females
- Unemployment rate for Black residents
- 2.2%Males
- 1.5%Females
- Unemployment rate for Asian residents
- 13.1%Females
- Unemployment rate for two or more race residents
- 1.0%Females
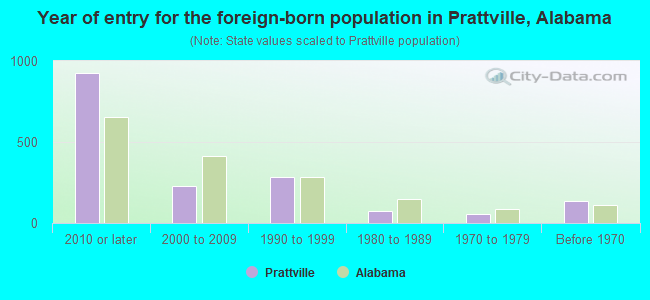
- Year of entry for the foreign-born population in Prattville, Alabama
- 9262010 or later
- 2262000 to 2009
- 2841990 to 1999
- 731980 to 1989
- 561970 to 1979
- 135Before 1970
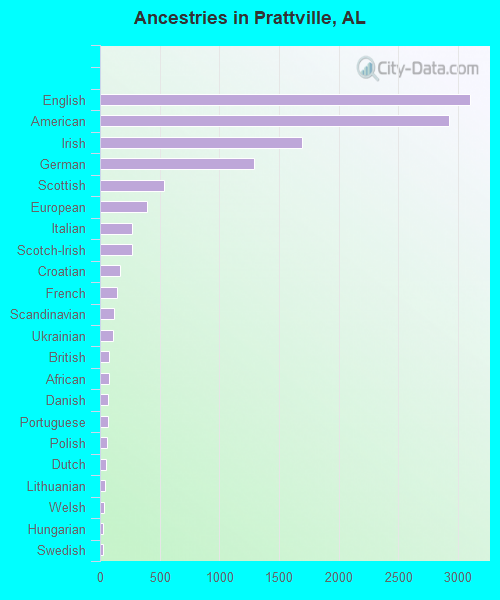
First ancestries reported:
- English: 3,105 (16.7%)
- American: 2,927 (15.8%)
- Irish: 1,692 (9.1%)
- German: 1,287 (6.9%)
- Scottish: 540 (2.9%)
- European: 398 (2.1%)
- Italian: 265 (1.4%)
- Scotch-Irish: 265 (1.4%)
- Croatian: 170 (0.9%)
- French: 145 (0.8%)
- Scandinavian: 117 (0.6%)
- Ukrainian: 108 (0.6%)
- British: 79 (0.4%)
- African: 78 (0.4%)
- Danish: 67 (0.4%)
- Portuguese: 63 (0.3%)
- Polish: 60 (0.3%)
- Dutch: 52 (0.3%)
- Lithuanian: 38 (0.2%)
- Welsh: 30 (0.2%)
- Hungarian: 29 (0.2%)
- Swedish: 29 (0.2%)
- Norwegian: 27 (0.1%)
- French Canadian: 26 (0.1%)
- Armenian: 14 (0.08%)
- Russian: 14 (0.08%)
- Czechoslovakian: 8 (0.04%)
- Czech: 7 (0.04%)
- Iranian: 6 (0.03%)
- Maltese: 1 (0.01%)
Most common places of birth for foreign-born residents (%):
| Prattville: | 11.8% (176) |
| Alabama: | 2.9% (5,154) |
| Prattville: | 10.8% (161) |
| Alabama: | 0.2% (271) |
| Prattville: | 10.0% (149) |
| Alabama: | 0.1% (154) |
| Prattville: | 9.5% (142) |
| Alabama: | 26.4% (46,832) |
| Prattville: | 9.2% (138) |
| Alabama: | 5.2% (9,293) |
| Prattville: | 6.7% (100) |
| Alabama: | 0.6% (1,077) |
| Prattville: | 5.9% (88) |
| Alabama: | 1.9% (3,447) |
| Prattville: | 5.7% (86) |
| Alabama: | 4.6% (8,075) |
| Prattville: | 5.5% (82) |
| Alabama: | 5.5% (9,672) |
| Prattville: | 3.7% (56) |
| Alabama: | 1.3% (2,391) |
| Prattville: | 3.6% (54) |
| Alabama: | 0.5% (845) |
| Prattville: | 2.7% (41) |
| Alabama: | 1.1% (1,867) |
| Prattville: | 2.6% (39) |
| Alabama: | 0.1% (122) |
| Prattville: | 2.3% (35) |
| Alabama: | 3.9% (6,831) |
| Prattville: | 1.6% (24) |
| Alabama: | 0.7% (1,231) |
| Prattville: | 1.5% (23) |
| Alabama: | 0.7% (1,277) |
| Prattville: | 1.5% (23) |
| Alabama: | 0.3% (477) |
Place of birth for U.S.-born residents:
- This state: 21,555
- Other state: 14,381
- Northeast: 1,508
- Midwest: 2,688
- South: 8,277
- West: 1,907
86.8% of Prattville residents lived in the same house 1 years ago.
Out of people who lived in different houses, 23.6% lived in this county.
Out of people who lived in different counties, 54.3% lived in Alabama.
| Prattville: | 86.8% |
| State average: | 87.6% |
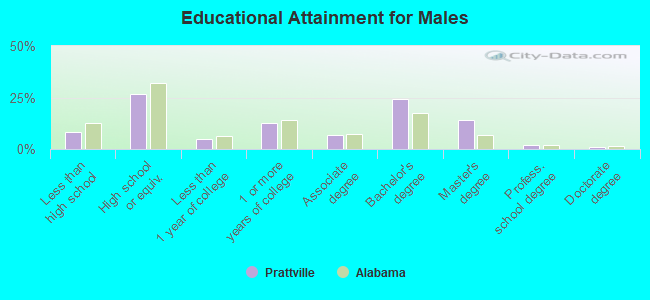
Education attainment for males 25 years and older:
- No schooling: 151
- Nursery to 4th grade: 10
- 5th and 6th grade: 33
- 7th and 8th grade: 45
- 9th grade: 139
- 10th grade: 338
- 11th grade: 88
- 12th grade, no diploma: 226
- High school graduate (or equivalency): 3,264
- Less than 1 year of college: 583
- Some college more than 1 year, no degree: 1,528
- Associate degree: 831
- Bachelor's degree: 2,981
- Master's degree: 1,743
- Professional school degree: 241
- Doctorate degree: 94
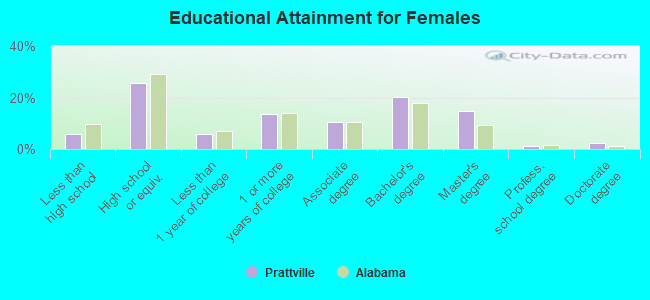
Education attainment for females 25 years and older:
- No schooling: 40
- Nursery to 4th grade: 10
- 5th and 6th grade: 26
- 7th and 8th grade: 58
- 9th grade: 228
- 10th grade: 159
- 11th grade: 104
- 12th grade, no diploma: 214
- High school graduate (or equivalency): 3,579
- Less than 1 year of college: 843
- Some college more than 1 year, no degree: 1,924
- Associate degree: 1,488
- Bachelor's degree: 2,816
- Master's degree: 2,061
- Professional school degree: 165
- Doctorate degree: 316
Housing units in structures:
- One, detached: 12,401
- One, attached: 202
- Two: 145
- 3 or 4: 382
- 5 to 9: 628
- 10 to 19: 682
- 20 to 49: 250
- 50 or more: 369
- Mobile homes: 768
Median worth of mobile homes: $24,689
Housing units lacking complete kitchen facilities in 2022: 2.1%
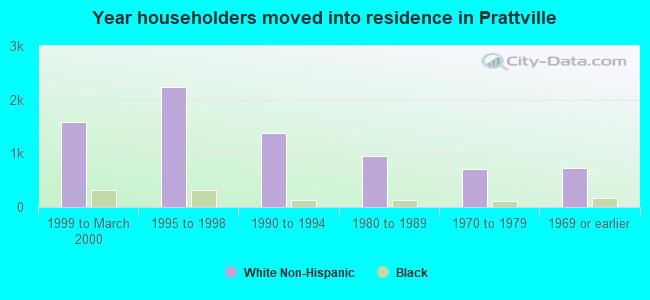
House/condo owner moved in on average 8 years ago
Renter moved in on average 2 years ago
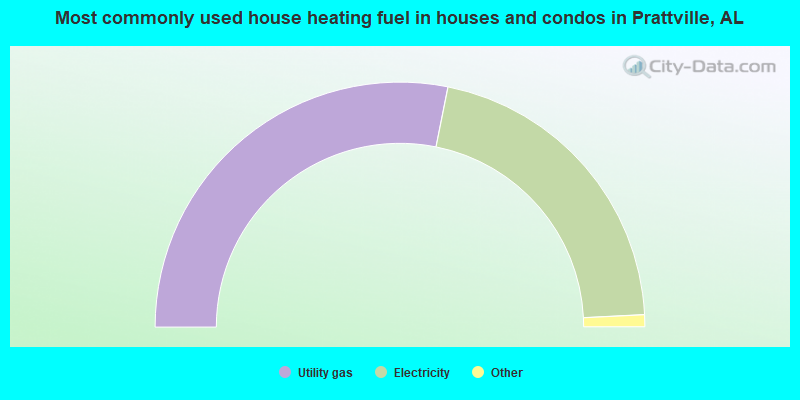
- 56.3%Utility gas
- 42.1%Electricity
- 1.4%Bottled, tank, or LP gas
- 0.1%Wood
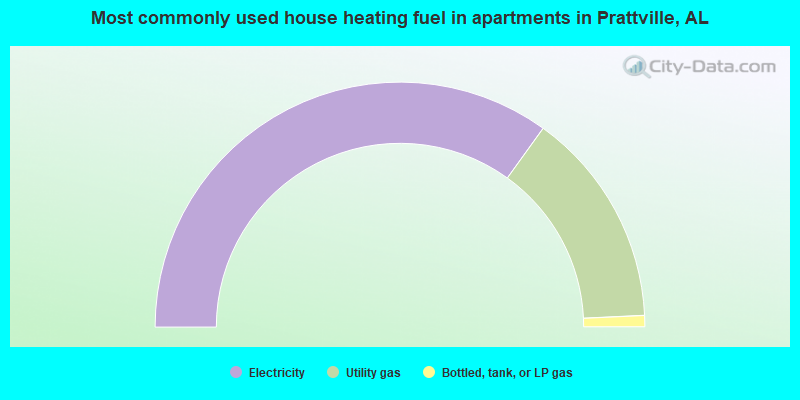
- 69.9%Electricity
- 28.6%Utility gas
- 1.5%Bottled, tank, or LP gas
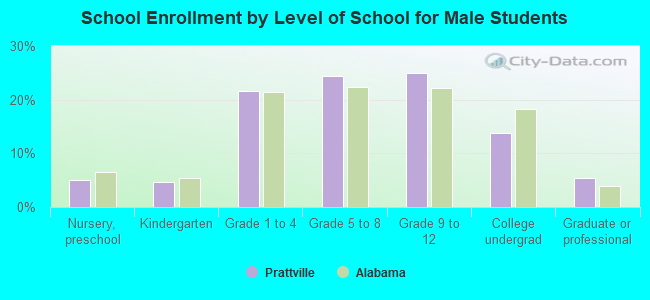
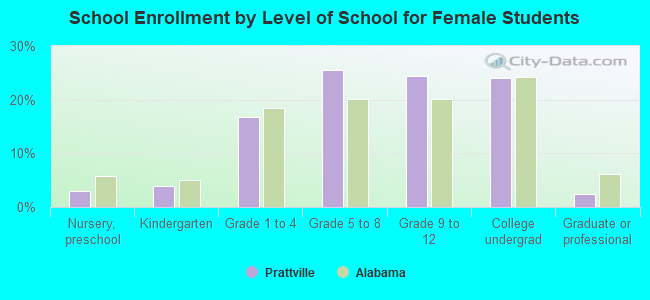
Private vs. public school enrollment:
| Here: | 25.3% |
| Alabama: | 14.7% |
| Here: | 23.7% |
| Alabama: | 16.3% |
| Here: | 16.7% |
| Alabama: | 14.6% |