Potomac, IL (Illinois) Houses and Residents
| Potomac: | $87,110 |
| Illinois: | $251,600 |
Mean price in 2022:
Detached houses: $93,888
Here: $93,888 State: $310,164
Total population: 729 (Urban population: 0, Rural population: 678 (all nonfarm))
Houses: 295 (276 occupied: 230 owner occupied, 56 renter occupied)
| % of renters here: | 20% |
| State: | 33% |
Housing density: 610 houses/condos per square mile
Median price asked for vacant for-sale houses and condos in 2022: $76,033.
Median contract rent in 2022: $502 (lower quartile is $507, upper quartile is $539)
Median rent asked for vacant for-rent units in 2022: $294
Median gross rent in Potomac, IL in 2022: $689
Housing units in Potomac with a mortgage: 121 (0 second mortgage, 0 home equity loan, 0 both second mortgage and home equity loan)
Houses without a mortgage: 0
Median household income for houses/condos with a mortgage: $77,256
Median household income for apartments without a mortgage: $49,624
Median monthly housing costs: $720
Compare current foreclosures near Potomac, IL:
| Photo | Address | Area | Beds / Baths | Price | Details |
|---|---|---|---|---|---|

|
#1
Oak St
Danville, IL 61832
|
1,200 sq. feet
|
1 baths 3 beds |
$139,000
|
show details |

|
#2
S Main St
Gifford, IL 61847
|
2,200 sq. feet
|
2 baths 4 beds |
$165,000
|
show details |

|
#3
N Franklin St
Danville, IL 61832
|
900 sq. feet
|
1 baths 2 beds |
$26,900
|
show details |

|
#4
E Washington St
Hoopeston, IL 60942
|
1,968 sq. feet
|
2 baths 3 beds |
show details | |

|
#5
1/2 W 13th St
Tilton, IL 61833
|
730 sq. feet
|
1 baths 2 beds |
show details | |

|
#6
E 0 North Rd
Hoopeston, IL 60942
|
1,917 sq. feet
|
1 baths 4 beds |
show details | |

|
#7
E Thompson Ave
Hoopeston, IL 60942
|
1,476 sq. feet
|
2 baths 2 beds |
show details | |

|
#8
E Fairchild St
Danville, IL 61832
|
- sq. feet
|
- baths - beds |
$12,900
|
show details |

|
#9
N Franklin St
Danville, IL 61832
|
- sq. feet
|
2 baths 2 beds |
show details | |

|
#10
Kingsdale Ave
Tilton, IL 61833
|
969 sq. feet
|
1 baths 2 beds |
show details |
| Photo | Address | Area | Beds / Baths | Price | Details |
|---|---|---|---|---|---|

|
#11
N Walnut St
Danville, IL 61832
|
- sq. feet
|
- baths - beds |
show details | |

|
#12
Oak St
Danville, IL 61832
|
- sq. feet
|
- baths - beds |
show details | |

|
#13
W Voorhees St
Danville, IL 61832
|
- sq. feet
|
- baths - beds |
show details | |

|
#14
E 2750 North Rd
Danville, IL 61834
|
- sq. feet
|
- baths - beds |
show details | |

|
#15
County Road 1900 N
Saint Joseph, IL 61873
|
- sq. feet
|
- baths - beds |
show details | |

|
#16
Oak St # 9
Danville, IL 61832
|
- sq. feet
|
- baths - beds |
show details | |

|
#17
W Center St
Catlin, IL 61817
|
- sq. feet
|
- baths - beds |
show details | |

|
#18
Warrington Ave
Danville, IL 61832
|
- sq. feet
|
- baths - beds |
show details | |

|
#19
Griggs St
Danville, IL 61832
|
- sq. feet
|
- baths - beds |
show details | |

|
#20
W Lincoln Ave
Ogden, IL 61859
|
- sq. feet
|
- baths - beds |
show details |
| Photo | Address | Area | Beds / Baths | Price | Details |
|---|---|---|---|---|---|

|
#21
Johnson St
Danville, IL 61832
|
- sq. feet
|
- baths - beds |
show details | |

|
#22
E Lincoln Ave
Ogden, IL 61859
|
- sq. feet
|
- baths - beds |
show details | |

|
#23
Shasta Dr
Danville, IL 61832
|
- sq. feet
|
- baths - beds |
show details | |

|
#24
E 5th St
Tilton, IL 61833
|
- sq. feet
|
- baths - beds |
show details | |

|
#25
King St
Danville, IL 61832
|
- sq. feet
|
- baths - beds |
show details | |

|
#26
Westwood Dr
Catlin, IL 61817
|
- sq. feet
|
- baths - beds |
show details | |

|
#27
Meadowlane Dr
Catlin, IL 61817
|
- sq. feet
|
- baths - beds |
show details | |

|
#28
Willow St
Ogden, IL 61859
|
- sq. feet
|
- baths - beds |
show details | |

|
#29
Sunset Rdg
Danville, IL 61832
|
- sq. feet
|
- baths - beds |
show details | |

|
#30
E 5th Ave
Rankin, IL 60960
|
- sq. feet
|
- baths - beds |
show details |
| Photo | Address | Area | Beds / Baths | Price | Details |
|---|---|---|---|---|---|

|
#31
S 4th St
Hoopeston, IL 60942
|
- sq. feet
|
- baths - beds |
show details | |

|
#32
Locust St
Alvin, IL 61811
|
- sq. feet
|
- baths - beds |
show details | |

|
#33
N Vermilion St Apt 405
Danville, IL 61832
|
- sq. feet
|
- baths - beds |
show details | |

|
#34
E Washington St
Hoopeston, IL 60942
|
- sq. feet
|
- baths - beds |
show details | |

|
#35
W 4th Ave
Rankin, IL 60960
|
- sq. feet
|
- baths - beds |
show details | |

|
#36
W Penn St
Hoopeston, IL 60942
|
- sq. feet
|
- baths - beds |
show details | |

|
#37
Shady Ln
Danville, IL 61832
|
- sq. feet
|
- baths - beds |
show details | |

|
#38
E 1425 North Rd
Fairmount, IL 61841
|
- sq. feet
|
- baths - beds |
show details | |

|
#39
Redbud Ln
Danville, IL 61832
|
- sq. feet
|
- baths - beds |
show details | |

|
#40
Country Club Dr
Danville, IL 61832
|
- sq. feet
|
- baths - beds |
show details |
| Photo | Address | Area | Beds / Baths | Price | Details |
|---|---|---|---|---|---|

|
#41
S Crawford St
Danville, IL 61832
|
- sq. feet
|
- baths - beds |
show details | |

|
#42
S H St
Tilton, IL 61833
|
- sq. feet
|
- baths - beds |
show details | |

|
#43
E 1815 North Rd
Oakwood, IL 61858
|
- sq. feet
|
- baths - beds |
show details | |

|
#44
Judson Ave
Hoopeston, IL 60942
|
- sq. feet
|
- baths - beds |
show details | |

|
#45
N California Ave
Danville, IL 61832
|
- sq. feet
|
- baths - beds |
show details | |

|
#46
County Road 1850 N
Saint Joseph, IL 61873
|
- sq. feet
|
- baths - beds |
show details | |

|
#47
Crestwood St
Catlin, IL 61817
|
- sq. feet
|
- baths - beds |
show details | |

|
#48
Central Ave
Tilton, IL 61833
|
- sq. feet
|
- baths - beds |
show details | |

|
#49
Vine St
Danville, IL 61834
|
- sq. feet
|
- baths - beds |
show details | |

|
Check over 1 million property listings on Foreclosure.com!
|
browse all offers | |||

Latest news about housing in Potomac, IL collected exclusively by city-data.com from local newspapers, TV, and radio stations

 | Is Chicago a good city for broke young people? (62 replies) |
| Chicago River Tour - wttw (14 replies) |
| Inexpensive but safe: I'm looking at these neighborhoods (44 replies) |
| A very interesting article about Evanston and transit oriented suburbs (5 replies) |
| Shooting in Wicker Park last weekend (87 replies) |
| Humboldt Park/West Ukrainian Village (61 replies) |

Median year apartment built: 1980
Household type by relationship:
Households: 801- Male householders: 151 (51 living alone), Female householders: 120 (31 living alone)
122 spouses (122 opposite-sex spouses), 21 unmarried partners, (21 opposite-sex unmarried partners), 332 children (224 natural, 78 adopted, 30 stepchildren), 11 grandchildren, 5 brothers or sisters, 0 parents, 3 foster children, 20 other relatives, 11 non-relatives
Size of family households: 73 2-persons, 61 3-persons, 19 4-persons, 12 5-persons, 12 6-persons, 5 7-or-more-persons.
Size of nonfamily households: 99 1-person.
114 married couples with children.
171 single-parent households (28 men, 143 women).
98.8% of residents of Potomac speak English at home.
0.3% of residents speak Asian or Pacific Island language at home (100% speak English well).
Foreign born population: 35 (4.4%)
(128.6% of them are naturalized citizens)
| Here: | 6.3 |
| State: | 6.4 |
| Here: | 4.7 |
| State: | 4.1 |

- Bedrooms in owner-occupied houses and condos in Potomac, Illinois
- 0no bedroom
- 21 bedroom
- 602 bedrooms
- 1133 bedrooms
- 454 bedrooms
- 115+ bedrooms

- Bedrooms in renter-occupied apartments in Potomac, Illinois
- 0no bedroom
- 81 bedroom
- 332 bedrooms
- 133 bedrooms
- 14 bedrooms
- 15+ bedrooms

- Cars and other vehicles available in Potomac in owner-occupied houses/condos
- 5no vehicle
- 501 vehicle
- 1072 vehicles
- 533 vehicles
- 134 vehicles
- 35+ vehicles

- Cars and other vehicles available in Potomac in renter-occupied apartments
- 0no vehicle
- 281 vehicle
- 272 vehicles
- 23 vehicles
- 04 vehicles
- 05+ vehicles

- Rooms in owner-occupied houses in Potomac, Illinois
- 01 room
- 02 rooms
- 03 rooms
- 134 rooms
- 545 rooms
- 706 rooms
- 527 rooms
- 168 rooms
- 269+ rooms

- Rooms in renter-occupied apartments in Potomac, Illinois
- 01 room
- 02 rooms
- 103 rooms
- 114 rooms
- 245 rooms
- 06 rooms
- 77 rooms
- 08 rooms
- 49+ rooms


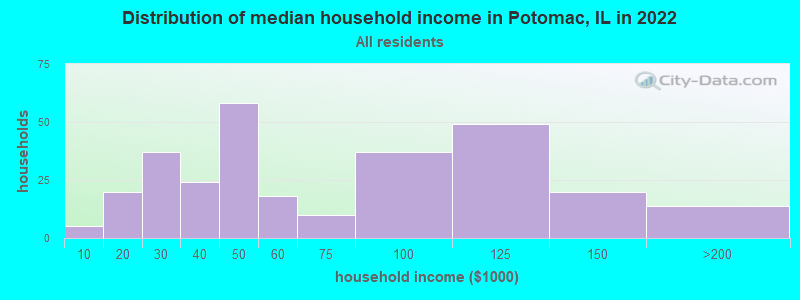
Potomac, IL household income distribution

- 5Less than $10,000
- 20$10,000 to $19,999
- 37$20,000 to $29,999
- 24$30,000 to $39,999
- 58$40,000 to $49,999
- 18$50,000 to $59,999
- 10$60,000 to $74,999
- 37$75,000 to $99,999
- 49$100,000 to $124,999
- 20$125,000 to $149,999
- 13$150,000 to $199,999
- 1$200,000 or more
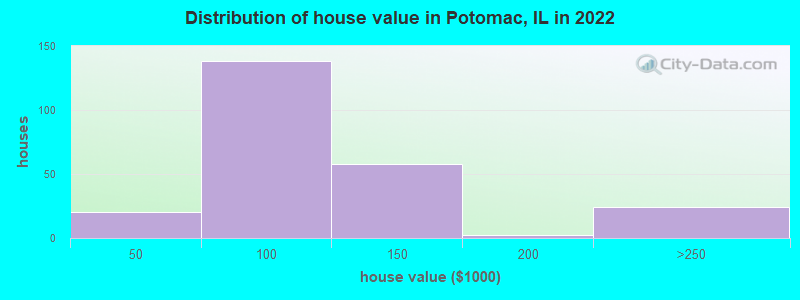
Home value of owner - occupied houses in 2022 in Potomac, IL
-
- 6$20,000 to $24,999
- 2$30,000 to $34,999
- 1$35,000 to $39,999
- 9$40,000 to $49,999
- 9$50,000 to $59,999
- 23$60,000 to $69,999
- 63$70,000 to $79,999
- 21$80,000 to $89,999
- 11$90,000 to $99,999
- 16$100,000 to $124,999
- 41$125,000 to $149,999
- 2$150,000 to $174,999
- 24$200,000 to $249,999
Rent paid by renters in 2022 in Potomac, IL
-
- 9$400 to $449
- 13$450 to $499
- 36$500 to $549
- 20$550 to $599
- 7No cash rent


Percentage of workers working in this county: 54.5%
Number of people working at home: 11 (3.4% of all workers)
Travel time to work (commute)
- Less than 5 minutes: 21
- 5 to 9 minutes: 8
- 10 to 14 minutes: 21
- 15 to 19 minutes: 21
- 20 to 24 minutes: 41
- 25 to 29 minutes: 24
- 30 to 34 minutes: 61
- 35 to 39 minutes: 13
- 40 to 44 minutes: 13
- 45 to 59 minutes: 49
- 60 to 89 minutes: 27
- 90 or more minutes: 4
Means of transportation to work:
- Drove a car alone: 255 (78.5%)
- Carpooled: 41 (12.6%)
- Walked: 10 (3.1%)
- Other means: 7 (2.2%)
- Worked at home: 12 (3.7%)

- Unemployment by race in 2022
- Unemployment rate for White non-Hispanic residents
- 4.8%Males
- 1.3%Females
- Unemployment rate for Hispanic or Latino residents
- 89.9%Males

First ancestries reported:
- American: 72 (16.8%)
- German: 47 (11.0%)
- Irish: 44 (10.3%)
- Italian: 16 (3.7%)
- European: 11 (2.6%)
- English: 9 (2.1%)
- Scotch-Irish: 5 (1.2%)
- French Canadian: 1 (0.2%)
- Swedish: 1 (0.2%)
Most common places of birth for foreign-born residents (%):
| Potomac: | 95.5% (42) |
| Illinois: | 4.1% (74,364) |
Place of birth for U.S.-born residents:
- This state: 708
- Other state: 53
- Northeast: 3
- Midwest: 17
- South: 31
- West: 0
94.3% of Potomac residents lived in the same house 1 years ago.
Out of people who lived in different houses, 39.5% lived in this county.
Out of people who lived in different counties, 69.2% lived in Illinois.
| Potomac: | 94.3% |
| State average: | 88.3% |
Education attainment for males 25 years and older:
- No schooling: 0
- Nursery to 4th grade: 0
- 5th and 6th grade: 7
- 7th and 8th grade: 0
- 9th grade: 0
- 10th grade: 12
- 11th grade: 3
- 12th grade, no diploma: 3
- High school graduate (or equivalency): 126
- Less than 1 year of college: 6
- Some college more than 1 year, no degree: 11
- Associate degree: 35
- Bachelor's degree: 19
- Master's degree: 4
- Professional school degree: 0
- Doctorate degree: 0

Education attainment for females 25 years and older:
- No schooling: 0
- Nursery to 4th grade: 0
- 5th and 6th grade: 0
- 7th and 8th grade: 0
- 9th grade: 2
- 10th grade: 13
- 11th grade: 0
- 12th grade, no diploma: 1
- High school graduate (or equivalency): 70
- Less than 1 year of college: 22
- Some college more than 1 year, no degree: 17
- Associate degree: 54
- Bachelor's degree: 30
- Master's degree: 13
- Professional school degree: 0
- Doctorate degree: 0


Housing units in structures:
- One, detached: 263
- One, attached: 1
- Two: 5
- 3 or 4: 5
- 5 to 9: 6
- Mobile homes: 10
House/condo owner moved in on average 10 years ago
Renter moved in on average 5 years ago

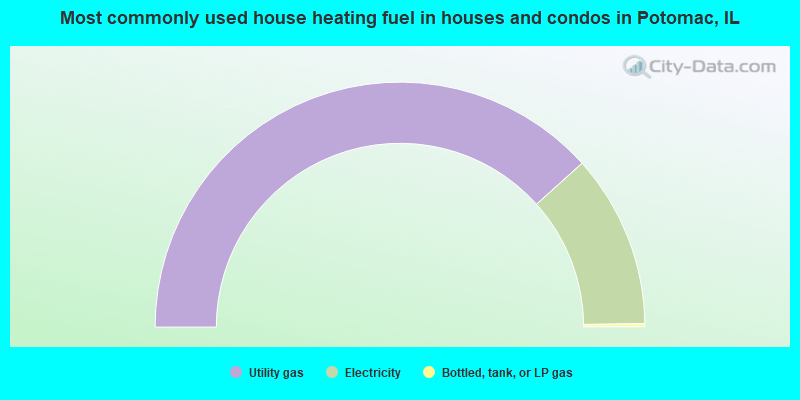
- 76.7%Utility gas
- 22.9%Electricity
- 0.4%Bottled, tank, or LP gas
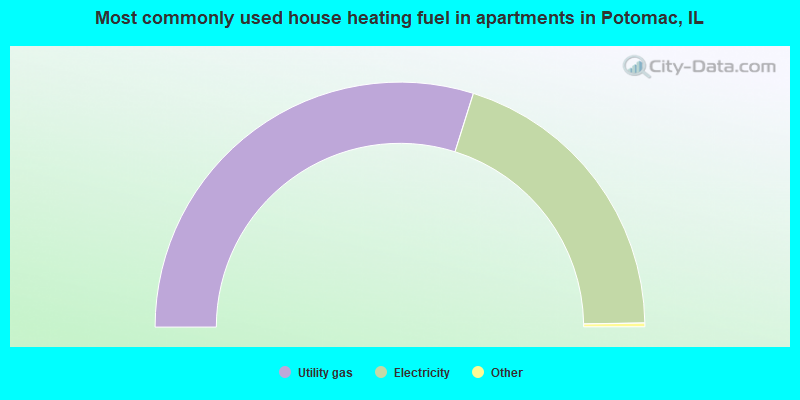
- 60.0%Utility gas
- 40.0%Electricity
Private vs. public school enrollment:
| Here: | 0.0% |
| Illinois: | 13.3% |
| Here: | 0.0% |
| Illinois: | 9.9% |
| Here: | 55.6% |
| Illinois: | 27.4% |


