Jump to a detailed profile or search site with Google Custom Search

Portola Valley, CA (California) Houses and Residents

Estimated median house or condo value in 2022: over $2,201,486 (it was over $1,000,000 in 2000)
Portola Valley:

over $2,201,486
California:

$715,900
Lower value quartile - upper value quartile: $2,079,290 - Over $2,000,001

Total population: 4,570 (Urban population: 3,641, Rural population: 981 (all nonfarm))

Houses: 1,827 (1,710 occupied: 1,373 owner occupied, 304 renter occupied)

% of renters here:

18%
State:

44%

Housing density: 200 houses/condos per square mile

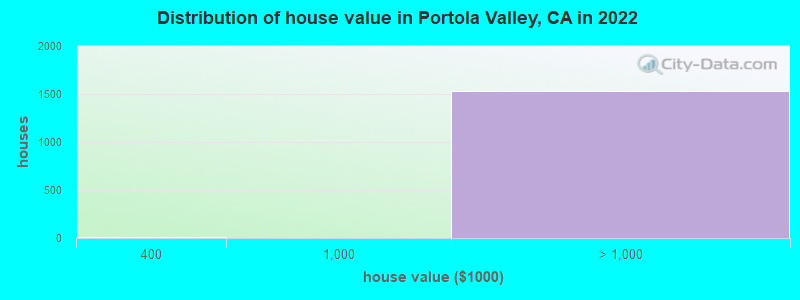
Median price asked for vacant for-sale houses and condos in 2022 in this county: $912,464.

Median contract rent in 2022: over $2,000


Median rent asked for vacant for-rent units in 2022: $3,385


Median gross rent in Portola Valley, CA in 2022: over $2,000

Housing units in Portola Valley with a mortgage: 680 (170 second mortgage, 0 home equity loan, 162 both second mortgage and home equity loan)
Houses without a mortgage: 50

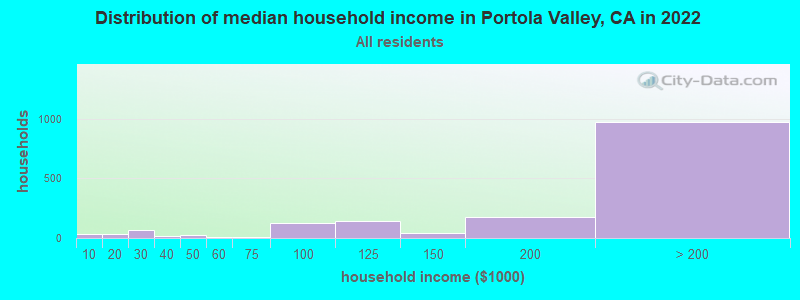
Median household income for houses/condos with a mortgage: $258,196

Median household income for apartments without a mortgage: $223,665

Median monthly housing costs: $3,819

Compare current foreclosures near Portola Valley, CA:

Check out more offers near Portola Valley, CA.
Powered by Foreclosure.com

Settings
X
Data:
Loading data...
Based on 2000-2022 data
Loading data...

123
Hide US histogram

Portola Valley, California Age and Sex of Residents
Median year house/condo built: 1974

Median year apartment built: 1962

Household type by relationship:

Households: 4,250
  • Male householders: 786 (116 living alone), Female householders: 848 (326 living alone)
  • 1,109 spouses (1,109 opposite-sex spouses), 50 unmarried partners, (39 opposite-sex unmarried partners), 966 children (951 natural, 15 adopted, 0 stepchildren), 92 grandchildren, 0 brothers or sisters, 50 parents, 0 foster children, 10 other relatives, 289 non-relatives
  • In group quarters: 45

Size of family households: 584 2-persons, 200 3-persons, 220 4-persons, 79 5-persons, 23 6-persons, 6 7-or-more-persons.

Size of nonfamily households: 501 1-person, 58 2-persons.

662 married couples with children.
0 single-parent households (0 men, 0 women).

88.4% of residents of Portola Valley speak English at home.
1.2% of residents speak Spanish at home (50% speak English very well, 24% speak English well, 26% don't speak English at all).
9.0% of residents speak other Indo-European language at home (94% speak English very well, 6% speak English well).
4.6% of residents speak Asian or Pacific Island language at home (90% speak English very well, 5% speak English well, 5% speak English not well).

Foreign born population: 572 (13.5%)
(55.1% of them are naturalized citizens)

Median number of rooms in houses and condos:
Here:

8.1
State:

6.0

Median number of rooms in apartments
Here:

2.8
State:

3.9

Owner-occupied Renter-occupied
Bedrooms in owner-occupied houses and condos in Portola Valley, California
  • Bedrooms in owner-occupied houses and condos in Portola Valley, California
  • 0no bedroom
  • 111 bedroom
  • 1362 bedrooms
  • 4833 bedrooms
  • 4854 bedrooms
  • 2595+ bedrooms
Bedrooms in renter-occupied apartments in Portola Valley, California
  • Bedrooms in renter-occupied apartments in Portola Valley, California
  • 15no bedroom
  • 1561 bedroom
  • 822 bedrooms
  • 443 bedrooms
  • 84 bedrooms
  • 05+ bedrooms
Owner-occupied Renter-occupied
Cars and other vehicles available in Portola Valley in owner-occupied houses/condos
  • Cars and other vehicles available in Portola Valley in owner-occupied houses/condos
  • 76no vehicle
  • 1531 vehicle
  • 4942 vehicles
  • 3073 vehicles
  • 2114 vehicles
  • 1325+ vehicles
Cars and other vehicles available in Portola Valley in renter-occupied apartments
  • Cars and other vehicles available in Portola Valley in renter-occupied apartments
  • 39no vehicle
  • 1861 vehicle
  • 452 vehicles
  • 353 vehicles
  • 04 vehicles
  • 05+ vehicles
Owner-occupied Renter-occupied
Rooms in owner-occupied houses in Portola Valley, California
  • Rooms in owner-occupied houses in Portola Valley, California
  • 01 room
  • 112 rooms
  • 403 rooms
  • 404 rooms
  • 855 rooms
  • 1616 rooms
  • 2497 rooms
  • 1988 rooms
  • 5909+ rooms
Rooms in renter-occupied apartments in Portola Valley, California
  • Rooms in renter-occupied apartments in Portola Valley, California
  • 151 room
  • 662 rooms
  • 1583 rooms
  • 144 rooms
  • 135 rooms
  • 06 rooms
  • 317 rooms
  • 88 rooms
  • 09+ rooms
Year house built
Median 2022 house/condo value by year built
Median house/condo value by year householder moved into unit
Breakdown of mean house values by ages of householders
Owners and renters by unit type in Portola Valley, CA
  • Portola Valley, CA household income distribution

  • Distribution of median household income in Portola Valley, CA in 2022
  • 36Less than $10,000
  • 32$10,000 to $19,999
  • 71$20,000 to $29,999
  • 18$30,000 to $39,999
  • 25$40,000 to $49,999
  • 11$50,000 to $59,999
  • 12$60,000 to $74,999
  • 128$75,000 to $99,999
  • 145$100,000 to $124,999
  • 40$125,000 to $149,999
  • 173$150,000 to $199,999
  • 972$200,000 or more
  • Home value of owner - occupied houses in 2022 in Portola Valley, CA

  • Distribution of house value in Portola Valley, CA in 2022
  • 9$200,000 to $249,999
  • 13$300,000 to $399,999
  • 55$1,000,000 to $1,499,999
  • 86$1,500,000 to $1,999,999
  • 1,395$2,000,000 or more
  • Rent paid by renters in 2022 in Portola Valley, CA

  • Distribution of rent paid by renters in Portola Valley, CA in 2022
  • 25$750 to $799
  • 25$1,000 to $1,249
  • 13$1,250 to $1,499
  • 13$2,500 to $2,999
  • 21$3,000 to $3,499
  • 132$3,500 or more
  • 69No cash rent
Time Leaving Home To Go To Work in 2022

Percentage of workers working in this county: 72.0%
Number of people working at home: 977 (68.6% of all workers)

Travel time (in minutes) to work in 2022

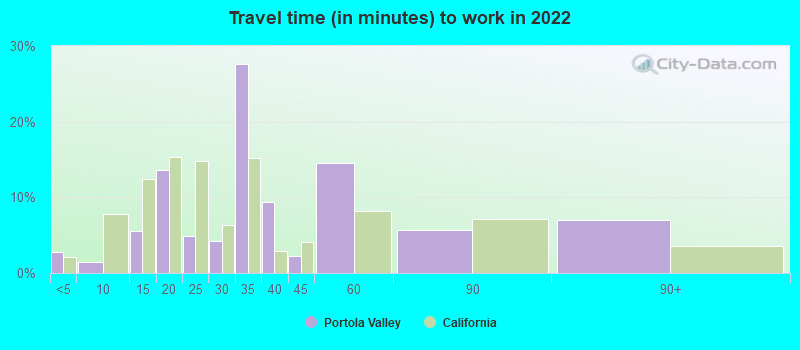
Travel time to work (commute)

  • Less than 5 minutes: 29
  • 5 to 9 minutes: 0
  • 10 to 14 minutes: 74
  • 15 to 19 minutes: 78
  • 20 to 24 minutes: 175
  • 25 to 29 minutes: 44
  • 30 to 34 minutes: 94
  • 35 to 39 minutes: 156
  • 40 to 44 minutes: 8
  • 45 to 59 minutes: 0
  • 60 to 89 minutes: 16
  • 90 or more minutes: 13
Means of transportation to work in 2022 - Portola Valley

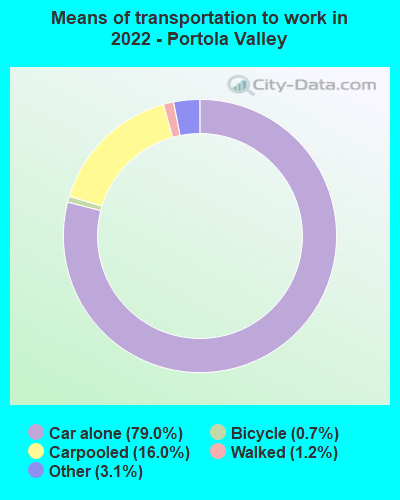
Means of transportation to work:

  • Drove a car alone: 1,023 (47.6%)
  • Carpooled: 226 (10.5%)
  • Taxi: 32 (1.5%)
  • Bicycle: 10 (0.5%)
  • Walked: 17 (0.8%)
  • Worked at home: 977 (45.4%)
Class of Workers in 2022
  • Unemployment by race in 2022
  • Unemployment rate for White non-Hispanic residents
  • 1.5%Males
  • Unemployment rate for American Indian and Alaska Native residents
  • 100.0%Females
  • Unemployment rate for other race residents
  • 100.0%Females
  • Unemployment rate for Hispanic or Latino residents
  • 8.6%Females
Year of entry for the foreign-born population in Portola Valley, California
  • Year of entry for the foreign-born population in Portola Valley, California
  • 742010 or later
  • 282000 to 2009
  • 2041990 to 1999
  • 961980 to 1989
  • 771970 to 1979
  • 306Before 1970
Ancestries in Portola Valley, CA

First ancestries reported:

  • European: 210 (11.5%)
  • English: 126 (6.9%)
  • Swedish: 107 (5.9%)
  • Scandinavian: 98 (5.4%)
  • American: 93 (5.1%)
  • Italian: 80 (4.4%)
  • French: 74 (4.1%)
  • Russian: 62 (3.4%)
  • Polish: 54 (3.0%)
  • German: 50 (2.7%)
  • Irish: 43 (2.4%)
  • Eastern European: 31 (1.7%)
  • Scottish: 26 (1.4%)
  • British: 24 (1.3%)
  • Hungarian: 24 (1.3%)
  • Northern European: 23 (1.3%)
  • Belgian: 20 (1.1%)
  • Canadian: 14 (0.8%)
  • Czech: 14 (0.8%)
  • Welsh: 14 (0.8%)
  • French Canadian: 13 (0.7%)
  • Scotch-Irish: 12 (0.7%)
  • Swiss: 11 (0.6%)
  • Austrian: 2 (0.1%)

Most common places of birth for foreign-born residents (%):

Philippines
Portola Valley:

23.1% (134)
California:

7.8% (818,297)

Mexico
Portola Valley:

10.3% (60)
California:

37.2% (3,881,193)

Canada
Portola Valley:

9.7% (56)
California:

1.2% (127,477)

Russia
Portola Valley:

7.9% (46)
California:

0.7% (71,932)

China, excluding Hong Kong and Taiwan
Portola Valley:

5.5% (32)
California:

6.6% (684,672)

Austria
Portola Valley:

5.5% (32)
California:

0.1% (6,773)

Poland
Portola Valley:

5.0% (29)
California:

0.2% (20,997)

Sweden
Portola Valley:

4.7% (27)
California:

0.1% (12,221)

India
Portola Valley:

4.5% (26)
California:

5.2% (539,184)

Hungary
Portola Valley:

3.6% (21)
California:

0.1% (10,936)

Belgium
Portola Valley:

2.9% (17)
California:

0.1% (6,176)

Panama
Portola Valley:

2.6% (15)
California:

0.1% (9,209)

France
Portola Valley:

2.2% (13)
California:

0.4% (40,224)

England
Portola Valley:

2.1% (12)
California:

0.6% (57,953)

Taiwan
Portola Valley:

2.1% (12)
California:

1.7% (176,274)

United Kingdom, excluding England and Scotland
Portola Valley:

1.9% (11)
California:

0.6% (60,582)

Hong Kong
Portola Valley:

1.7% (10)
California:

1.0% (105,215)

Place of birth for U.S.-born residents:

  • This state: 2,151
  • Other state: 1,404
  • Northeast: 399
  • Midwest: 539
  • South: 233
  • West: 228

90.8% of Portola Valley residents lived in the same house 1 years ago.
   Out of people who lived in different houses, 37.3% lived in this county.
   Out of people who lived in different counties, 72.1% lived in California.


Portola Valley:

90.8%
State average:

88.9%

Education attainment for males 25 years and older:

  • No schooling: 0
  • Nursery to 4th grade: 0
  • 5th and 6th grade: 0
  • 7th and 8th grade: 0
  • 9th grade: 8
  • 10th grade: 0
  • 11th grade: 0
  • 12th grade, no diploma: 0
  • High school graduate (or equivalency): 31
  • Less than 1 year of college: 2
  • Some college more than 1 year, no degree: 29
  • Associate degree: 66
  • Bachelor's degree: 410
  • Master's degree: 641
  • Professional school degree: 177
  • Doctorate degree: 156
Educational Attainment for Males

Education attainment for females 25 years and older:

  • No schooling: 0
  • Nursery to 4th grade: 0
  • 5th and 6th grade: 0
  • 7th and 8th grade: 2
  • 9th grade: 10
  • 10th grade: 0
  • 11th grade: 0
  • 12th grade, no diploma: 0
  • High school graduate (or equivalency): 62
  • Less than 1 year of college: 45
  • Some college more than 1 year, no degree: 202
  • Associate degree: 82
  • Bachelor's degree: 644
  • Master's degree: 504
  • Professional school degree: 192
  • Doctorate degree: 57
Educational Attainment for Females
Portola Valley marital status for males
Portola Valley marital status for females

Housing units in structures:

  • One, detached: 1,532
  • One, attached: 28
  • Two: 12
  • 3 or 4: 14
  • 5 to 9: 149
  • 10 to 19: 76
  • 20 to 49: 14
Housing units lacking complete kitchen facilities in 2022: 8.6%

House/condo owner moved in on average 21 years ago

Renter moved in on average 6 years ago

Year householders moved into residence in Portola Valley
Houses and condos Apartments
Most commonly used house heating fuel in houses and condos in Portola Valley, CA
  • 79.9%Utility gas
  • 18.5%Electricity
  • 0.9%Solar energy
  • 0.7%Fuel oil, kerosene, etc.
Most commonly used house heating fuel in apartments in Portola Valley, CA
  • 49.2%Electricity
  • 46.6%Utility gas
  • 4.2%Other fuel

Private vs. public school enrollment:

Students in private schools in grades 1 to 8 (elementary and middle school): 88
Here:

28.5%
California:

10.5%

Students in private schools in grades 9 to 12 (high school): 130
Here:

62.8%
California:

8.5%

Students in private undergraduate colleges: 91
Here:

50.6%
California:

15.9%
School Enrollment by Level of School for Male Students
School Enrollment by Level of School for Female Students
Age and Sex of Sensory-Disabled Noninstitutionalized Residents
Age and Sex of Physically-Disabled Noninstitutionalized Residents
Age and Sex of Mentally-Disabled Noninstitutionalized Residents
Age and Sex of Self-Care Disabled Noninstitutionalized Residents
Age and Sex of Go-Outside-Home Disabled Noninstitutionalized Residents
Age and Sex of Noninstitutionalized Residents with Employment Disability