Portland, ME (Maine) Houses and Residents
Estimated median house or condo value in 2022: $460,700 (it was $125,200 in 2000 )
Portland:
$460,700Maine:
$290,600
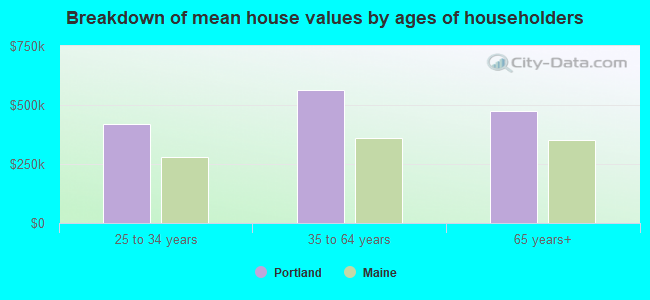
Lower value quartile - upper value quartile: $362,100 - $641,600Mean price in 2022: Detached houses: $521,820 Here:
$521,820State:
$364,324
Townhouses or other attached units: $589,010 Here:
$589,010State:
$496,775
In 2-unit structures: $654,221 Here:
$654,221State:
$349,654
In 3-to-4-unit structures: $393,437 Here:
$393,437State:
$366,418
In 5-or-more-unit structures: $593,442 Here:
$593,442State:
$342,001
Mobile homes: $259,406 Here:
$259,406State:
$142,980
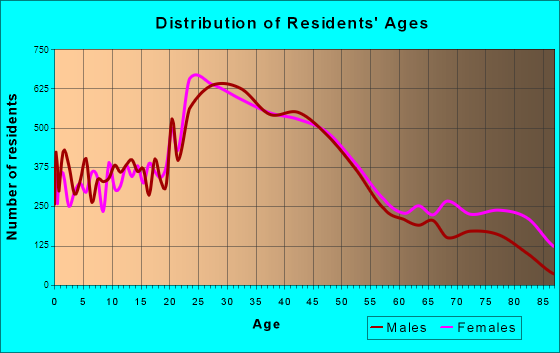
Total population: 66,666 (Urban population: 63,205, Rural population: 1,052 (all nonfarm) )
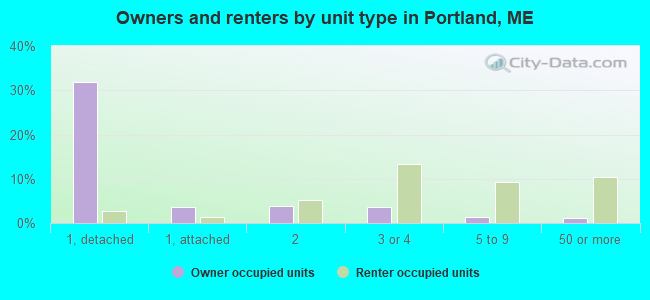
Houses: 39,405 (35,441 occupied: 14,956 owner occupied, 20,485 renter occupied )
% of renters here:
58%State:
26%
Housing density: 1,858 houses/condos per square mile
Median price asked for vacant for-sale houses and condos in 2022: $359,421.
Median contract rent in 2022: $1,304 (lower quartile is $912, upper quartile is $1,682)
Median rent asked for vacant for-rent units in 2022: $3,195
Median gross rent in Portland, ME in 2022: $1,371
Housing units in Portland with a mortgage: 10,377 (1,932 second mortgage, 73 home equity loan, 1,859 both second mortgage and home equity loan )Houses without a mortgage: 503
Median household income for houses/condos with a mortgage: $111,640
Median household income for apartments without a mortgage: $112,386
Median monthly housing costs: $1,461
Data:
Median house or condo value ($)
Median house or condo value ($ change since 2000)
Median house or condo value ($) - White
Median house or condo value ($) - Black or African American
Median house or condo value ($) - Asian
Median house or condo value ($) - Hispanic or Latino
Median house or condo value ($) - American Indian and Alaska Native
Median house or condo value ($) - Multirace
Median house or condo value ($) - Other Race
Median price asked for mobile homes ($)
Household density (households per square mile)
Mean house or condo value by units in structure - 1, detached ($)
Mean house or condo value by units in structure - 1, attached ($)
Mean house or condo value by units in structure - 2 ($)
Mean house or condo value by units in structure by units in structure - 3 or 4 ($)
Mean house or condo value by units in structure - 5 or more ($)
Mean house or condo value by units in structure - Boat, RV, van, etc. ($)
Mean house or condo value by units in structure - Mobile home ($)
Median contract rent ($)
Median contract rent - Lower quartile ($)
Median contract rent - Upper quartile ($)
Median gross rent ($)
Urban houses (%)
Rural houses (%)
Houses occupied (%)
Houses occupied (% change since 2000)
Houses owner occupied (%)
Houses owner occupied (% change since 2000)
Houses renter occupied (%)
Houses renter occupied (% change since 2000)
Vacant housing units - For rent (%)
Vacant housing units - For rent (% change since 2000)
Vacant housing units - For sale only (%)
Vacant housing units - For sale only (% change since 2000)
Vacant housing units - Rented or sold, not occupied (%)
Vacant housing units - Rented or sold, not occupied (% change since 2000)
Vacant housing units - For seasonal, recreational, or occasional use (%)
Vacant housing units - For seasonal, recreational, or occasional use (% change since 2000)
Vacant housing units - For migrant workers (%)
Vacant housing units - For migrant workers (% change since 2000)
Vacant housing units - Other vacant (%)
Vacant housing units - Other vacant (% change since 2000)
Median monthly housing costs ($)
Median household income for houses/condos with a mortgage ($)
Median household income for houses/condos without a mortgage ($)
Median household income ($)
Median household income ($) - White
Median household income ($) - Black or African American
Median household income ($) - Asian
Median household income ($) - Hispanic or Latino
Median household income ($) - American Indian and Alaska Native
Median household income ($) - Multirace
Median household income ($) - Other Race
Mortgage status - with mortgage (%)
Mortgage status - with second mortgage (%)
Mortgage status - with home equity loan (%)
Mortgage status - with both second mortgage and home equity loan (%)
Mortgage status - without a mortgage (%)
Median year house/condo built
Median year apartment built
Household type by relationship - Male householder living alone (%)
Household type by relationship - Male householder not living alone (%)
Household type by relationship - Female householder living alone (%)
Household type by relationship - Female householder not living alone (%)
Household type by relationship - Opposite-Sex spouse (%)
Household type by relationship - Same-Sex spouse (%)
Household type by relationship - Opposite-Sex unmarried partner (%)
Household type by relationship - Same-Sex unmarried partner (%)
Household type by relationship - In group quarters (%)
Size of family households - 2-person household (%)
Size of family households - 3-person household (%)
Size of family households - 4-person household (%)
Size of family households - 5-person household (%)
Size of family households - 6-person household (%)
Size of family households - 7-or-more-person household (%)
Size of nonfamily households - 1-person household (%)
Size of nonfamily households - 2-person household (%)
Size of nonfamily households - 3-person household (%)
Size of nonfamily households - 4-person household (%)
Size of nonfamily households - 5-person household (%)
Size of nonfamily households - 6-person household (%)
Size of nonfamily households - 7-or-moreperson household (%)
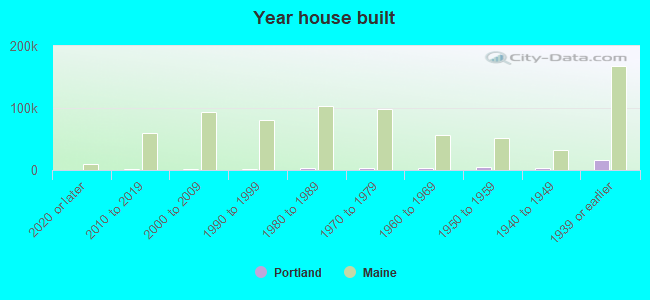
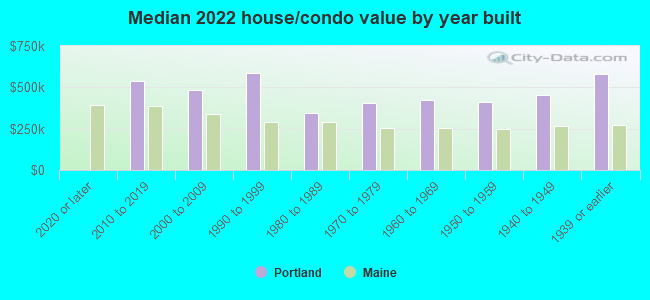
Year house built - Built 2010 or later (%)
Year house built - Built 2000 to 2009 (%)
Year house built - Built 1990 to 1999 (%)
Year house built - Built 1980 to 1989 (%)
Year house built - Built 1970 to 1979 (%)
Year house built - Built 1960 to 1969 (%)
Year house built - Built 1950 to 1959 (%)
Year house built - Built 1940 to 1949 (%)
Year house built - Built 1939 or earlier (%)
Median number of rooms in houses and condos
Median number of rooms in apartments
Median number of bedrooms in owner occupied houses
Mean number of bedrooms in owner occupied houses
Median number of bedrooms in renter occupied houses
Mean number of bedrooms in renter occupied houses
Median number of vehichles in owner occupied houses
Mean number of vehichles in owner occupied houses
Median number of vehichles in renter occupied houses
Mean number of vehichles in renter occupied houses
Rooms in owner-occupied houses - 1 room (%)
Rooms in owner-occupied houses - 2 rooms (%)
Rooms in owner-occupied houses - 3 rooms (%)
Rooms in owner-occupied houses - 4 rooms (%)
Rooms in owner-occupied houses - 5 rooms (%)
Rooms in owner-occupied houses - 6 rooms (%)
Rooms in owner-occupied houses - 7 rooms (%)
Rooms in owner-occupied houses - 8 rooms (%)
Rooms in owner-occupied houses - 9+ rooms (%)
Rooms in renter-occupied houses - 1 room (%)
Rooms in renter-occupied houses - 2 rooms (%)
Rooms in renter-occupied houses - 3 rooms (%)
Rooms in renter-occupied houses - 4 rooms (%)
Rooms in renter-occupied houses - 5 rooms (%)
Rooms in renter-occupied houses - 6 rooms (%)
Rooms in renter-occupied houses - 7 rooms (%)
Rooms in renter-occupied houses - 8 rooms (%)
Rooms in renter-occupied houses - 9+ rooms (%)
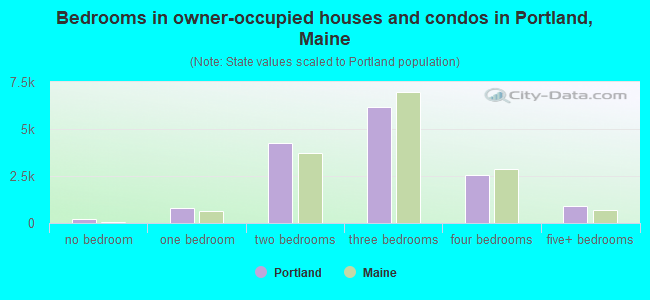
Bedrooms in owner-occupied houses - no bedrooms (%)
Bedrooms in owner-occupied houses - 1 bedroom (%)
Bedrooms in owner-occupied houses - 2 bedrooms (%)
Bedrooms in owner-occupied houses - 3 bedrooms (%)
Bedrooms in owner-occupied houses - 4 bedrooms (%)
Bedrooms in owner-occupied houses - 5+ bedrooms (%)
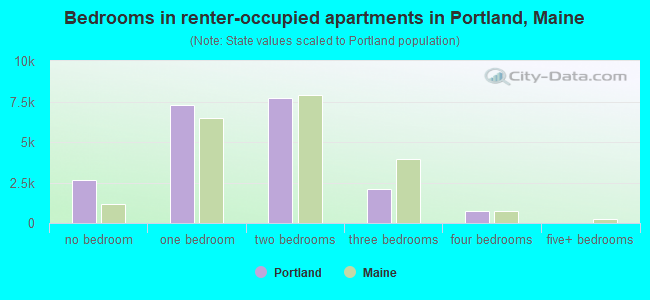
Bedrooms in renter-occupied houses - no bedrooms (%)
Bedrooms in renter-occupied houses - 1 bedroom (%)
Bedrooms in renter-occupied houses - 2 bedrooms (%)
Bedrooms in renter-occupied houses - 3 bedrooms (%)
Bedrooms in renter-occupied houses - 4 bedrooms (%)
Bedrooms in renter-occupied houses - 5+ bedrooms (%)
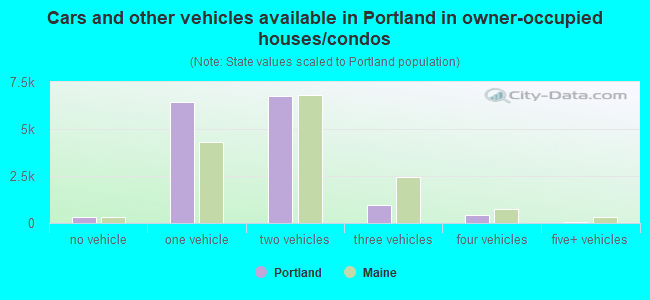
Vehicles available in owner-occupied houses - no vehicle available (%)
Vehicles available in owner-occupied houses - 1 vehicle available(%)
Vehicles available in owner-occupied houses - 2 Vehicles available (%)
Vehicles available in owner-occupied houses - 3 Vehicles available (%)
Vehicles available in owner-occupied houses - 4 Vehicles available (%)
Vehicles available in owner-occupied houses - 5+ Vehicles available (%)
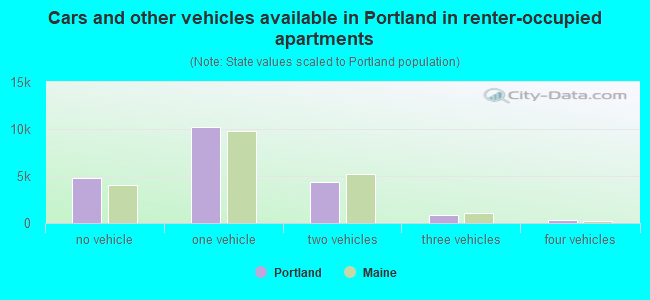
Vehicles available in renter-occupied houses - no vehicle available (%)
Vehicles available in renter-occupied houses - 1 vehicle available (%)
Vehicles available in renter-occupied houses - 2 Vehicles available (%)
Vehicles available in renter-occupied houses - 3 Vehicles available (%)
Vehicles available in renter-occupied houses - 4 Vehicles available (%)
Vehicles available in renter-occupied houses - 5+ Vehicles available (%)
Housing units in structures - 1, detached (%)
Housing units in structures - 1, attached (%)
Housing units in structures - 2 (%)
Housing units in structures - 3 or 4 (%)
Housing units in structures - 5 to 9 (%)
Housing units in structures - 10 to 19 (%)
Housing units in structures - 20 to 49 (%)
Housing units in structures - 50 or more (%)
Housing units in structures - Mobile home (%)
Housing units in structures - Boat, RV, van, etc. (%)
Housing units in structures - Owners - 1, detached (%)
Housing units in structures - Owners - 1, attached (%)
Housing units in structures - Owners - 2 (%)
Housing units in structures - Owners - 3 or 4 (%)
Housing units in structures - Owners - 5 to 9 (%)
Housing units in structures - Owners - 10 to 19 (%)
Housing units in structures - Owners - 20 to 49 (%)
Housing units in structures - Owners - 50 or more (%)
Housing units in structures - Owners - Mobile home (%)
Housing units in structures - Owners - Boat, RV, van, etc. (%)
Housing units in structures - Renters - 1, detached (%)
Housing units in structures - Renters - 1, attached (%)
Housing units in structures - Renters - 2 (%)
Housing units in structures - Renters - 3 or 4 (%)
Housing units in structures - Renters - 5 to 9 (%)
Housing units in structures - Renters - 10 to 19 (%)
Housing units in structures - Renters - 20 to 49 (%)
Housing units in structures - Renters - 50 or more (%)
Housing units in structures - Renters - Mobile home (%)
Housing units in structures - Renters - Boat, RV, van, etc. (%)
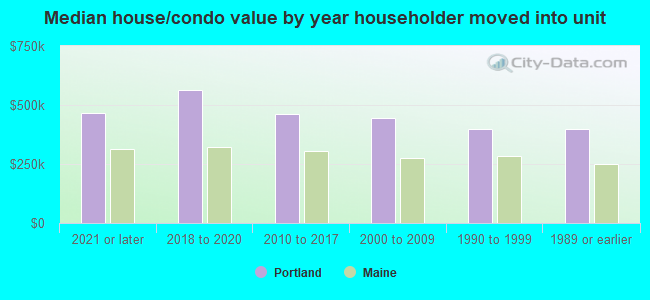
House/condo owner moved in on average (years ago)
Renter moved in on average (years ago)
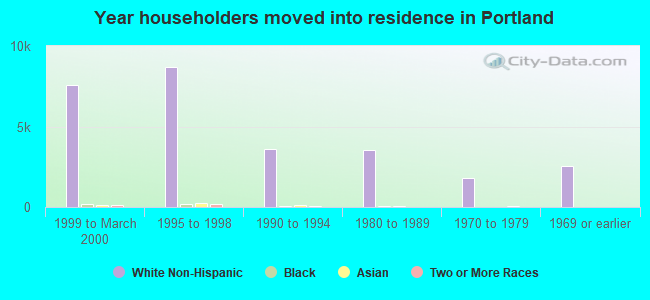
Year householder moved into unit - Moved in 1999 to March 2000 (%)
Year householder moved into unit - Moved in 1999 to March 2000 (%) - White
Year householder moved into unit - Moved in 1999 to March 2000 (%) - Black or African American
Year householder moved into unit - Moved in 1999 to March 2000 (%) - Asian
Year householder moved into unit - Moved in 1999 to March 2000 (%) - Hispanic or Latino
Year householder moved into unit - Moved in 1999 to March 2000 (%) - American Indian and Alaska Native
Year householder moved into unit - Moved in 1999 to March 2000 (%) - Multirace
Year householder moved into unit - Moved in 1999 to March 2000 (%) - Other Race
Year householder moved into unit - Moved in 1995 to 1998 (%)
Year householder moved into unit - Moved in 1995 to 1998 (%) - White
Year householder moved into unit - Moved in 1995 to 1998 (%) - Black or African American
Year householder moved into unit - Moved in 1995 to 1998 (%) - Asian
Year householder moved into unit - Moved in 1995 to 1998 (%) - Hispanic or Latino
Year householder moved into unit - Moved in 1995 to 1998 (%) - American Indian and Alaska Native
Year householder moved into unit - Moved in 1995 to 1998 (%) - Multirace
Year householder moved into unit - Moved in 1995 to 1998 (%) - Other Race
Year householder moved into unit - Moved in 1990 to 1994 (%)
Year householder moved into unit - Moved in 1990 to 1994 (%) - White
Year householder moved into unit - Moved in 1990 to 1994 (%) - Black or African American
Year householder moved into unit - Moved in 1990 to 1994 (%) - Asian
Year householder moved into unit - Moved in 1990 to 1994 (%) - Hispanic or Latino
Year householder moved into unit - Moved in 1990 to 1994 (%) - American Indian and Alaska Native
Year householder moved into unit - Moved in 1990 to 1994 (%) - Multirace
Year householder moved into unit - Moved in 1990 to 1994 (%) - Other Race
Year householder moved into unit - Moved in 1980 to 1989 (%)
Year householder moved into unit - Moved in 1980 to 1989 (%) - White
Year householder moved into unit - Moved in 1980 to 1989 (%) - Black or African American
Year householder moved into unit - Moved in 1980 to 1989 (%) - Asian
Year householder moved into unit - Moved in 1980 to 1989 (%) - Hispanic or Latino
Year householder moved into unit - Moved in 1980 to 1989 (%) - American Indian and Alaska Native
Year householder moved into unit - Moved in 1980 to 1989 (%) - Multirace
Year householder moved into unit - Moved in 1980 to 1989 (%) - Other Race
Year householder moved into unit - Moved in 1970 to 1979 (%)
Year householder moved into unit - Moved in 1970 to 1979 (%) - White
Year householder moved into unit - Moved in 1970 to 1979 (%) - Black or African American
Year householder moved into unit - Moved in 1970 to 1979 (%) - Asian
Year householder moved into unit - Moved in 1970 to 1979 (%) - Hispanic or Latino
Year householder moved into unit - Moved in 1970 to 1979 (%) - American Indian and Alaska Native
Year householder moved into unit - Moved in 1970 to 1979 (%) - Multirace
Year householder moved into unit - Moved in 1970 to 1979 (%) - Other Race
Year householder moved into unit - Moved in 1969 or earlier (%)
Year householder moved into unit - Moved in 1969 or earlier (%) - White
Year householder moved into unit - Moved in 1969 or earlier (%) - Black or African American
Year householder moved into unit - Moved in 1969 or earlier (%) - Asian
Year householder moved into unit - Moved in 1969 or earlier (%) - Hispanic or Latino
Year householder moved into unit - Moved in 1969 or earlier (%) - American Indian and Alaska Native
Year householder moved into unit - Moved in 1969 or earlier (%) - Multirace
Year householder moved into unit - Moved in 1969 or earlier (%) - Other Race
Housing units lacking complete plumbing facilities (%)
Housing units lacking complete kitchen facilities (%)
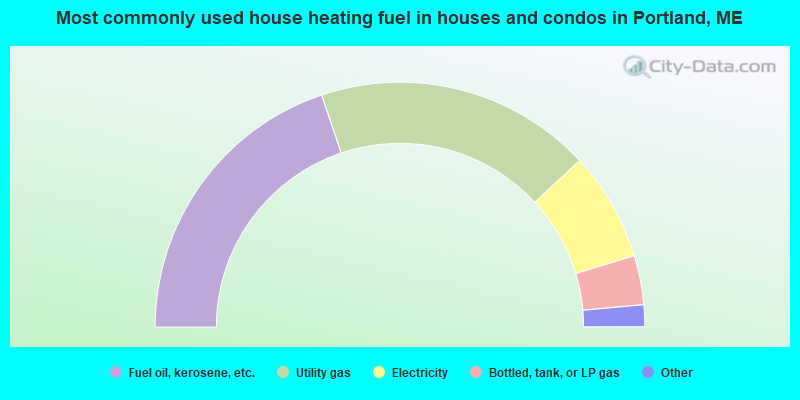
House heating fuel used in houses and condos - Utility gas (%)
House heating fuel used in houses and condos - Bottled, tank, or LP gas (%)
House heating fuel used in houses and condos - Electricity (%)
House heating fuel used in houses and condos - Fuel oil, kerosene, etc. (%)
House heating fuel used in houses and condos - Coal or coke (%)
House heating fuel used in houses and condos - Wood (%)
House heating fuel used in houses and condos - Solar energy (%)
House heating fuel used in houses and condos - Other fuel (%)
House heating fuel used in houses and condos - No fuel used (%)
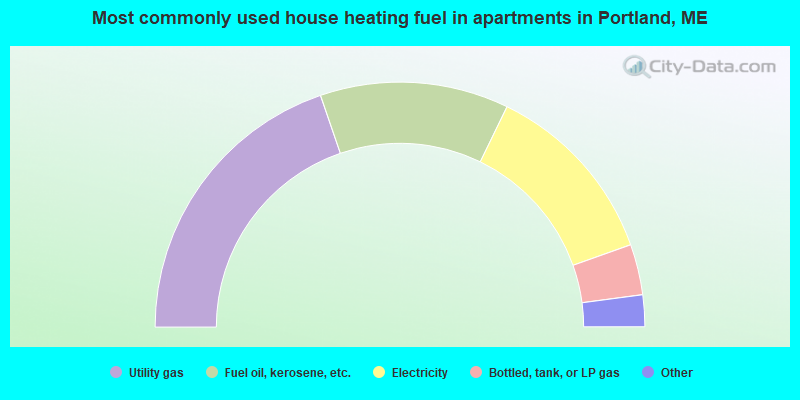
House heating fuel used in apartments - Utility gas (%)
House heating fuel used in apartments - Bottled, tank, or LP gas (%)
House heating fuel used in apartments - Electricity (%)
House heating fuel used in apartments - Fuel oil, kerosene, etc. (%)
House heating fuel used in apartments - Coal or coke (%)
House heating fuel used in apartments - Wood (%)
House heating fuel used in apartments - Solar energy (%)
House heating fuel used in apartments - Other fuel (%)
House heating fuel used in apartments - No fuel used (%)
Latest news about housing in Portland, ME collected exclusively by city-data.com from local newspapers, TV, and radio stations
Median year house/condo built: 1953Median year apartment built: 1952Household type by relationship:
Households: 68,420
Male householders: 16,302 (6,447 living alone ), Female householders: 19,139 (8,040 living alone )10,695 spouses (10,616 opposite-sex spouses ), 4,219 unmarried partners , (3,852 opposite-sex unmarried partners ), 10,036 children (9,663 natural , 212 adopted , 161 stepchildren ), 656 grandchildren , 466 brothers or sisters , 100 parents , 0 foster children , 211 other relatives , 4,676 non-relatives In group quarters: 1,920
Size of family households: 8,370 2-persons , 3,812 3-persons , 1,935 4-persons , 133 5-persons , 124 6-persons , 53 7-or-more-persons .
Size of nonfamily households: 14,487 1-person , 5,343 2-persons , 523 3-persons , 661 4-persons .
6,683 married couples with children. single-parent households (641 men , 2,090 women ).
87.7% of residents of Portland speak English at home. of residents speak Spanish at home (80% speak English very well , 11% speak English well , 8% speak English not well , 1% don't speak English at all ).of residents speak other Indo-European language at home (60% speak English very well , 17% speak English well , 19% speak English not well , 3% don't speak English at all ).of residents speak Asian or Pacific Island language at home (55% speak English very well , 18% speak English well , 21% speak English not well , 6% don't speak English at all ).of residents speak other language at home (50% speak English very well , 26% speak English well , 20% speak English not well , 5% don't speak English at all ).
Foreign born population: 8,587 (12.6%)of them are naturalized citizens )
Median number of rooms in houses and condos:
Median number of rooms in apartments
Owner-occupied Renter-occupied
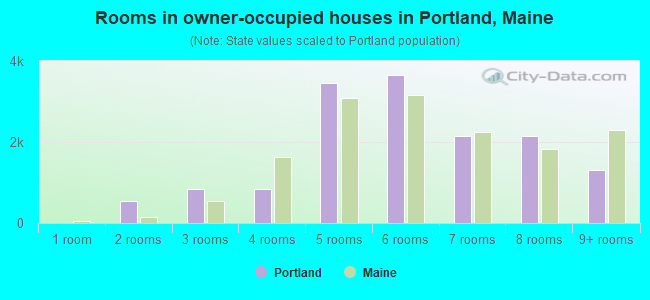
Rooms in owner-occupied houses in Portland, Maine
0 1 room 534 2 rooms 846 3 rooms 835 4 rooms 3,458 5 rooms 3,657 6 rooms 2,160 7 rooms 2,158 8 rooms 1,308 9+ rooms
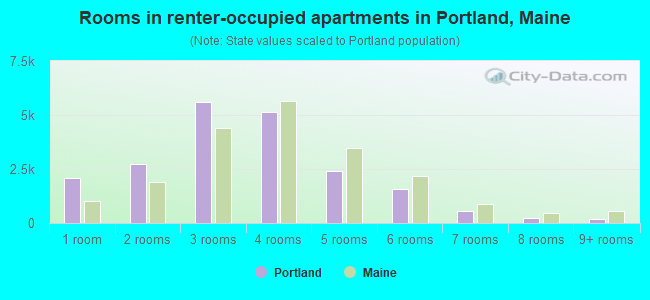
Rooms in renter-occupied apartments in Portland, Maine
2,091 1 room 2,719 2 rooms 5,609 3 rooms 5,116 4 rooms 2,392 5 rooms 1,583 6 rooms 563 7 rooms 236 8 rooms 176 9+ rooms
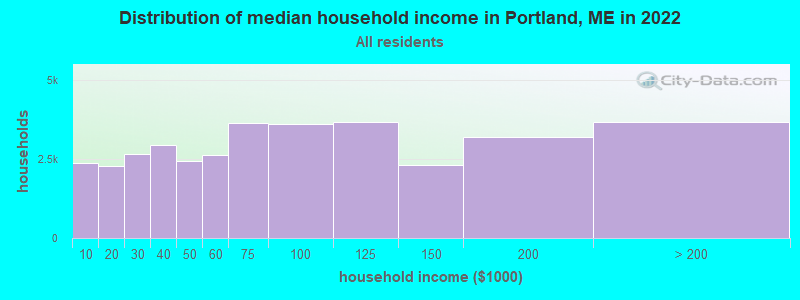
Portland, ME household income distribution 2,376 Less than $10,0002,272 $10,000 to $19,9992,651 $20,000 to $29,9992,943 $30,000 to $39,9992,455 $40,000 to $49,9992,639 $50,000 to $59,9993,644 $60,000 to $74,9993,599 $75,000 to $99,9993,669 $100,000 to $124,9992,314 $125,000 to $149,9993,203 $150,000 to $199,9993,676 $200,000 or more
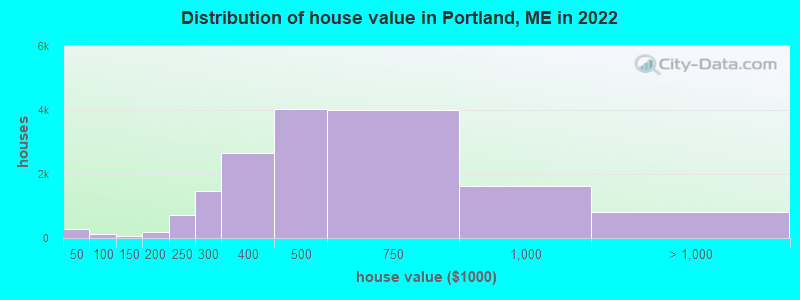
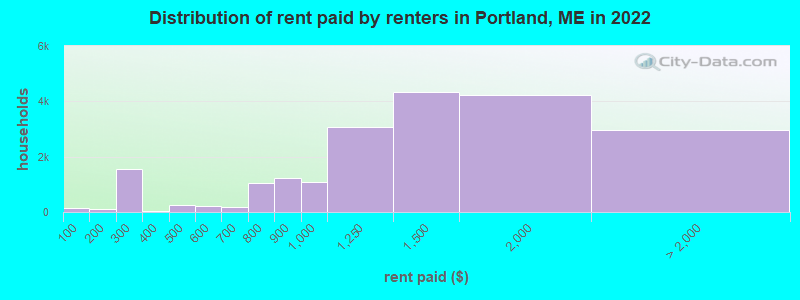
Home value of owner - occupied houses in 2022 in Portland, ME 113 Less than $10,00032 $15,000 to $19,99923 $20,000 to $24,99916 $25,000 to $29,99913 $30,000 to $34,9998 $35,000 to $39,99964 $40,000 to $49,99919 $50,000 to $59,99915 $60,000 to $69,99929 $70,000 to $79,9999 $90,000 to $99,99942 $100,000 to $124,99927 $125,000 to $149,999100 $150,000 to $174,99989 $175,000 to $199,999704 $200,000 to $249,9991,478 $250,000 to $299,9992,641 $300,000 to $399,9994,028 $400,000 to $499,9994,009 $500,000 to $749,9991,626 $750,000 to $999,999444 $1,000,000 to $1,499,999157 $1,500,000 to $1,999,999199 $2,000,000 or moreRent paid by renters in 2022 in Portland, ME 162 Less than $10035 $100 to $14960 $150 to $199988 $200 to $249576 $250 to $29939 $350 to $399109 $400 to $449141 $450 to $499222 $500 to $549180 $600 to $649583 $700 to $749478 $750 to $7991,242 $800 to $8991,087 $900 to $9993,061 $1,000 to $1,2494,339 $1,250 to $1,4994,231 $1,500 to $1,9991,466 $2,000 to $2,499536 $2,500 to $2,99970 $3,000 to $3,499183 $3,500 or more697 No cash rent
Percentage of workers working in this county: 91.6%Number of people working at home: 9,578 (24.5% of all workers )
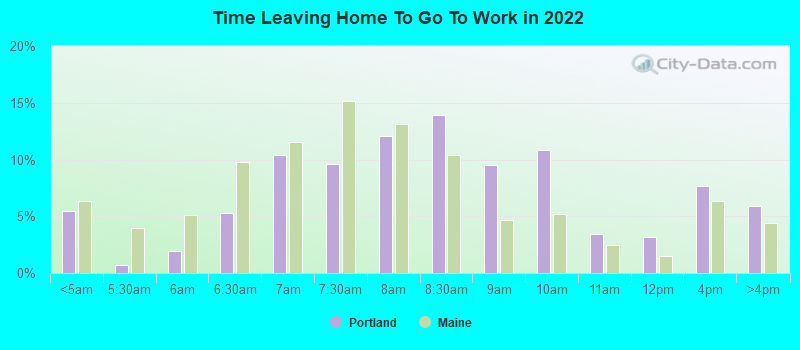
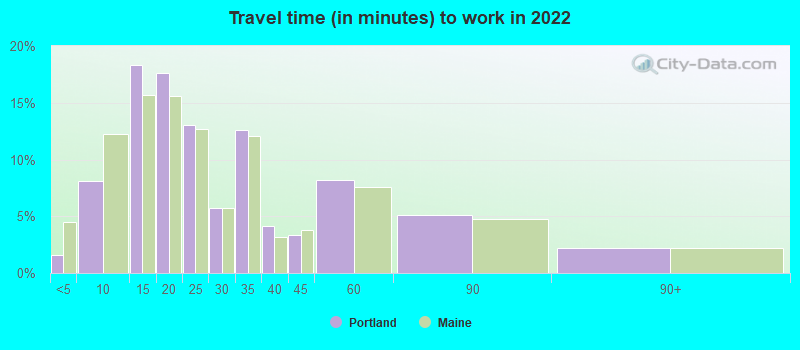
Travel time to work (commute)
Less than 5 minutes: 1,1375 to 9 minutes: 4,00510 to 14 minutes: 6,97715 to 19 minutes: 8,28420 to 24 minutes: 4,21325 to 29 minutes: 1,58830 to 34 minutes: 2,19135 to 39 minutes: 49440 to 44 minutes: 21745 to 59 minutes: 1,00760 to 89 minutes: 1,17290 or more minutes: 685
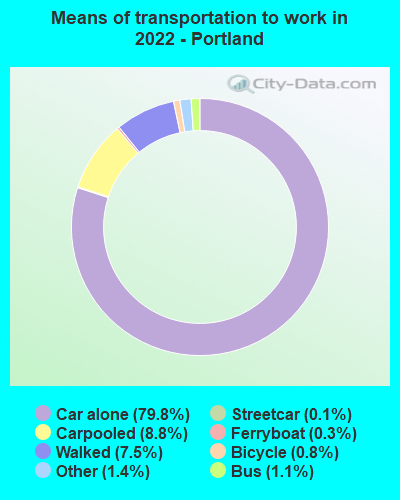
Means of transportation to work:
Drove a car alone: 44,257 (66.6%)Carpooled: 5,217 (7.9%)Bus : 529 (0.8%)Subway or elevated rail : 82 (0.1%)Long-distance train or commuter rail : 10 (0.0%)Ferryboat: 240 (0.4%)Taxi: 948 (1.4%)Bicycle: 693 (1.0%)Walked: 4,301 (6.5%)Worked at home: 9,578 (14.4%)
Unemployment by race in 2022
Unemployment rate for White non-Hispanic residents 2.1% Males1.8% FemalesUnemployment rate for Black residents 2.7% Males6.4% FemalesUnemployment rate for Asian residents 5.0% Males1.9% FemalesUnemployment rate for two or more race residents 2.7% Males8.9% FemalesUnemployment rate for Hispanic or Latino residents 2.4% Males2.0% Females
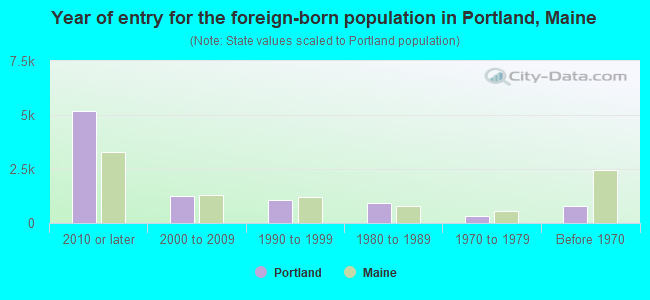
Year of entry for the foreign-born population in Portland, Maine
5,204 2010 or later 1,241 2000 to 2009 1,062 1990 to 1999 936 1980 to 1989 326 1970 to 1979 806 Before 1970
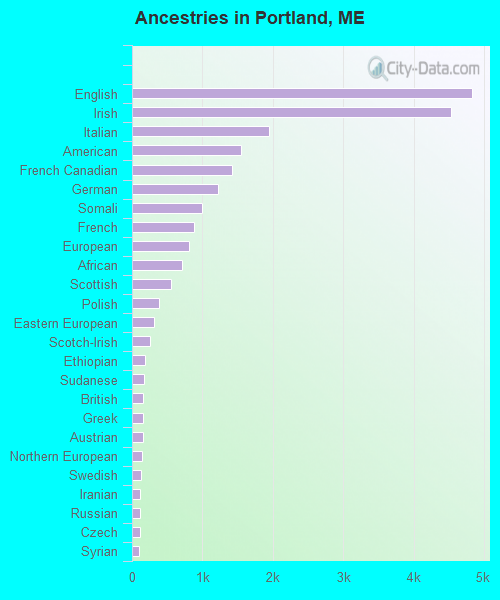
First ancestries reported:
English: 4,825 (16.1%)
Irish: 4,529 (15.1%)
Italian: 1,948 (6.5%)
American: 1,550 (5.2%)
French Canadian: 1,422 (4.8%)
German: 1,225 (4.1%)
Somali: 994 (3.3%)
French: 884 (3.0%)
European: 804 (2.7%)
African: 716 (2.4%)
Scottish: 555 (1.9%)
Polish: 387 (1.3%)
Eastern European: 314 (1.0%)
Scotch-Irish: 259 (0.9%)
Ethiopian: 178 (0.6%)
Sudanese: 174 (0.6%)
British: 163 (0.5%)
Greek: 161 (0.5%)
Austrian: 156 (0.5%)
Northern European: 149 (0.5%)
Swedish: 133 (0.4%)
Iranian: 115 (0.4%)
Russian: 115 (0.4%)
Czech: 108 (0.4%)
Syrian: 105 (0.4%)
Iraqi: 99 (0.3%)
Danish: 97 (0.3%)
Welsh: 97 (0.3%)
Scandinavian: 94 (0.3%)
South African: 92 (0.3%)
Finnish: 90 (0.3%)
Dutch: 88 (0.3%)
Lithuanian: 87 (0.3%)
Romanian: 83 (0.3%)
Brazilian: 77 (0.3%)
Portuguese: 75 (0.3%)
Canadian: 67 (0.2%)
Norwegian: 64 (0.2%)
Albanian: 60 (0.2%)
Ukrainian: 57 (0.2%)
Swiss: 48 (0.2%)
Jamaican: 46 (0.2%)
Lebanese: 37 (0.1%)
Turkish: 28 (0.09%)
Ugandan: 27 (0.09%)
Estonian: 27 (0.09%)
Haitian: 23 (0.08%)
Yugoslavian: 22 (0.07%)
Australian: 21 (0.07%)
Cajun: 19 (0.06%)
Hungarian: 15 (0.05%)
Nigerian: 14 (0.05%)
Serbian: 14 (0.05%)
U.S. Virgin Islander: 12 (0.04%)
Cape Verdean: 11 (0.04%)
Bulgarian: 10 (0.03%)
Israeli: 10 (0.03%)
Arab: 10 (0.03%)
Celtic: 9 (0.03%)
Czechoslovakian: 8 (0.03%)
Armenian: 7 (0.02%)
Trinidadian and Tobagonian: 3 (0.01%)
Most common places of birth for foreign-born residents (%): Other Eastern Africa Portland:
12.0% (909)Maine:
5.2% (2,702)
Other Middle Africa Portland:
11.5% (866)Maine:
2.9% (1,521)
Democratic Republic of Congo (Zaire) Portland:
9.6% (728)Maine:
2.0% (1,020)
Somalia Portland:
7.0% (526)Maine:
2.8% (1,472)
Vietnam Portland:
6.0% (457)Maine:
2.0% (1,031)
China, excluding Hong Kong and Taiwan Portland:
5.5% (419)Maine:
4.6% (2,392)
South Africa Portland:
5.3% (402)Maine:
1.2% (612)
Congo Portland:
3.9% (292)Maine:
0.8% (421)
Canada Portland:
3.7% (283)Maine:
18.9% (9,810)
Cambodia Portland:
2.8% (208)Maine:
1.2% (603)
United Kingdom, excluding England and Scotland Portland:
2.7% (201)Maine:
2.5% (1,305)
Korea Portland:
2.3% (171)Maine:
2.2% (1,146)
Philippines Portland:
1.8% (133)Maine:
4.0% (2,054)
Spain Portland:
1.7% (125)Maine:
0.8% (406)
Sudan Portland:
1.5% (117)Maine:
0.4% (198)
Kenya Portland:
1.5% (115)Maine:
1.1% (590)
Place of birth for U.S.-born residents:
This state: 29,464Other state: 29,680Northeast: 18,929Midwest: 4,049South: 4,295West: 2,407 83.8% of Portland residents lived in the same house 1 years ago.
Out of people who lived in different houses, 24.8% lived in this county.
Out of people who lived in different counties, 31.2% lived in Maine.
Portland:
83.8%State average:
89.7%
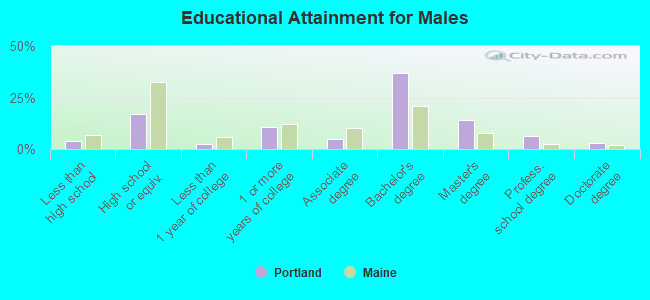
Education attainment for males 25 years and older:
No schooling: 524Nursery to 4th grade: 05th and 6th grade: 07th and 8th grade: 1429th grade: 19810th grade: 4911th grade: 5512th grade, no diploma: 74High school graduate (or equivalency): 4,414Less than 1 year of college: 628Some college more than 1 year, no degree: 2,798Associate degree: 1,259Bachelor's degree: 9,581Master's degree: 3,698Professional school degree: 1,660Doctorate degree: 740
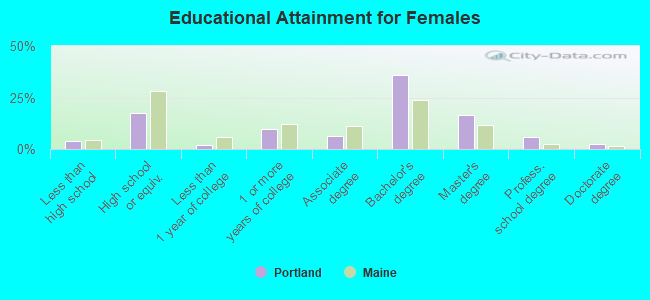
Education attainment for females 25 years and older:
No schooling: 82Nursery to 4th grade: 355th and 6th grade: 3547th and 8th grade: 1919th grade: 3910th grade: 011th grade: 36512th grade, no diploma: 45High school graduate (or equivalency): 4,921Less than 1 year of college: 563Some college more than 1 year, no degree: 2,802Associate degree: 1,720Bachelor's degree: 10,133Master's degree: 4,660Professional school degree: 1,683Doctorate degree: 735
Housing units in structures:
One, detached: 13,166One, attached: 1,890Two: 3,1693 or 4: 7,1235 to 9: 4,44410 to 19: 2,78620 to 49: 2,17350 or more: 4,543Mobile homes: 111Housing units lacking complete plumbing facilities in 2022: 0.7%Housing units lacking complete kitchen facilities in 2022: 1.9%House/condo owner moved in on average 11 years ago
Renter moved in on average 2 years ago
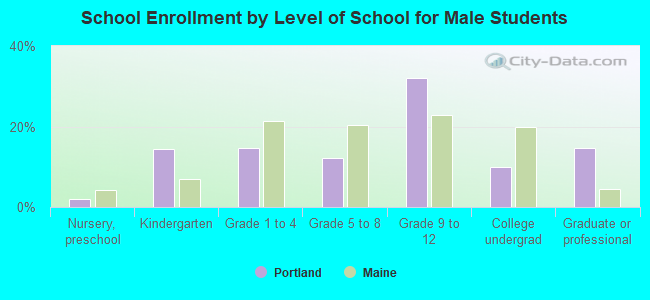
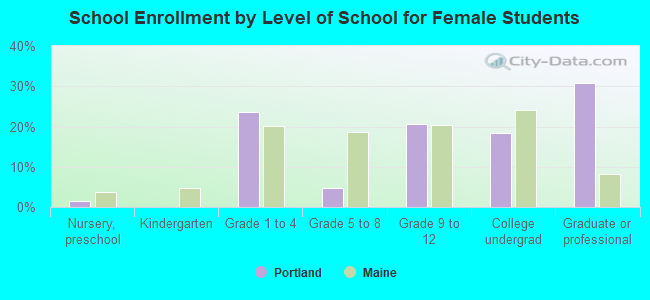
Private vs. public school enrollment:
Students in private schools in grades 1 to 8 (elementary and middle school): 61 Students in private schools in grades 9 to 12 (high school): 735 Students in private undergraduate colleges: 570