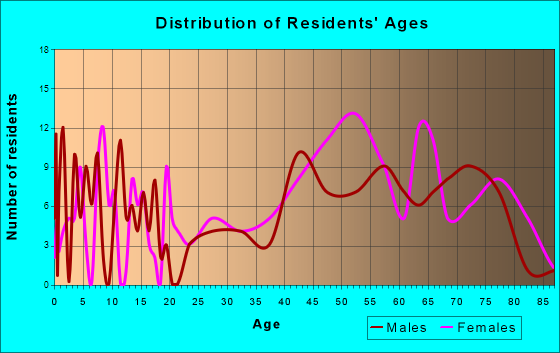
Port Orford, OR (Oregon) Houses and Residents
| Port Orford: | $262,811 |
| Oregon: | $475,600 |
Total population: 1,133 (Urban population: 0, Rural population: 1,153 (all nonfarm))
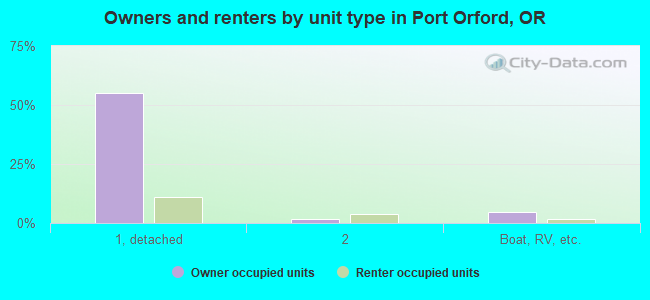
Houses: 773 (608 occupied: 451 owner occupied, 159 renter occupied)
| % of renters here: | 26% |
| State: | 37% |
Housing density: 482 houses/condos per square mile
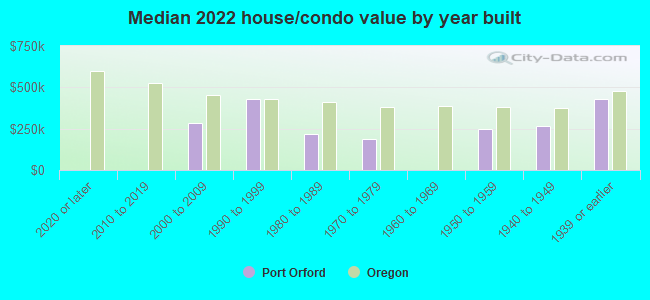
Median price asked for vacant for-sale houses and condos in 2022: $420,335.
Median contract rent in 2022: $620 (lower quartile is $474, upper quartile is $816)
Median rent asked for vacant for-rent units in 2022: $489
Median gross rent in Port Orford, OR in 2022: $611
Housing units in Port Orford with a mortgage: 164 (17 second mortgage, 0 home equity loan, 12 both second mortgage and home equity loan)
Houses without a mortgage: 0
Median household income for houses/condos with a mortgage: $46,066
Median household income for apartments without a mortgage: $36,442
Median monthly housing costs: $639
Compare current foreclosures near your location:
| Photo | Address | Area | Beds / Baths | Price | Details |
|---|---|---|---|---|---|

|
#1
S High St
Columbus, OH 43207
|
1,678 sq. feet
|
2 baths 4 beds |
$31,900
|
show details |

|
#2
E 21st Ave
Columbus, OH 43211
|
1,061 sq. feet
|
1 baths 3 beds |
$179,900
|
show details |

|
#3
Bayberry Cir
Columbus, OH 43207
|
1,564 sq. feet
|
1 baths 3 beds |
$127,500
|
show details |

|
#4
Glenmate Ct
Columbus, OH 43223
|
1,050 sq. feet
|
1 baths 3 beds |
show details | |

|
#5
Hiawatha Park Dr
Columbus, OH 43211
|
1,278 sq. feet
|
1 baths 4 beds |
show details | |

|
#6
Executive Ct
Westerville, OH 43081
|
1,811 sq. feet
|
2 baths 3 beds |
show details | |

|
#7
Chidley St
Galloway, OH 43119
|
1,502 sq. feet
|
1 baths 3 beds |
show details | |

|
#8
E Welch Ave
Columbus, OH 43207
|
1,864 sq. feet
|
2 baths 4 beds |
show details | |

|
#9
S Hague Ave
Columbus, OH 43204
|
979 sq. feet
|
1 baths 2 beds |
show details | |

|
#10
Chester Rd
Columbus, OH 43221
|
3,300 sq. feet
|
4 baths 5 beds |
show details |
| Photo | Address | Area | Beds / Baths | Price | Details |
|---|---|---|---|---|---|

|
#11
S Champion Ave
Columbus, OH 43207
|
1,157 sq. feet
|
1 baths 2 beds |
show details | |

|
#12
E Lincoln Ave
Columbus, OH 43214
|
874 sq. feet
|
1 baths 3 beds |
show details | |

|
#13
Armada Rd
Columbus, OH 43232
|
1,028 sq. feet
|
1 baths 4 beds |
show details | |

|
#14
Lehner Rd
Columbus, OH 43224
|
1,628 sq. feet
|
2 baths 4 beds |
show details | |

|
#15
Kelton Ave
Columbus, OH 43206
|
1,080 sq. feet
|
1 baths 3 beds |
show details | |

|
#16
Fairfield Ave
Columbus, OH 43203
|
984 sq. feet
|
1 baths 2 beds |
show details | |

|
#17
Upton Rd E
Columbus, OH 43232
|
852 sq. feet
|
1 baths 3 beds |
show details | |

|
#18
Brookstone Dr
Westerville, OH 43082
|
1,783 sq. feet
|
3 baths 3 beds |
show details | |

|
#19
E Howard Rd
Columbus, OH 43207
|
1,056 sq. feet
|
1 baths 3 beds |
show details | |

|
#20
Summertree Ln
Westerville, OH 43081
|
2,496 sq. feet
|
2 baths 3 beds |
show details |
| Photo | Address | Area | Beds / Baths | Price | Details |
|---|---|---|---|---|---|

|
#21
N Roys Ave
Columbus, OH 43204
|
1,248 sq. feet
|
2 baths 3 beds |
show details | |

|
#22
Marshrun Dr
Grove City, OH 43123
|
2,036 sq. feet
|
2 baths 4 beds |
show details | |

|
#23
London Groveport Rd
Grove City, OH 43123
|
816 sq. feet
|
1 baths 2 beds |
show details | |

|
#24
Striebel Ct
Columbus, OH 43227
|
925 sq. feet
|
1 baths 3 beds |
show details | |

|
#25
Fergus Rd
Grove City, OH 43123
|
3,312 sq. feet
|
2 baths 4 beds |
show details | |

|
#26
Ashgrove Dr
Grove City, OH 43123
|
1,772 sq. feet
|
2 baths 4 beds |
show details | |

|
#27
Meadowbrook Dr
Columbus, OH 43207
|
1,752 sq. feet
|
2 baths 4 beds |
show details | |

|
#28
Grasmere Ave
Columbus, OH 43211
|
720 sq. feet
|
1 baths 2 beds |
show details | |

|
#29
Whittman Ct
Plain City, OH 43064
|
3,186 sq. feet
|
3 baths 4 beds |
show details | |

|
#30
Hamilton Ave
Columbus, OH 43211
|
1,061 sq. feet
|
1 baths 3 beds |
show details |
| Photo | Address | Area | Beds / Baths | Price | Details |
|---|---|---|---|---|---|

|
#31
S Richardson Ave
Columbus, OH 43204
|
1,520 sq. feet
|
2 baths 3 beds |
show details | |

|
#32
Kingsglen Dr
Grove City, OH 43123
|
1,635 sq. feet
|
2 baths 4 beds |
show details | |

|
#33
Midland Ave
Columbus, OH 43223
|
1,518 sq. feet
|
1 baths 2 beds |
show details | |

|
#34
Elaine Rd
Columbus, OH 43213
|
764 sq. feet
|
1 baths 2 beds |
show details | |

|
#35
High Free Pike
West Jefferson, OH 43162
|
1,216 sq. feet
|
2 baths 4 beds |
show details | |

|
#36
Stoneybrook Blvd # 21a
Hilliard, OH 43026
|
1,231 sq. feet
|
2 baths 3 beds |
show details | |

|
#37
Hildreth Ave
Columbus, OH 43203
|
1,798 sq. feet
|
2 baths 4 beds |
show details | |

|
#38
Scottwood Rd
Columbus, OH 43227
|
1,008 sq. feet
|
1 baths 3 beds |
show details | |

|
#39
N 18th St
Columbus, OH 43203
|
1,690 sq. feet
|
1 baths 4 beds |
show details | |

|
#40
Gladys Rd
Columbus, OH 43228
|
832 sq. feet
|
1 baths 3 beds |
show details |
| Photo | Address | Area | Beds / Baths | Price | Details |
|---|---|---|---|---|---|

|
#41
Falls Peak Ln
Delaware, OH 43015
|
1,352 sq. feet
|
2 baths 2 beds |
show details | |

|
#42
Brookfield Rd
Columbus, OH 43229
|
896 sq. feet
|
1 baths 3 beds |
show details | |

|
#43
Allwood Ct
Columbus, OH 43231
|
1,683 sq. feet
|
2 baths 3 beds |
show details | |

|
#44
Colorado Ave
Groveport, OH 43125
|
1,502 sq. feet
|
1 baths 3 beds |
show details | |

|
#45
Morgan Ln
Columbus, OH 43230
|
4,619 sq. feet
|
5 baths 6 beds |
show details | |

|
#46
Cole Rd
Columbus, OH 43228
|
1,833 sq. feet
|
2 baths 3 beds |
show details | |

|
#47
Bucknell Rd
Columbus, OH 43213
|
1,054 sq. feet
|
1 baths 3 beds |
show details | |

|
#48
Doral Ave
Columbus, OH 43213
|
2,008 sq. feet
|
2 baths 4 beds |
show details | |

|
#49
Belfast Dr
Columbus, OH 43227
|
1,142 sq. feet
|
2 baths 3 beds |
show details | |

|
Check over 1 million property listings on Foreclosure.com!
|
browse all offers | |||


 | Port Orford VS Gold Beach (24 replies) |
| Retirees have changed Florence (32 replies) |
| Pros and Cons: Port Orford vs. Gold Beach (44 replies) |
| Port Orford (3 replies) |
| Looking for a good coastal town with a cheap fixer upper house (19 replies) |
| Is the Coos Bay/Florence area the "Last Hidden Gem" of Oregon?? (106 replies) |
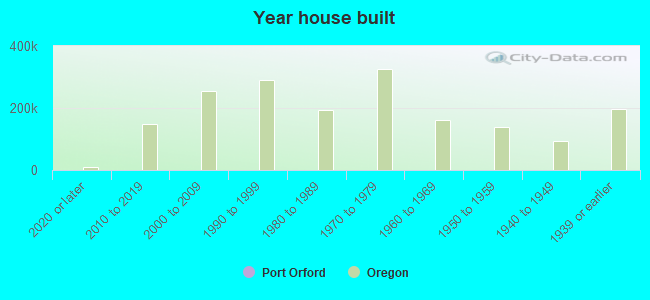
Median year apartment built: 1964
Household type by relationship:
Households: 899- Male householders: 332 (205 living alone), Female householders: 263 (143 living alone)
177 spouses (177 opposite-sex spouses), 23 unmarried partners, (23 opposite-sex unmarried partners), 84 children (84 natural, 0 adopted, 0 stepchildren), 8 grandchildren, 1 brothers or sisters, 0 parents, 0 foster children, 0 other relatives, 0 non-relatives
- In group quarters: 9
Size of family households: 175 2-persons, 17 3-persons, 42 4-persons.
Size of nonfamily households: 373 1-person, 15 2-persons.
0 married couples with children.
32 single-parent households (29 men, 3 women).
100.4% of residents of Port Orford speak English at home.
0.4% of residents speak Spanish at home (100% speak English very well).
0.2% of residents speak other Indo-European language at home (100% speak English very well).
Foreign born population: 22 (2.4%)
(13.6% of them are naturalized citizens)
| Here: | 4.6 |
| State: | 6.2 |
| Here: | 3.9 |
| State: | 4.0 |
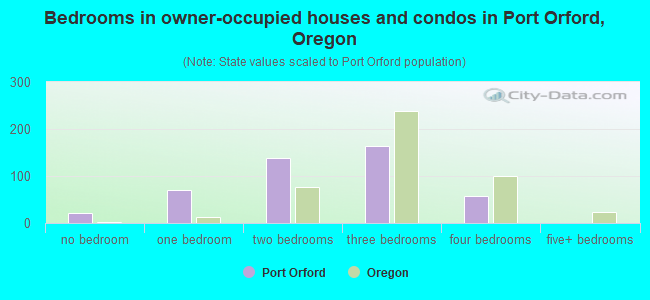
- Bedrooms in owner-occupied houses and condos in Port Orford, Oregon
- 22no bedroom
- 711 bedroom
- 1392 bedrooms
- 1633 bedrooms
- 584 bedrooms
- 05+ bedrooms
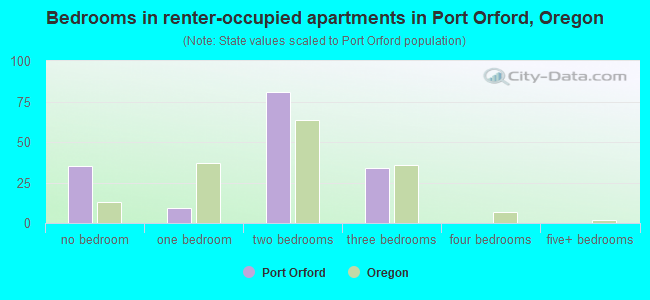
- Bedrooms in renter-occupied apartments in Port Orford, Oregon
- 35no bedroom
- 91 bedroom
- 812 bedrooms
- 343 bedrooms
- 04 bedrooms
- 05+ bedrooms
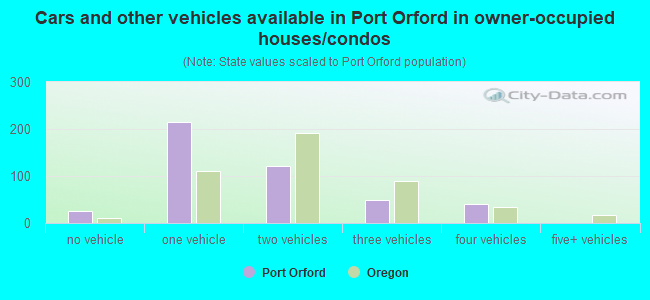
- Cars and other vehicles available in Port Orford in owner-occupied houses/condos
- 25no vehicle
- 2151 vehicle
- 1212 vehicles
- 503 vehicles
- 414 vehicles
- 05+ vehicles
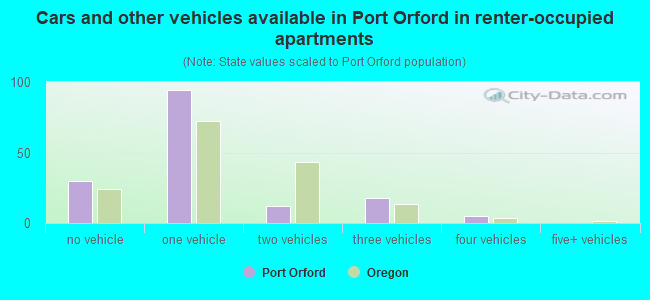
- Cars and other vehicles available in Port Orford in renter-occupied apartments
- 30no vehicle
- 941 vehicle
- 122 vehicles
- 173 vehicles
- 54 vehicles
- 05+ vehicles
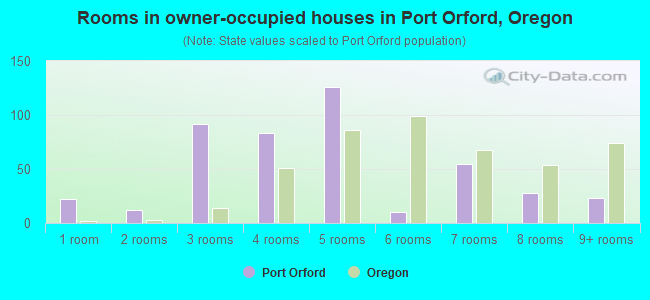
- Rooms in owner-occupied houses in Port Orford, Oregon
- 221 room
- 122 rooms
- 923 rooms
- 834 rooms
- 1265 rooms
- 106 rooms
- 557 rooms
- 288 rooms
- 239+ rooms
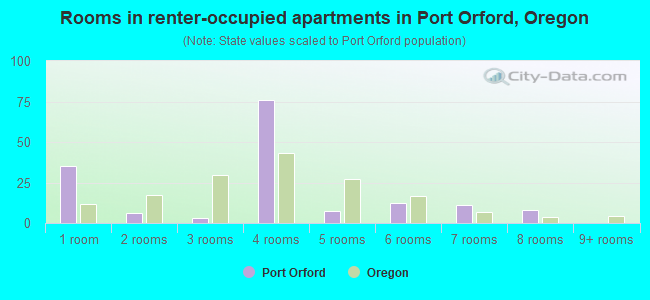
- Rooms in renter-occupied apartments in Port Orford, Oregon
- 351 room
- 62 rooms
- 33 rooms
- 764 rooms
- 75 rooms
- 126 rooms
- 117 rooms
- 88 rooms
- 09+ rooms
Port Orford, OR household income distribution

- 58Less than $10,000
- 130$10,000 to $19,999
- 89$20,000 to $29,999
- 123$30,000 to $39,999
- 17$40,000 to $49,999
- 54$50,000 to $59,999
- 35$60,000 to $74,999
- 63$75,000 to $99,999
- 18$100,000 to $124,999
- 14$125,000 to $149,999
- 11$200,000 or more

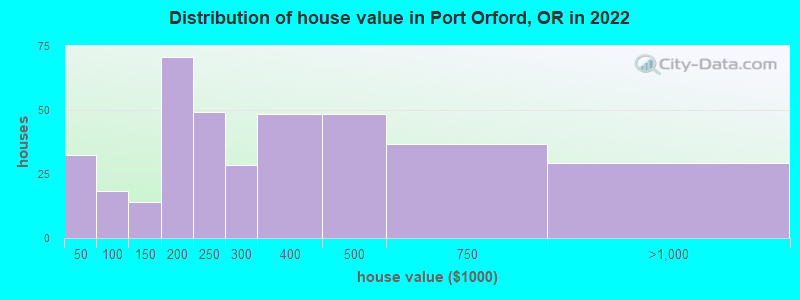
Home value of owner - occupied houses in 2022 in Port Orford, OR
-
- 21Less than $10,000
- 10$40,000 to $49,999
- 2$70,000 to $79,999
- 5$90,000 to $99,999
- 2$100,000 to $124,999
- 11$125,000 to $149,999
- 40$150,000 to $174,999
- 30$175,000 to $199,999
- 49$200,000 to $249,999
- 28$250,000 to $299,999
- 48$300,000 to $399,999
- 48$400,000 to $499,999
- 36$500,000 to $749,999
- 29$750,000 to $999,999
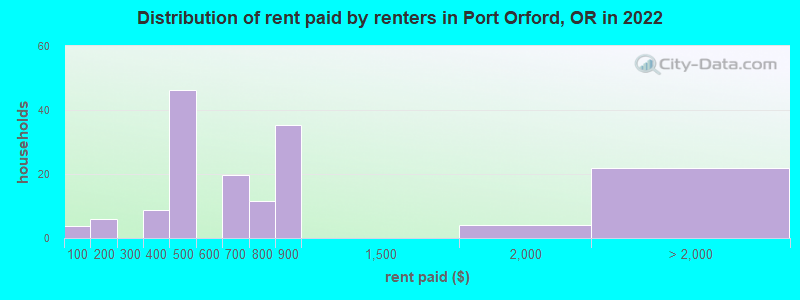
Rent paid by renters in 2022 in Port Orford, OR
-
- 3Less than $100
- 6$150 to $199
- 8$350 to $399
- 3$400 to $449
- 42$450 to $499
- 19$600 to $649
- 11$700 to $749
- 35$800 to $899
- 4$1,500 to $1,999
- 21No cash rent
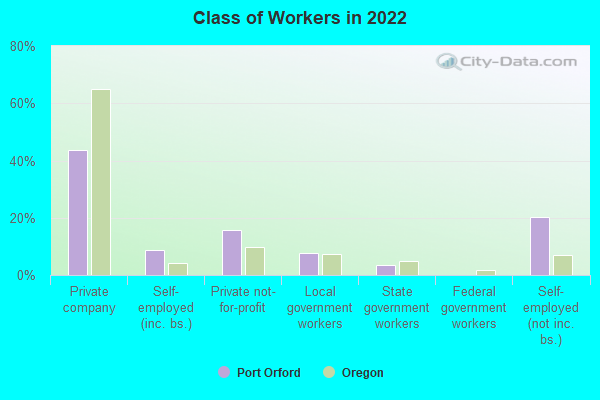
Percentage of workers working in this county: 89.3%
Number of people working at home: 70 (24.9% of all workers)
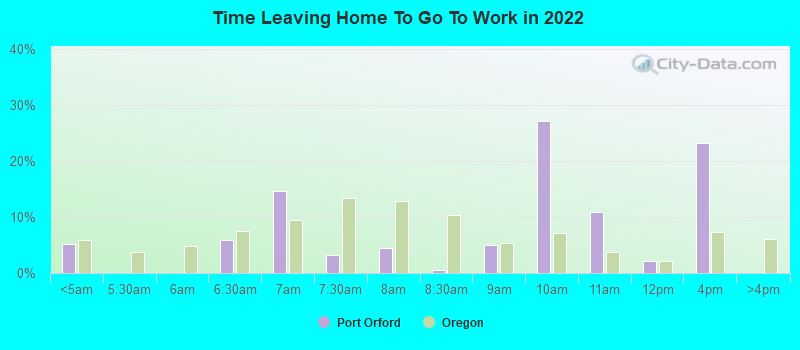
Travel time to work (commute)
- Less than 5 minutes: 44
- 5 to 9 minutes: 45
- 10 to 14 minutes: 41
- 15 to 19 minutes: 8
- 20 to 24 minutes: 33
- 25 to 29 minutes: 0
- 30 to 34 minutes: 0
- 35 to 39 minutes: 0
- 40 to 44 minutes: 10
- 45 to 59 minutes: 10
- 60 to 89 minutes: 12
- 90 or more minutes: 9
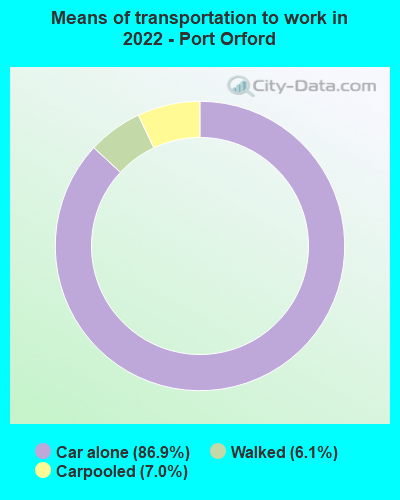
Means of transportation to work:
- Drove a car alone: 520 (75.1%)
- Carpooled: 37 (5.3%)
- Walked: 32 (4.6%)
- Worked at home: 133 (19.2%)
- Unemployment by race in 2022
- Unemployment rate for White non-Hispanic residents
- 11.7%Males
- 6.8%Females
- Unemployment rate for Hispanic or Latino residents
- 100.0%Males
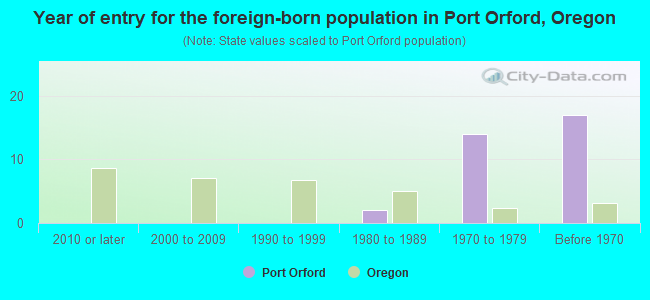
- Year of entry for the foreign-born population in Port Orford, Oregon
- 02010 or later
- 02000 to 2009
- 01990 to 1999
- 21980 to 1989
- 141970 to 1979
- 17Before 1970
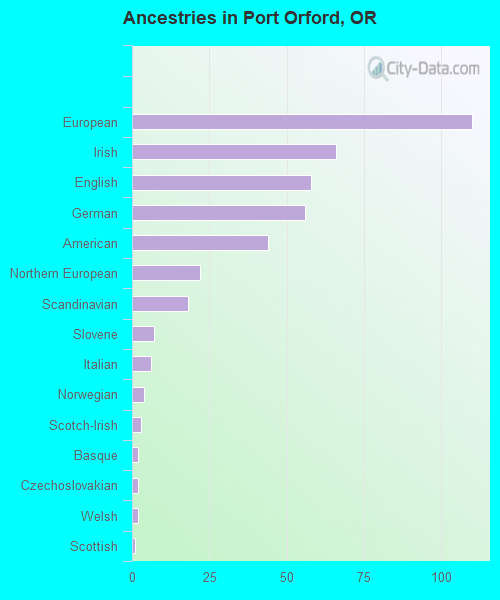
First ancestries reported:
- European: 110 (24.4%)
- Irish: 66 (14.6%)
- English: 58 (12.8%)
- German: 56 (12.4%)
- American: 44 (9.7%)
- Northern European: 22 (4.9%)
- Scandinavian: 18 (4.0%)
- Slovene: 7 (1.5%)
- Italian: 6 (1.3%)
- Norwegian: 4 (0.9%)
- Scotch-Irish: 3 (0.7%)
- Basque: 2 (0.4%)
- Czechoslovakian: 2 (0.4%)
- Welsh: 2 (0.4%)
- Scottish: 1 (0.2%)
Most common places of birth for foreign-born residents (%):
| Port Orford: | 72.7% (16) |
| Oregon: | 1.5% (6,313) |
| Port Orford: | 18.2% (4) |
| Oregon: | 3.7% (15,229) |
| Port Orford: | 4.5% (1) |
| Oregon: | 2.8% (11,450) |
Place of birth for U.S.-born residents:
- This state: 269
- Other state: 608
- Northeast: 70
- Midwest: 146
- South: 30
- West: 360
90.1% of Port Orford residents lived in the same house 1 years ago.
Out of people who lived in different houses, 13.3% lived in this county.
Out of people who lived in different counties, 13.2% lived in Oregon.
| Port Orford: | 90.1% |
| State average: | 85.5% |
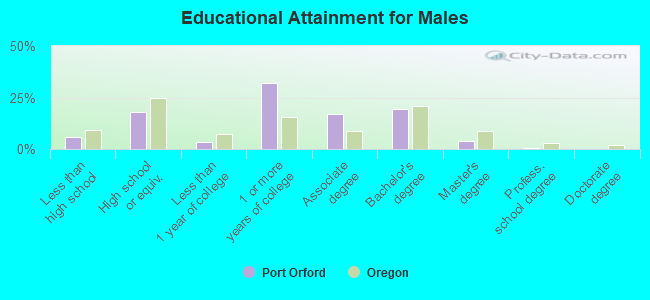
Education attainment for males 25 years and older:
- No schooling: 0
- Nursery to 4th grade: 0
- 5th and 6th grade: 0
- 7th and 8th grade: 0
- 9th grade: 0
- 10th grade: 11
- 11th grade: 0
- 12th grade, no diploma: 14
- High school graduate (or equivalency): 80
- Less than 1 year of college: 14
- Some college more than 1 year, no degree: 143
- Associate degree: 75
- Bachelor's degree: 87
- Master's degree: 17
- Professional school degree: 2
- Doctorate degree: 0
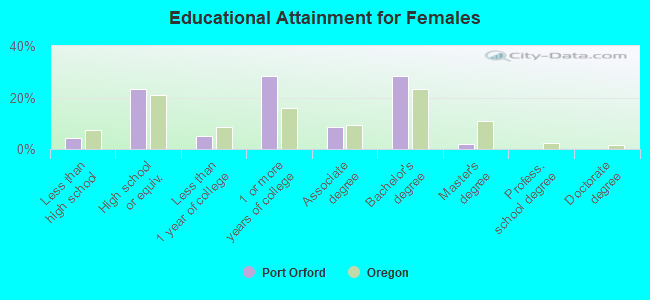
Education attainment for females 25 years and older:
- No schooling: 0
- Nursery to 4th grade: 1
- 5th and 6th grade: 0
- 7th and 8th grade: 0
- 9th grade: 0
- 10th grade: 2
- 11th grade: 0
- 12th grade, no diploma: 12
- High school graduate (or equivalency): 84
- Less than 1 year of college: 18
- Some college more than 1 year, no degree: 103
- Associate degree: 31
- Bachelor's degree: 103
- Master's degree: 7
- Professional school degree: 0
- Doctorate degree: 0
Housing units in structures:
- One, detached: 560
- Two: 43
- 3 or 4: 2
- 5 to 9: 26
- 10 to 19: 26
- Mobile homes: 77
- Boats, RVs, vans, etc.: 36
Median worth of mobile homes: $210,797
Housing units lacking complete kitchen facilities in 2022: 5.4%
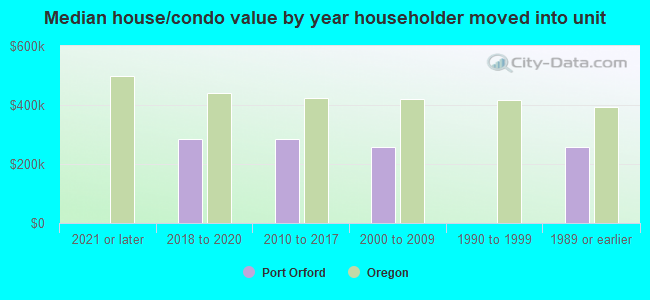
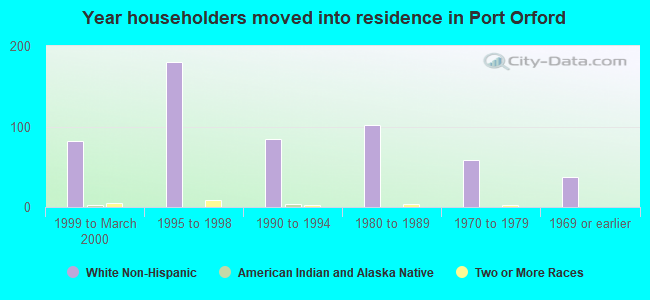
House/condo owner moved in on average 8 years ago
Renter moved in on average 5 years ago
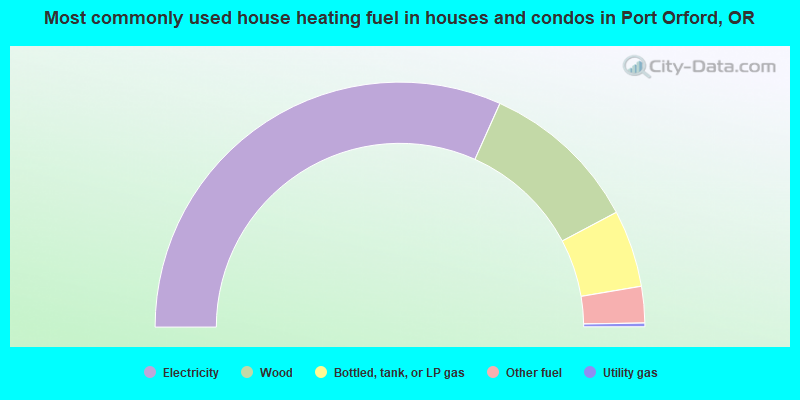
- 63.4%Electricity
- 21.1%Wood
- 10.2%Bottled, tank, or LP gas
- 4.8%Other fuel
- 0.5%Utility gas
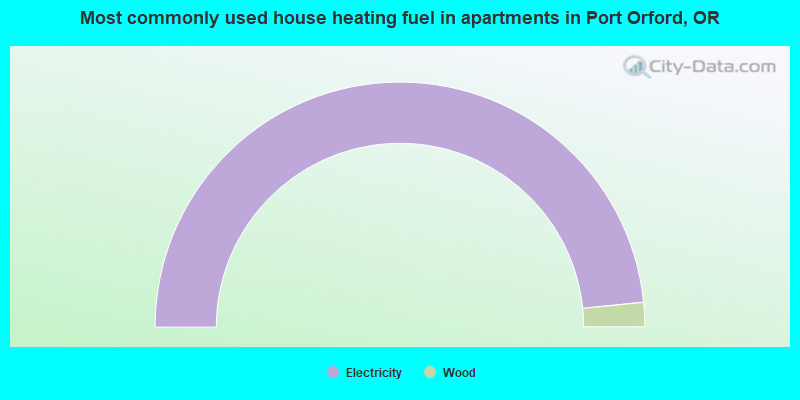
- 96.8%Electricity
- 3.2%Wood
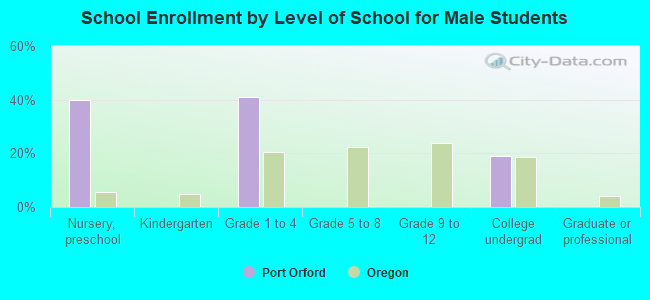
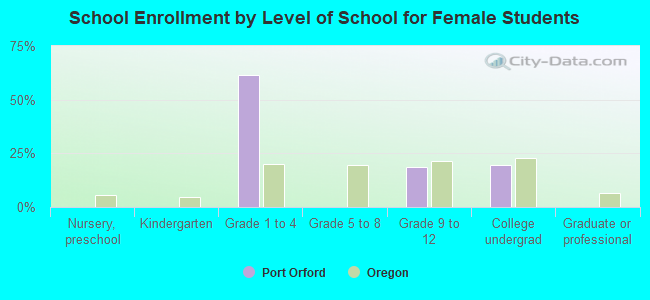
Private vs. public school enrollment:
| Here: | 0.0% |
| Oregon: | 13.7% |
| Here: | 0.0% |
| Oregon: | 8.8% |
| Here: | 0.0% |
| Oregon: | 17.7% |