Port Orange, FL (Florida) Houses and Residents
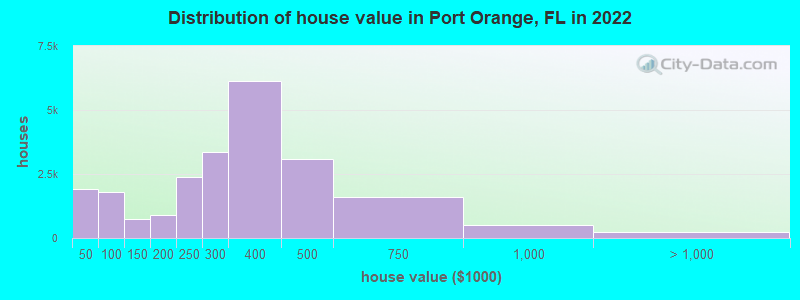
Estimated median house or condo value in 2022: $321,059 (it was $87,100 in 2000 )
Port Orange:
$321,059Florida:
$354,100
Lower value quartile - upper value quartile: $212,878 - $426,206Total population: 58,742 (Urban population: 43,482, Rural population: 1,888 (all nonfarm) )
Houses: 32,025 (28,711 occupied: 21,296 owner occupied, 7,661 renter occupied )
% of renters here:
26%State:
33%
Housing density: 1,296 houses/condos per square mile
Median price asked for vacant for-sale houses and condos in 2022: $171,222.
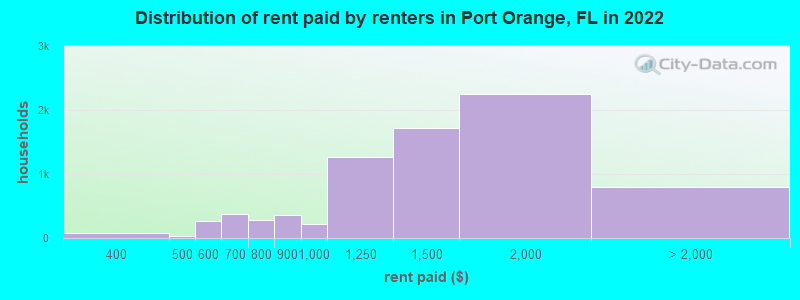
Median contract rent in 2022: $1,384 (lower quartile is $967, upper quartile is $1,727)
Median rent asked for vacant for-rent units in 2022: $1,215
Median gross rent in Port Orange, FL in 2022: $1,506
Housing units in Port Orange with a mortgage: 11,149 (639 second mortgage, 21 home equity loan, 394 both second mortgage and home equity loan )Houses without a mortgage: 442
Median household income for houses/condos with a mortgage: $89,898
Median household income for apartments without a mortgage: $59,344
Median monthly housing costs: $1,175
Data:
Median house or condo value ($)
Median house or condo value ($ change since 2000)
Median house or condo value ($) - White
Median house or condo value ($) - Black or African American
Median house or condo value ($) - Asian
Median house or condo value ($) - Hispanic or Latino
Median house or condo value ($) - American Indian and Alaska Native
Median house or condo value ($) - Multirace
Median house or condo value ($) - Other Race
Median price asked for mobile homes ($)
Household density (households per square mile)
Mean house or condo value by units in structure - 1, detached ($)
Mean house or condo value by units in structure - 1, attached ($)
Mean house or condo value by units in structure - 2 ($)
Mean house or condo value by units in structure by units in structure - 3 or 4 ($)
Mean house or condo value by units in structure - 5 or more ($)
Mean house or condo value by units in structure - Boat, RV, van, etc. ($)
Mean house or condo value by units in structure - Mobile home ($)
Median contract rent ($)
Median contract rent - Lower quartile ($)
Median contract rent - Upper quartile ($)
Median gross rent ($)
Urban houses (%)
Rural houses (%)
Houses occupied (%)
Houses occupied (% change since 2000)
Houses owner occupied (%)
Houses owner occupied (% change since 2000)
Houses renter occupied (%)
Houses renter occupied (% change since 2000)
Vacant housing units - For rent (%)
Vacant housing units - For rent (% change since 2000)
Vacant housing units - For sale only (%)
Vacant housing units - For sale only (% change since 2000)
Vacant housing units - Rented or sold, not occupied (%)
Vacant housing units - Rented or sold, not occupied (% change since 2000)
Vacant housing units - For seasonal, recreational, or occasional use (%)
Vacant housing units - For seasonal, recreational, or occasional use (% change since 2000)
Vacant housing units - For migrant workers (%)
Vacant housing units - For migrant workers (% change since 2000)
Vacant housing units - Other vacant (%)
Vacant housing units - Other vacant (% change since 2000)
Median monthly housing costs ($)
Median household income for houses/condos with a mortgage ($)
Median household income for houses/condos without a mortgage ($)
Median household income ($)
Median household income ($) - White
Median household income ($) - Black or African American
Median household income ($) - Asian
Median household income ($) - Hispanic or Latino
Median household income ($) - American Indian and Alaska Native
Median household income ($) - Multirace
Median household income ($) - Other Race
Mortgage status - with mortgage (%)
Mortgage status - with second mortgage (%)
Mortgage status - with home equity loan (%)
Mortgage status - with both second mortgage and home equity loan (%)
Mortgage status - without a mortgage (%)
Median year house/condo built
Median year apartment built
Household type by relationship - Male householder living alone (%)
Household type by relationship - Male householder not living alone (%)
Household type by relationship - Female householder living alone (%)
Household type by relationship - Female householder not living alone (%)
Household type by relationship - Opposite-Sex spouse (%)
Household type by relationship - Same-Sex spouse (%)
Household type by relationship - Opposite-Sex unmarried partner (%)
Household type by relationship - Same-Sex unmarried partner (%)
Household type by relationship - In group quarters (%)
Size of family households - 2-person household (%)
Size of family households - 3-person household (%)
Size of family households - 4-person household (%)
Size of family households - 5-person household (%)
Size of family households - 6-person household (%)
Size of family households - 7-or-more-person household (%)
Size of nonfamily households - 1-person household (%)
Size of nonfamily households - 2-person household (%)
Size of nonfamily households - 3-person household (%)
Size of nonfamily households - 4-person household (%)
Size of nonfamily households - 5-person household (%)
Size of nonfamily households - 6-person household (%)
Size of nonfamily households - 7-or-moreperson household (%)
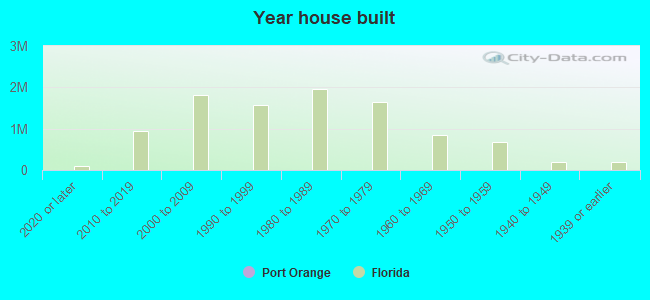
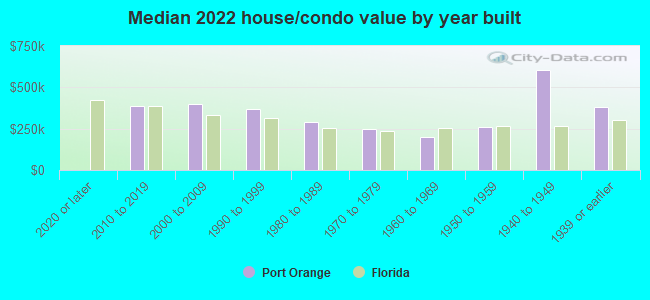
Year house built - Built 2010 or later (%)
Year house built - Built 2000 to 2009 (%)
Year house built - Built 1990 to 1999 (%)
Year house built - Built 1980 to 1989 (%)
Year house built - Built 1970 to 1979 (%)
Year house built - Built 1960 to 1969 (%)
Year house built - Built 1950 to 1959 (%)
Year house built - Built 1940 to 1949 (%)
Year house built - Built 1939 or earlier (%)
Median number of rooms in houses and condos
Median number of rooms in apartments
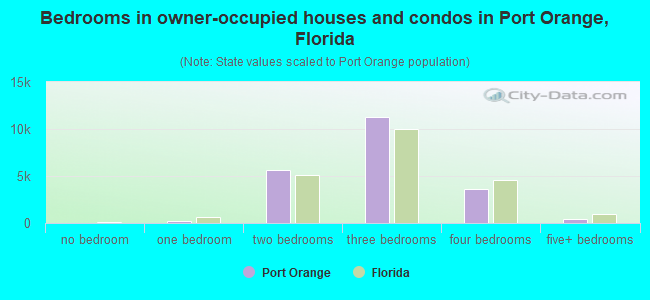
Median number of bedrooms in owner occupied houses
Mean number of bedrooms in owner occupied houses
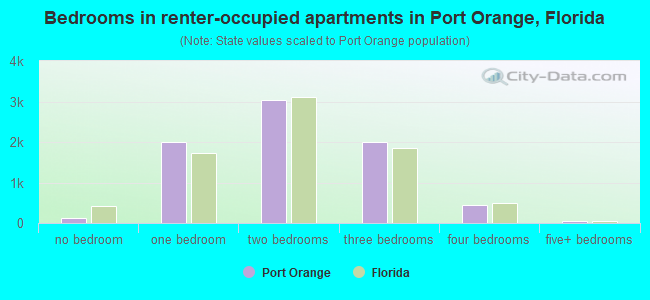
Median number of bedrooms in renter occupied houses
Mean number of bedrooms in renter occupied houses
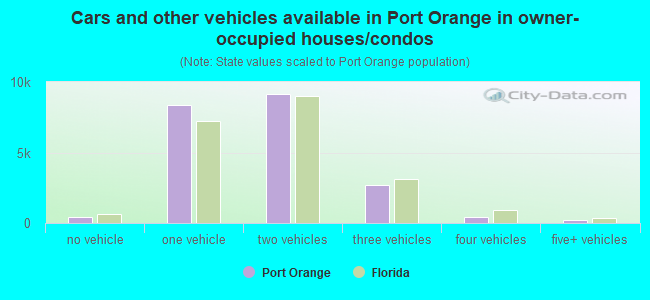
Median number of vehichles in owner occupied houses
Mean number of vehichles in owner occupied houses
Median number of vehichles in renter occupied houses
Mean number of vehichles in renter occupied houses
Rooms in owner-occupied houses - 1 room (%)
Rooms in owner-occupied houses - 2 rooms (%)
Rooms in owner-occupied houses - 3 rooms (%)
Rooms in owner-occupied houses - 4 rooms (%)
Rooms in owner-occupied houses - 5 rooms (%)
Rooms in owner-occupied houses - 6 rooms (%)
Rooms in owner-occupied houses - 7 rooms (%)
Rooms in owner-occupied houses - 8 rooms (%)
Rooms in owner-occupied houses - 9+ rooms (%)
Rooms in renter-occupied houses - 1 room (%)
Rooms in renter-occupied houses - 2 rooms (%)
Rooms in renter-occupied houses - 3 rooms (%)
Rooms in renter-occupied houses - 4 rooms (%)
Rooms in renter-occupied houses - 5 rooms (%)
Rooms in renter-occupied houses - 6 rooms (%)
Rooms in renter-occupied houses - 7 rooms (%)
Rooms in renter-occupied houses - 8 rooms (%)
Rooms in renter-occupied houses - 9+ rooms (%)
Bedrooms in owner-occupied houses - no bedrooms (%)
Bedrooms in owner-occupied houses - 1 bedroom (%)
Bedrooms in owner-occupied houses - 2 bedrooms (%)
Bedrooms in owner-occupied houses - 3 bedrooms (%)
Bedrooms in owner-occupied houses - 4 bedrooms (%)
Bedrooms in owner-occupied houses - 5+ bedrooms (%)
Bedrooms in renter-occupied houses - no bedrooms (%)
Bedrooms in renter-occupied houses - 1 bedroom (%)
Bedrooms in renter-occupied houses - 2 bedrooms (%)
Bedrooms in renter-occupied houses - 3 bedrooms (%)
Bedrooms in renter-occupied houses - 4 bedrooms (%)
Bedrooms in renter-occupied houses - 5+ bedrooms (%)
Vehicles available in owner-occupied houses - no vehicle available (%)
Vehicles available in owner-occupied houses - 1 vehicle available(%)
Vehicles available in owner-occupied houses - 2 Vehicles available (%)
Vehicles available in owner-occupied houses - 3 Vehicles available (%)
Vehicles available in owner-occupied houses - 4 Vehicles available (%)
Vehicles available in owner-occupied houses - 5+ Vehicles available (%)
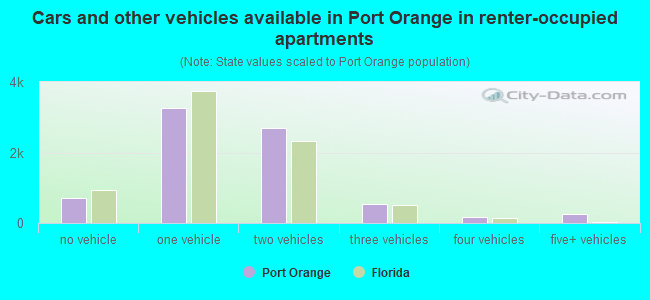
Vehicles available in renter-occupied houses - no vehicle available (%)
Vehicles available in renter-occupied houses - 1 vehicle available (%)
Vehicles available in renter-occupied houses - 2 Vehicles available (%)
Vehicles available in renter-occupied houses - 3 Vehicles available (%)
Vehicles available in renter-occupied houses - 4 Vehicles available (%)
Vehicles available in renter-occupied houses - 5+ Vehicles available (%)
Housing units in structures - 1, detached (%)
Housing units in structures - 1, attached (%)
Housing units in structures - 2 (%)
Housing units in structures - 3 or 4 (%)
Housing units in structures - 5 to 9 (%)
Housing units in structures - 10 to 19 (%)
Housing units in structures - 20 to 49 (%)
Housing units in structures - 50 or more (%)
Housing units in structures - Mobile home (%)
Housing units in structures - Boat, RV, van, etc. (%)
Housing units in structures - Owners - 1, detached (%)
Housing units in structures - Owners - 1, attached (%)
Housing units in structures - Owners - 2 (%)
Housing units in structures - Owners - 3 or 4 (%)
Housing units in structures - Owners - 5 to 9 (%)
Housing units in structures - Owners - 10 to 19 (%)
Housing units in structures - Owners - 20 to 49 (%)
Housing units in structures - Owners - 50 or more (%)
Housing units in structures - Owners - Mobile home (%)
Housing units in structures - Owners - Boat, RV, van, etc. (%)
Housing units in structures - Renters - 1, detached (%)
Housing units in structures - Renters - 1, attached (%)
Housing units in structures - Renters - 2 (%)
Housing units in structures - Renters - 3 or 4 (%)
Housing units in structures - Renters - 5 to 9 (%)
Housing units in structures - Renters - 10 to 19 (%)
Housing units in structures - Renters - 20 to 49 (%)
Housing units in structures - Renters - 50 or more (%)
Housing units in structures - Renters - Mobile home (%)
Housing units in structures - Renters - Boat, RV, van, etc. (%)
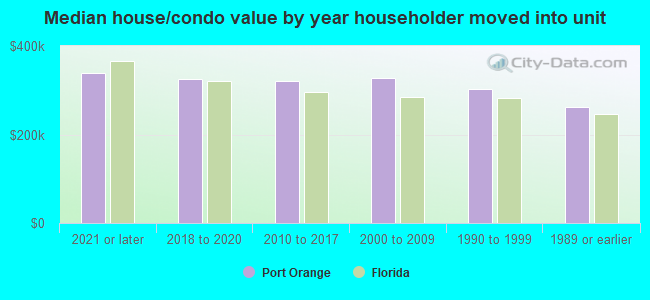
House/condo owner moved in on average (years ago)
Renter moved in on average (years ago)
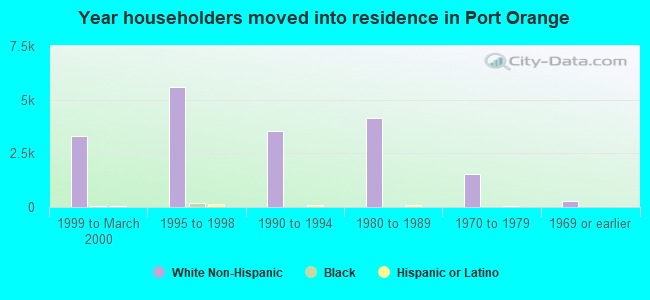
Year householder moved into unit - Moved in 1999 to March 2000 (%)
Year householder moved into unit - Moved in 1999 to March 2000 (%) - White
Year householder moved into unit - Moved in 1999 to March 2000 (%) - Black or African American
Year householder moved into unit - Moved in 1999 to March 2000 (%) - Asian
Year householder moved into unit - Moved in 1999 to March 2000 (%) - Hispanic or Latino
Year householder moved into unit - Moved in 1999 to March 2000 (%) - American Indian and Alaska Native
Year householder moved into unit - Moved in 1999 to March 2000 (%) - Multirace
Year householder moved into unit - Moved in 1999 to March 2000 (%) - Other Race
Year householder moved into unit - Moved in 1995 to 1998 (%)
Year householder moved into unit - Moved in 1995 to 1998 (%) - White
Year householder moved into unit - Moved in 1995 to 1998 (%) - Black or African American
Year householder moved into unit - Moved in 1995 to 1998 (%) - Asian
Year householder moved into unit - Moved in 1995 to 1998 (%) - Hispanic or Latino
Year householder moved into unit - Moved in 1995 to 1998 (%) - American Indian and Alaska Native
Year householder moved into unit - Moved in 1995 to 1998 (%) - Multirace
Year householder moved into unit - Moved in 1995 to 1998 (%) - Other Race
Year householder moved into unit - Moved in 1990 to 1994 (%)
Year householder moved into unit - Moved in 1990 to 1994 (%) - White
Year householder moved into unit - Moved in 1990 to 1994 (%) - Black or African American
Year householder moved into unit - Moved in 1990 to 1994 (%) - Asian
Year householder moved into unit - Moved in 1990 to 1994 (%) - Hispanic or Latino
Year householder moved into unit - Moved in 1990 to 1994 (%) - American Indian and Alaska Native
Year householder moved into unit - Moved in 1990 to 1994 (%) - Multirace
Year householder moved into unit - Moved in 1990 to 1994 (%) - Other Race
Year householder moved into unit - Moved in 1980 to 1989 (%)
Year householder moved into unit - Moved in 1980 to 1989 (%) - White
Year householder moved into unit - Moved in 1980 to 1989 (%) - Black or African American
Year householder moved into unit - Moved in 1980 to 1989 (%) - Asian
Year householder moved into unit - Moved in 1980 to 1989 (%) - Hispanic or Latino
Year householder moved into unit - Moved in 1980 to 1989 (%) - American Indian and Alaska Native
Year householder moved into unit - Moved in 1980 to 1989 (%) - Multirace
Year householder moved into unit - Moved in 1980 to 1989 (%) - Other Race
Year householder moved into unit - Moved in 1970 to 1979 (%)
Year householder moved into unit - Moved in 1970 to 1979 (%) - White
Year householder moved into unit - Moved in 1970 to 1979 (%) - Black or African American
Year householder moved into unit - Moved in 1970 to 1979 (%) - Asian
Year householder moved into unit - Moved in 1970 to 1979 (%) - Hispanic or Latino
Year householder moved into unit - Moved in 1970 to 1979 (%) - American Indian and Alaska Native
Year householder moved into unit - Moved in 1970 to 1979 (%) - Multirace
Year householder moved into unit - Moved in 1970 to 1979 (%) - Other Race
Year householder moved into unit - Moved in 1969 or earlier (%)
Year householder moved into unit - Moved in 1969 or earlier (%) - White
Year householder moved into unit - Moved in 1969 or earlier (%) - Black or African American
Year householder moved into unit - Moved in 1969 or earlier (%) - Asian
Year householder moved into unit - Moved in 1969 or earlier (%) - Hispanic or Latino
Year householder moved into unit - Moved in 1969 or earlier (%) - American Indian and Alaska Native
Year householder moved into unit - Moved in 1969 or earlier (%) - Multirace
Year householder moved into unit - Moved in 1969 or earlier (%) - Other Race
Housing units lacking complete plumbing facilities (%)
Housing units lacking complete kitchen facilities (%)
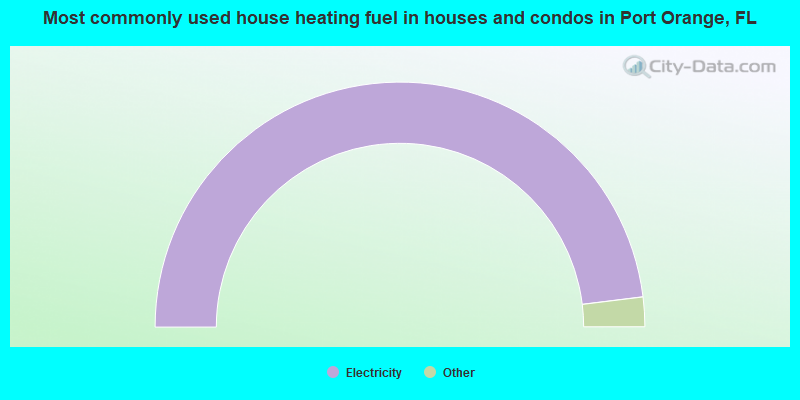
House heating fuel used in houses and condos - Utility gas (%)
House heating fuel used in houses and condos - Bottled, tank, or LP gas (%)
House heating fuel used in houses and condos - Electricity (%)
House heating fuel used in houses and condos - Fuel oil, kerosene, etc. (%)
House heating fuel used in houses and condos - Coal or coke (%)
House heating fuel used in houses and condos - Wood (%)
House heating fuel used in houses and condos - Solar energy (%)
House heating fuel used in houses and condos - Other fuel (%)
House heating fuel used in houses and condos - No fuel used (%)
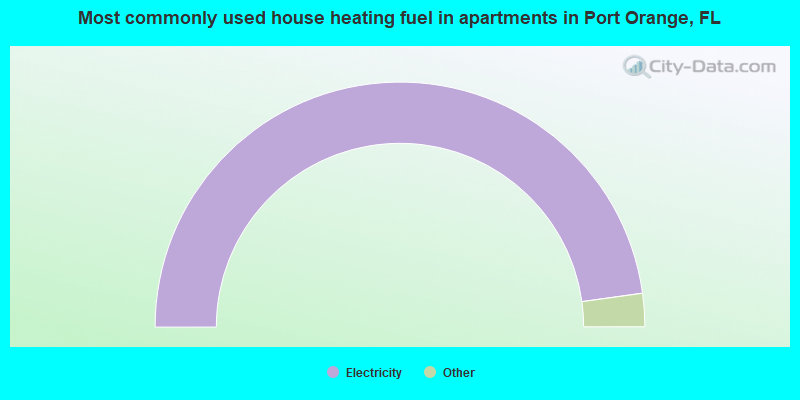
House heating fuel used in apartments - Utility gas (%)
House heating fuel used in apartments - Bottled, tank, or LP gas (%)
House heating fuel used in apartments - Electricity (%)
House heating fuel used in apartments - Fuel oil, kerosene, etc. (%)
House heating fuel used in apartments - Coal or coke (%)
House heating fuel used in apartments - Wood (%)
House heating fuel used in apartments - Solar energy (%)
House heating fuel used in apartments - Other fuel (%)
House heating fuel used in apartments - No fuel used (%)
Median year house/condo built: 1988Median year apartment built: 1994Household type by relationship:
Households: 65,175
Male householders: 15,055 (3,676 living alone ), Female householders: 13,832 (5,277 living alone )12,670 spouses (12,564 opposite-sex spouses ), 2,886 unmarried partners , (2,802 opposite-sex unmarried partners ), 14,755 children (13,647 natural , 200 adopted , 908 stepchildren ), 1,103 grandchildren , 452 brothers or sisters , 625 parents , 509 foster children , 492 other relatives , 2,520 non-relatives In group quarters: 271
Size of family households: 9,238 2-persons , 4,062 3-persons , 2,095 4-persons , 1,191 5-persons , 281 6-persons , 71 7-or-more-persons .
Size of nonfamily households: 9,108 1-person , 2,218 2-persons , 429 3-persons , 37 4-persons , 85 5-persons .
6,114 married couples with children. single-parent households (1,591 men , 2,189 women ).
90.8% of residents of Port Orange speak English at home. of residents speak Spanish at home (80% speak English very well , 10% speak English well , 9% speak English not well , 1% don't speak English at all ).of residents speak other Indo-European language at home (71% speak English very well , 10% speak English well , 19% speak English not well ).of residents speak Asian or Pacific Island language at home (54% speak English very well , 22% speak English well , 18% speak English not well , 6% don't speak English at all ).of residents speak other language at home (79% speak English very well , 14% speak English well , 7% speak English not well ).
Foreign born population: 4,979 (7.6%)of them are naturalized citizens )
Median number of rooms in houses and condos:
Median number of rooms in apartments
Owner-occupied Renter-occupied
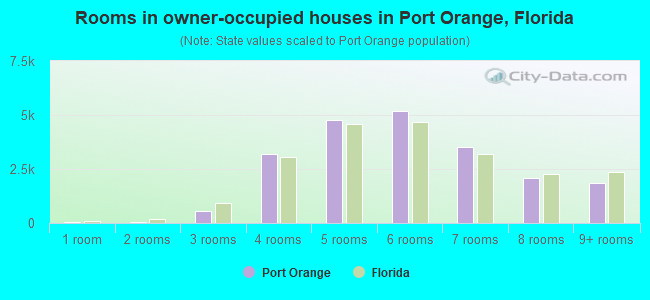
Rooms in owner-occupied houses in Port Orange, Florida
29 1 room 64 2 rooms 576 3 rooms 3,175 4 rooms 4,774 5 rooms 5,201 6 rooms 3,525 7 rooms 2,085 8 rooms 1,868 9+ rooms
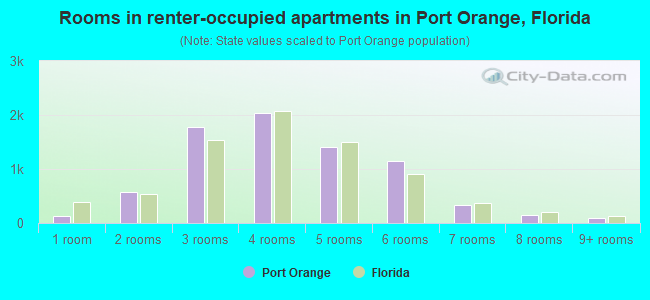
Rooms in renter-occupied apartments in Port Orange, Florida
134 1 room 583 2 rooms 1,786 3 rooms 2,033 4 rooms 1,402 5 rooms 1,148 6 rooms 342 7 rooms 141 8 rooms 91 9+ rooms
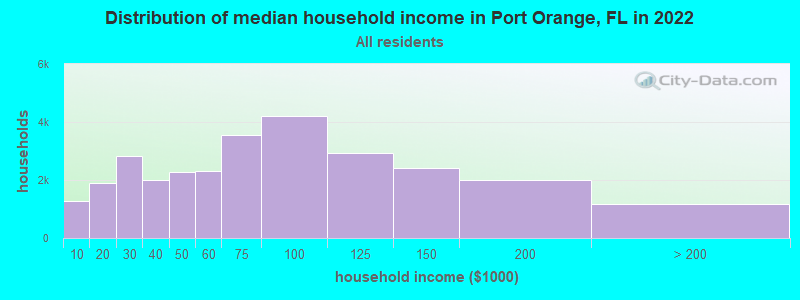
Port Orange, FL household income distribution 1,286 Less than $10,0001,891 $10,000 to $19,9992,830 $20,000 to $29,9991,993 $30,000 to $39,9992,270 $40,000 to $49,9992,302 $50,000 to $59,9993,557 $60,000 to $74,9994,199 $75,000 to $99,9992,943 $100,000 to $124,9992,415 $125,000 to $149,9992,006 $150,000 to $199,9991,189 $200,000 or more
Home value of owner - occupied houses in 2022 in Port Orange, FL 342 Less than $10,000350 $10,000 to $14,999294 $15,000 to $19,999248 $20,000 to $24,999157 $25,000 to $29,999126 $30,000 to $34,999178 $35,000 to $39,999235 $40,000 to $49,999670 $50,000 to $59,999261 $60,000 to $69,999252 $70,000 to $79,999247 $80,000 to $89,999147 $90,000 to $99,999506 $100,000 to $124,999222 $125,000 to $149,999377 $150,000 to $174,999523 $175,000 to $199,9992,396 $200,000 to $249,9993,377 $250,000 to $299,9996,147 $300,000 to $399,9993,093 $400,000 to $499,9991,591 $500,000 to $749,999514 $750,000 to $999,99990 $1,000,000 to $1,499,99977 $1,500,000 to $1,999,99950 $2,000,000 or moreRent paid by renters in 2022 in Port Orange, FL 72 $300 to $34912 $400 to $44922 $450 to $499170 $500 to $54991 $550 to $599125 $600 to $649252 $650 to $699147 $700 to $749126 $750 to $799353 $800 to $899214 $900 to $9991,263 $1,000 to $1,2491,726 $1,250 to $1,4992,249 $1,500 to $1,999447 $2,000 to $2,49941 $2,500 to $2,999301 No cash rent
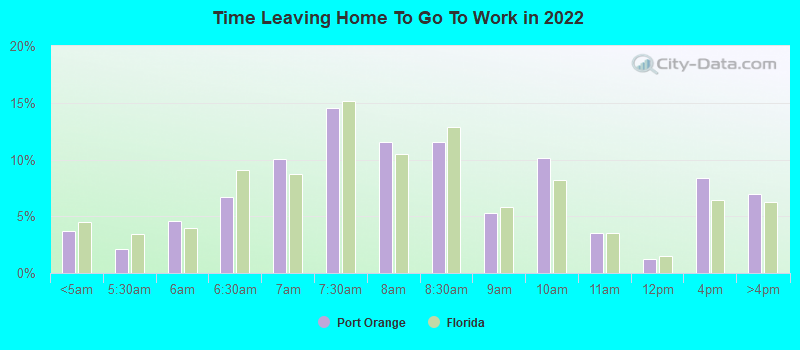
Percentage of workers working in this county: 92.6%Number of people working at home: 4,252 (13.9% of all workers )
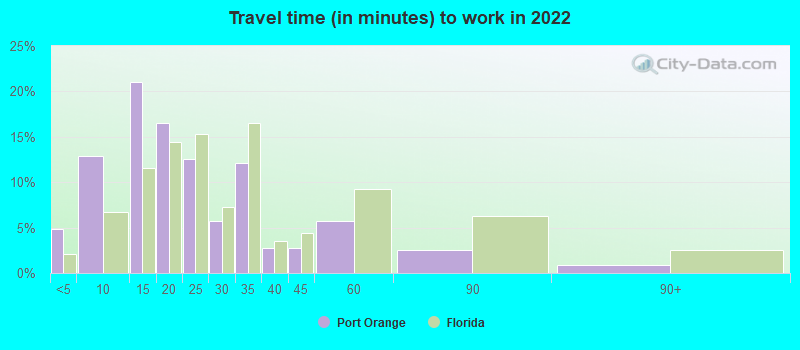
Travel time to work (commute)
Less than 5 minutes: 9515 to 9 minutes: 2,33610 to 14 minutes: 4,05315 to 19 minutes: 5,21820 to 24 minutes: 3,90425 to 29 minutes: 2,22530 to 34 minutes: 3,00835 to 39 minutes: 60140 to 44 minutes: 53045 to 59 minutes: 1,28260 to 89 minutes: 81090 or more minutes: 779
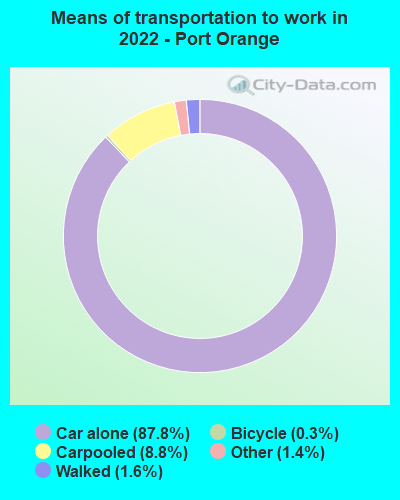
Means of transportation to work:
Drove a car alone: 15,459 (70.9%)Carpooled: 1,709 (7.8%)Bus : 10 (0.0%)Taxi: 243 (1.1%)Bicycle: 47 (0.2%)Walked: 259 (1.2%)Worked at home: 4,252 (19.5%)
Unemployment by race in 2022
Unemployment rate for White non-Hispanic residents 3.1% Males2.9% FemalesUnemployment rate for Black residents 4.4% Males3.4% FemalesUnemployment rate for American Indian and Alaska Native residents 20.6% FemalesUnemployment rate for Asian residents 6.0% Males10.5% FemalesUnemployment rate for other race residents 14.5% FemalesUnemployment rate for two or more race residents 5.0% Males15.0% FemalesUnemployment rate for Hispanic or Latino residents 2.9% Males7.7% Females
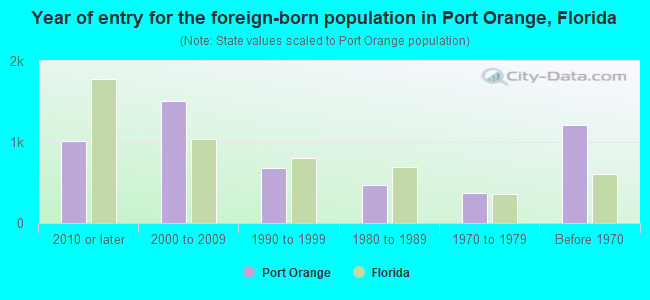
Year of entry for the foreign-born population in Port Orange, Florida
1,018 2010 or later 1,512 2000 to 2009 676 1990 to 1999 472 1980 to 1989 369 1970 to 1979 1,213 Before 1970
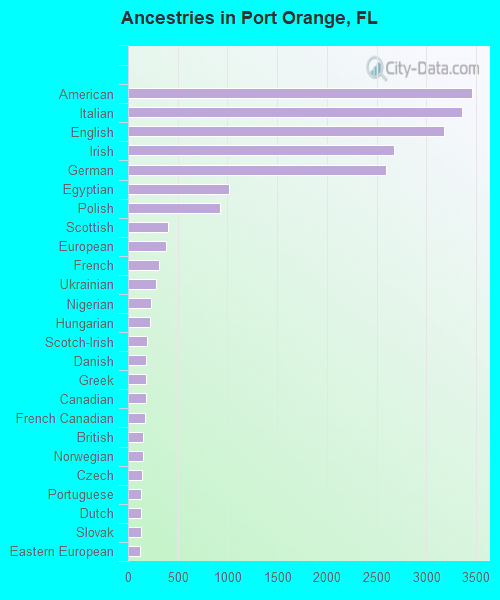
First ancestries reported:
American: 3,458 (11.2%)
Italian: 3,360 (10.8%)
English: 3,176 (10.3%)
Irish: 2,678 (8.6%)
German: 2,593 (8.4%)
Egyptian: 1,014 (3.3%)
Polish: 924 (3.0%)
Scottish: 400 (1.3%)
European: 386 (1.2%)
French: 308 (1.0%)
Ukrainian: 286 (0.9%)
Nigerian: 227 (0.7%)
Hungarian: 218 (0.7%)
Scotch-Irish: 195 (0.6%)
Danish: 185 (0.6%)
Greek: 180 (0.6%)
Canadian: 180 (0.6%)
French Canadian: 174 (0.6%)
British: 152 (0.5%)
Norwegian: 151 (0.5%)
Czech: 145 (0.5%)
Portuguese: 133 (0.4%)
Dutch: 132 (0.4%)
Slovak: 129 (0.4%)
Eastern European: 120 (0.4%)
African: 118 (0.4%)
Welsh: 99 (0.3%)
Jamaican: 96 (0.3%)
Scandinavian: 76 (0.2%)
Russian: 69 (0.2%)
Swedish: 67 (0.2%)
Iranian: 59 (0.2%)
Swiss: 55 (0.2%)
West Indian: 52 (0.2%)
Trinidadian and Tobagonian: 50 (0.2%)
Austrian: 48 (0.2%)
Croatian: 42 (0.1%)
Moroccan: 37 (0.1%)
Lithuanian: 35 (0.1%)
Slovene: 30 (0.10%)
Israeli: 28 (0.09%)
Australian: 26 (0.08%)
Finnish: 16 (0.05%)
Pennsylvania German: 12 (0.04%)
Czechoslovakian: 12 (0.04%)
Lebanese: 11 (0.04%)
Brazilian: 10 (0.03%)
Slavic: 9 (0.03%)
Yugoslavian: 9 (0.03%)
Arab: 8 (0.03%)
Ethiopian: 8 (0.03%)
Belgian: 7 (0.02%)
Northern European: 6 (0.02%)
Most common places of birth for foreign-born residents (%): Egypt Port Orange:
19.2% (1,031)Florida:
0.3% (13,998)
Canada Port Orange:
5.4% (291)Florida:
2.4% (109,132)
Germany Port Orange:
4.6% (249)Florida:
1.2% (54,272)
China, excluding Hong Kong and Taiwan Port Orange:
4.2% (227)Florida:
1.2% (56,071)
Ukraine Port Orange:
4.2% (225)Florida:
0.5% (21,886)
Vietnam Port Orange:
3.9% (211)Florida:
1.3% (60,604)
Korea Port Orange:
3.6% (196)Florida:
0.4% (19,445)
Hungary Port Orange:
3.6% (195)Florida:
0.2% (9,122)
Romania Port Orange:
3.5% (189)Florida:
0.3% (14,943)
England Port Orange:
3.4% (181)Florida:
0.8% (37,723)
Nigeria Port Orange:
3.3% (180)Florida:
0.2% (10,443)
Philippines Port Orange:
3.2% (171)Florida:
1.8% (84,403)
Mexico Port Orange:
2.9% (155)Florida:
5.6% (257,152)
United Kingdom, excluding England and Scotland Port Orange:
2.8% (152)Florida:
0.7% (34,227)
Dominican Republic Port Orange:
2.8% (148)Florida:
3.0% (137,727)
Taiwan Port Orange:
2.4% (130)Florida:
0.2% (8,002)
Peru Port Orange:
2.1% (115)Florida:
2.1% (96,693)
Trinidad and Tobago Port Orange:
2.0% (110)Florida:
1.0% (43,642)
Cuba Port Orange:
1.7% (93)Florida:
22.0% (1,006,576)
Poland Port Orange:
1.7% (89)Florida:
0.6% (25,219)
Jamaica Port Orange:
1.6% (88)Florida:
5.0% (227,319)
Cameroon Port Orange:
1.6% (85)Florida:
0.0% (1,288)
Colombia Port Orange:
1.5% (83)Florida:
6.5% (298,669)
Guyana Port Orange:
1.5% (82)Florida:
0.7% (33,556)
Place of birth for U.S.-born residents:
This state: 19,746Other state: 39,092Northeast: 17,557Midwest: 10,687South: 8,351West: 2,548 87.8% of Port Orange residents lived in the same house 1 years ago.
Out of people who lived in different houses, 32.7% lived in this county.
Out of people who lived in different counties, 37.0% lived in Florida.
Port Orange:
87.8%State average:
86.3%
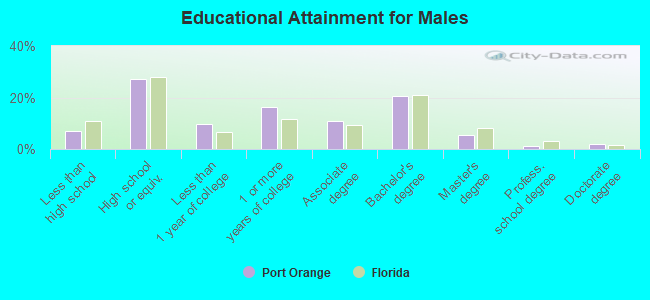
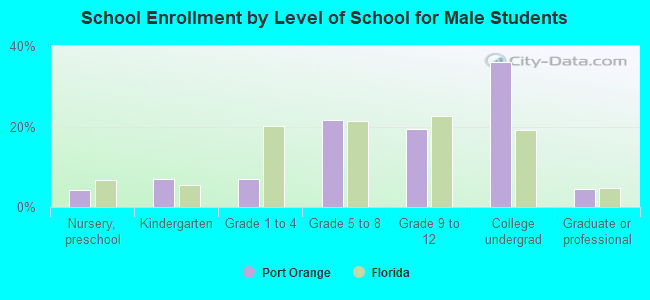
Education attainment for males 25 years and older:
No schooling: 135Nursery to 4th grade: 1725th and 6th grade: 717th and 8th grade: 1159th grade: 21310th grade: 16811th grade: 41412th grade, no diploma: 359High school graduate (or equivalency): 6,317Less than 1 year of college: 2,262Some college more than 1 year, no degree: 3,786Associate degree: 2,561Bachelor's degree: 4,807Master's degree: 1,287Professional school degree: 230Doctorate degree: 448
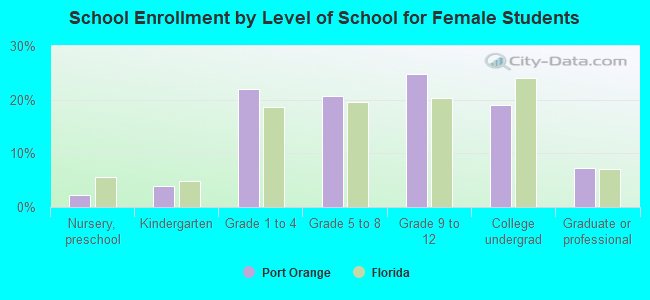
Education attainment for females 25 years and older:
No schooling: 190Nursery to 4th grade: 65th and 6th grade: 957th and 8th grade: 2329th grade: 5910th grade: 23011th grade: 28012th grade, no diploma: 257High school graduate (or equivalency): 6,819Less than 1 year of college: 2,406Some college more than 1 year, no degree: 3,029Associate degree: 3,616Bachelor's degree: 4,648Master's degree: 2,309Professional school degree: 883Doctorate degree: 268
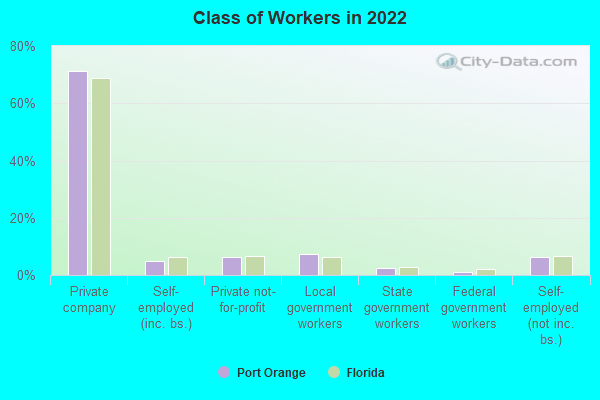
Housing units in structures:
One, detached: 20,112One, attached: 1,349Two: 5073 or 4: 8475 to 9: 1,59010 to 19: 1,03020 to 49: 65250 or more: 899Mobile homes: 5,025Boats, RVs, vans, etc.: 10Median worth of mobile homes: $59,062
Housing units lacking complete plumbing facilities in 2022: 0.1%Housing units lacking complete kitchen facilities in 2022: 0.6%House/condo owner moved in on average 9 years ago
Renter moved in on average 1 years ago
Private vs. public school enrollment:
Students in private schools in grades 1 to 8 (elementary and middle school): 659 Students in private schools in grades 9 to 12 (high school): 161 Students in private undergraduate colleges: 1,913