Port Monmouth, NJ (New Jersey) Houses and Residents
| Port Monmouth: | $448,955 |
| New Jersey: | $428,900 |
Total population: 3,818 (Urban population: 3,655, Rural population: 0)
Houses: 1,420 (1,309 occupied: 1,043 owner occupied, 289 renter occupied)
| % of renters here: | 22% |
| State: | 35% |
Housing density: 1,075 houses/condos per square mile
Median price asked for vacant for-sale houses and condos in 2022: $608,910.
Median contract rent in 2022: $1,087 (lower quartile is $1,006, upper quartile is $1,197)
Median rent asked for vacant for-rent units in 2022: $1,510
Median gross rent in Port Monmouth, NJ in 2022: $1,135
Housing units in Port Monmouth with a mortgage: 742 (140 second mortgage, 0 home equity loan, 138 both second mortgage and home equity loan)
Houses without a mortgage: 23
Median household income for houses/condos with a mortgage: $132,376
Median household income for apartments without a mortgage: $109,399
Median monthly housing costs: $1,697
Compare current foreclosures near Port Monmouth, NJ:
| Photo | Address | Area | Beds / Baths | Price | Details |
|---|---|---|---|---|---|

|
#1
Illinois Ave
Port Monmouth, NJ 07758
|
- sq. feet
|
- baths - beds |
show details | |

|
#2
Main St
Port Monmouth, NJ 07758
|
1,584 sq. feet
|
- baths - beds |
show details | |

|
#3
Collins Ave
Port Monmouth, NJ 07758
|
1,456 sq. feet
|
- baths - beds |
show details | |

|
#4
Collins Ave
Port Monmouth, NJ 07758
|
1,084 sq. feet
|
- baths - beds |
show details | |

|
#5
Shadyside Pl
Port Monmouth, NJ 07758
|
1,276 sq. feet
|
- baths - beds |
show details | |

|
#6
Main St
Port Monmouth, NJ 07758
|
1,532 sq. feet
|
- baths - beds |
show details | |

|
#7
Sunset Ave
Port Monmouth, NJ 07758
|
2,480 sq. feet
|
- baths - beds |
show details | |

|
#8
Hudson Ave
Port Monmouth, NJ 07758
|
1,016 sq. feet
|
- baths - beds |
show details | |

|
#9
Creek Rd
Port Monmouth, NJ 07758
|
2,838 sq. feet
|
- baths - beds |
show details | |

|
#10
Pinehurst Ave
Port Monmouth, NJ 07758
|
2,364 sq. feet
|
- baths - beds |
show details |
| Photo | Address | Area | Beds / Baths | Price | Details |
|---|---|---|---|---|---|

|
#11
Warren Street
Keyport, NJ 07735
|
2,889 sq. feet
|
2 baths 7 beds |
$459,900
|
show details |

|
#12
Bay 19th St
Brooklyn, NY 11214
|
880 sq. feet
|
1 baths 2 beds |
$425,000
|
show details |

|
#13
Sharon Garden Ct
Woodbridge, NJ 07095
|
1,000 sq. feet
|
2 baths 2 beds |
$455,000
|
show details |

|
#14
Henry St
Keyport, NJ 07735
|
800 sq. feet
|
1 baths 2 beds |
$219,350
|
show details |

|
#15
E 32nd St Apt C7
Brooklyn, NY 11210
|
670 sq. feet
|
1 baths 1 beds |
$299,900
|
show details |

|
#16
Russell St # G
Staten Island, NY 10308
|
642 sq. feet
|
1 baths 1 beds |
$185,000
|
show details |

|
#17
Florence Ave
Colonia, NJ 07067
|
1,930 sq. feet
|
2 baths 3 beds |
$599,900
|
show details |

|
#18
Catherine St
South Amboy, NJ 08879
|
2,266 sq. feet
|
3 baths 4 beds |
$351,900
|
show details |

|
#19
Prospect Park SW 8
Brooklyn, NY 11218
|
- sq. feet
|
1 baths 1 beds |
$719,900
|
show details |

|
#20
E 34th St
Brooklyn, NY 11203
|
- sq. feet
|
1 baths 3 beds |
$464,900
|
show details |
| Photo | Address | Area | Beds / Baths | Price | Details |
|---|---|---|---|---|---|

|
#21
Richmond Rd
Staten Island, NY 10304
|
- sq. feet
|
1 baths 3 beds |
$634,400
|
show details |

|
#22
New Ln Apt 6l
Staten Island, NY 10305
|
- sq. feet
|
1 baths 1 beds |
$284,900
|
show details |

|
#23
Ocean Pkwy Apt 11k
Brooklyn, NY 11235
|
400 sq. feet
|
1 baths - beds |
$205,000
|
show details |

|
#24
Willow Rd W
Staten Island, NY 10314
|
- sq. feet
|
1 baths 3 beds |
$491,400
|
show details |

|
#25
Crawford Street
Red Bank, NJ 07701
|
1,280 sq. feet
|
1 baths 2 beds |
show details | |

|
#26
Shore Pkwy Apt 15a
Brooklyn, NY 11214
|
995 sq. feet
|
1 baths 2 beds |
show details | |

|
#27
-11 Spring St
Red Bank, NJ 07701
|
1,096 sq. feet
|
1 baths 2 beds |
show details | |

|
#28
Bromley Pl
East Brunswick, NJ 08816
|
1,200 sq. feet
|
2 baths 2 beds |
show details | |

|
#29
Athens Ave
South Amboy, NJ 08879
|
1,790 sq. feet
|
2 baths 3 beds |
show details | |

|
#30
E 34th St
Brooklyn, NY 11210
|
1,380 sq. feet
|
1 baths 3 beds |
show details |
| Photo | Address | Area | Beds / Baths | Price | Details |
|---|---|---|---|---|---|

|
#31
Morning Dew Ct
Old Bridge, NJ 08857
|
1,793 sq. feet
|
2 baths 3 beds |
show details | |

|
#32
Egan Ct
Bayonne, NJ 07002
|
1,566 sq. feet
|
2 baths 3 beds |
show details | |

|
#33
Ovington Ave
Brooklyn, NY 11209
|
2,664 sq. feet
|
2 baths 6 beds |
show details | |

|
#34
Seymour Ave
Linden, NJ 07036
|
768 sq. feet
|
1 baths 3 beds |
show details | |

|
#35
Morningside Ave
Keyport, NJ 07735
|
1,228 sq. feet
|
2 baths 3 beds |
show details | |

|
#36
Drummond Ave
Neptune, NJ 07753
|
928 sq. feet
|
1 baths 2 beds |
show details | |

|
#37
Tompkins Ct
Staten Island, NY 10310
|
1,890 sq. feet
|
1 baths 3 beds |
show details | |

|
#38
Dock St
Keyport, NJ 07735
|
1,362 sq. feet
|
2 baths 3 beds |
show details | |

|
#39
E 4th St
Bayonne, NJ 07002
|
2,168 sq. feet
|
3 baths 5 beds |
show details | |

|
#40
Arthur Kill Rd
Staten Island, NY 10307
|
1,800 sq. feet
|
3 baths 3 beds |
show details |
| Photo | Address | Area | Beds / Baths | Price | Details |
|---|---|---|---|---|---|

|
#41
Amboy Rd
Staten Island, NY 10308
|
2,670 sq. feet
|
2 baths 2 beds |
show details | |

|
#42
Maurice Ave
Holmdel, NJ 07733
|
1,296 sq. feet
|
2 baths 3 beds |
show details | |

|
#43
W 28th St
Bayonne, NJ 07002
|
2,860 sq. feet
|
2 baths 7 beds |
show details | |

|
#44
Irving St
Carteret, NJ 07008
|
1,110 sq. feet
|
1 baths 3 beds |
show details | |

|
#45
E 54th St
Brooklyn, NY 11234
|
2,430 sq. feet
|
2 baths 5 beds |
show details | |

|
#46
6th Ave
Brooklyn, NY 11209
|
2,080 sq. feet
|
2 baths 4 beds |
show details | |

|
#47
Newark Ave
Staten Island, NY 10302
|
1,120 sq. feet
|
1 baths 3 beds |
show details | |

|
#48
E 59th St
Brooklyn, NY 11234
|
2,660 sq. feet
|
4 baths 6 beds |
show details | |

|
#49
Crine Rd
Morganville, NJ 07751
|
3,058 sq. feet
|
3 baths 5 beds |
show details | |

|
Check over 1 million property listings on Foreclosure.com!
|
browse all offers | |||


 | I'm searching for a house to rent/rent to own in Middletown,NJ area??? (4 replies) |
| NJ Shore (61 replies) |
| Homes in Middletown, NJ (24 replies) |
| Port Monmouth (1 reply) |
| PORT MONMOUTH, NJ- Possible move, what are we in for? (0 replies) |
| Seeking info on certain towns :) (14 replies) |

Median year apartment built: 2014
Household type by relationship:
Households: 3,178- Male householders: 473 (78 living alone), Female householders: 831 (302 living alone)
629 spouses (629 opposite-sex spouses), 98 unmarried partners, (98 opposite-sex unmarried partners), 850 children (842 natural, 0 adopted, 8 stepchildren), 46 grandchildren, 54 brothers or sisters, 43 parents, 0 foster children, 20 other relatives, 123 non-relatives
- In group quarters: 9
Size of family households: 341 2-persons, 279 3-persons, 127 4-persons, 69 5-persons, 24 6-persons, 12 7-or-more-persons.
Size of nonfamily households: 379 1-person, 22 2-persons, 72 3-persons.
250 married couples with children.
150 single-parent households (0 men, 150 women).
93.4% of residents of Port Monmouth speak English at home.
3.7% of residents speak Spanish at home (61% speak English very well, 30% speak English well, 9% speak English not well).
1.3% of residents speak other Indo-European language at home (97% speak English very well, 3% speak English well).
0.8% of residents speak Asian or Pacific Island language at home (67% speak English very well, 33% speak English well).
0.2% of residents speak other language at home (100% speak English very well).
Foreign born population: 102 (3.2%)
(86.3% of them are naturalized citizens)
| Here: | 6.4 |
| State: | 6.8 |
| Here: | 3.3 |
| State: | 3.9 |

- Bedrooms in owner-occupied houses and condos in Port Monmouth, New Jersey
- 0no bedroom
- 541 bedroom
- 1242 bedrooms
- 4663 bedrooms
- 3584 bedrooms
- 415+ bedrooms

- Bedrooms in renter-occupied apartments in Port Monmouth, New Jersey
- 0no bedroom
- 2181 bedroom
- 152 bedrooms
- 453 bedrooms
- 04 bedrooms
- 115+ bedrooms

- Cars and other vehicles available in Port Monmouth in owner-occupied houses/condos
- 13no vehicle
- 2061 vehicle
- 4192 vehicles
- 3413 vehicles
- 124 vehicles
- 525+ vehicles

- Cars and other vehicles available in Port Monmouth in renter-occupied apartments
- 145no vehicle
- 1231 vehicle
- 212 vehicles
- 03 vehicles
- 04 vehicles
- 05+ vehicles

- Rooms in owner-occupied houses in Port Monmouth, New Jersey
- 01 room
- 132 rooms
- 103 rooms
- 834 rooms
- 1665 rooms
- 2656 rooms
- 2847 rooms
- 1088 rooms
- 1149+ rooms

- Rooms in renter-occupied apartments in Port Monmouth, New Jersey
- 01 room
- 142 rooms
- 1713 rooms
- 234 rooms
- 245 rooms
- 06 rooms
- 07 rooms
- 528 rooms
- 69+ rooms


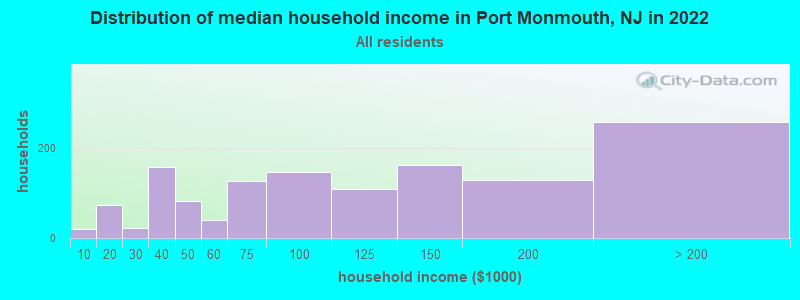
Port Monmouth, NJ household income distribution

- 21Less than $10,000
- 73$10,000 to $19,999
- 23$20,000 to $29,999
- 159$30,000 to $39,999
- 82$40,000 to $49,999
- 41$50,000 to $59,999
- 127$60,000 to $74,999
- 147$75,000 to $99,999
- 110$100,000 to $124,999
- 164$125,000 to $149,999
- 129$150,000 to $199,999
- 259$200,000 or more
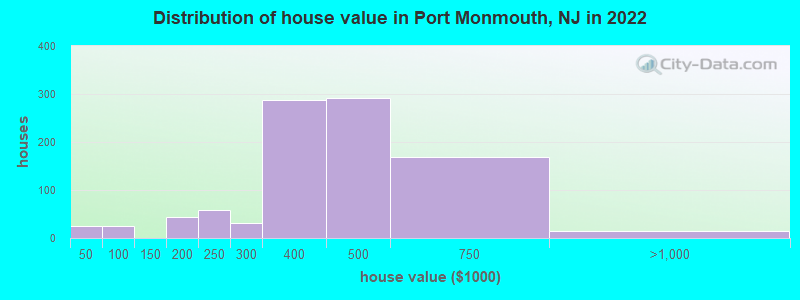
Home value of owner - occupied houses in 2022 in Port Monmouth, NJ
-
- 24$40,000 to $49,999
- 43$150,000 to $174,999
- 57$200,000 to $249,999
- 31$250,000 to $299,999
- 287$300,000 to $399,999
- 290$400,000 to $499,999
- 167$500,000 to $749,999
- 14$750,000 to $999,999
Rent paid by renters in 2022 in Port Monmouth, NJ
-
- 13$100 to $149
- 9$800 to $899
- 15$900 to $999
- 223$1,000 to $1,249
- 13$1,500 to $1,999
- 4$3,000 to $3,499


Percentage of workers working in this county: 57.5%
Number of people working at home: 254 (14.3% of all workers)
Travel time to work (commute)
- Less than 5 minutes: 22
- 5 to 9 minutes: 66
- 10 to 14 minutes: 119
- 15 to 19 minutes: 93
- 20 to 24 minutes: 151
- 25 to 29 minutes: 143
- 30 to 34 minutes: 243
- 35 to 39 minutes: 21
- 40 to 44 minutes: 56
- 45 to 59 minutes: 221
- 60 to 89 minutes: 235
- 90 or more minutes: 94
Means of transportation to work:
- Drove a car alone: 1,359 (82.2%)
- Carpooled: 159 (9.6%)
- Bus or trolley bus: 29 (1.8%)
- Streetcar or trolley car: 4 (0.2%)
- Railroad: 48 (2.9%)
- Taxi: 14 (0.8%)
- Walked: 26 (1.6%)
- Other means: 14 (0.8%)

- Unemployment by race in 2022
- Unemployment rate for White non-Hispanic residents
- 4.7%Males
- 4.7%Females
- Unemployment rate for two or more race residents
- 13.1%Females

- Year of entry for the foreign-born population in Port Monmouth, New Jersey
- 02010 or later
- 72000 to 2009
- 01990 to 1999
- 01980 to 1989
- 301970 to 1979
- 85Before 1970

First ancestries reported:
- Irish: 304 (29.3%)
- Italian: 246 (23.7%)
- Polish: 69 (6.7%)
- German: 54 (5.2%)
- Scottish: 45 (4.3%)
- American: 44 (4.2%)
- Lithuanian: 5 (0.5%)
- Estonian: 3 (0.3%)
- Ukrainian: 1 (0.10%)
Most common places of birth for foreign-born residents (%):
| Port Monmouth: | 19.6% (20) |
| New Jersey: | 4.0% (85,934) |
| Port Monmouth: | 17.6% (18) |
| New Jersey: | 0.5% (10,246) |
| Port Monmouth: | 15.7% (16) |
| New Jersey: | 2.3% (48,811) |
| Port Monmouth: | 15.7% (16) |
| New Jersey: | 2.7% (58,563) |
| Port Monmouth: | 13.7% (14) |
| New Jersey: | 0.4% (8,146) |
| Port Monmouth: | 6.9% (7) |
| New Jersey: | 9.7% (209,055) |
| Port Monmouth: | 4.9% (5) |
| New Jersey: | 0.4% (7,791) |
Place of birth for U.S.-born residents:
- This state: 2,306
- Other state: 757
- Northeast: 645
- Midwest: 80
- South: 0
- West: 27
99.5% of Port Monmouth residents lived in the same house 1 years ago.
Out of people who lived in different houses, 23.9% lived in this county.
Out of people who lived in different counties, 100.0% lived in New Jersey.
| Port Monmouth: | 99.5% |
| State average: | 90.4% |
Education attainment for males 25 years and older:
- No schooling: 2
- Nursery to 4th grade: 0
- 5th and 6th grade: 0
- 7th and 8th grade: 1
- 9th grade: 0
- 10th grade: 11
- 11th grade: 0
- 12th grade, no diploma: 12
- High school graduate (or equivalency): 477
- Less than 1 year of college: 52
- Some college more than 1 year, no degree: 67
- Associate degree: 120
- Bachelor's degree: 159
- Master's degree: 77
- Professional school degree: 21
- Doctorate degree: 13

Education attainment for females 25 years and older:
- No schooling: 0
- Nursery to 4th grade: 0
- 5th and 6th grade: 0
- 7th and 8th grade: 0
- 9th grade: 0
- 10th grade: 0
- 11th grade: 0
- 12th grade, no diploma: 0
- High school graduate (or equivalency): 489
- Less than 1 year of college: 32
- Some college more than 1 year, no degree: 277
- Associate degree: 119
- Bachelor's degree: 231
- Master's degree: 91
- Professional school degree: 12
- Doctorate degree: 0


Housing units in structures:
- One, detached: 1,193
- One, attached: 7
- Two: 123
- 5 to 9: 12
- 50 or more: 84
Housing units lacking complete kitchen facilities in 2022: 5.2%
House/condo owner moved in on average 16 years ago
Renter moved in on average 6 years ago

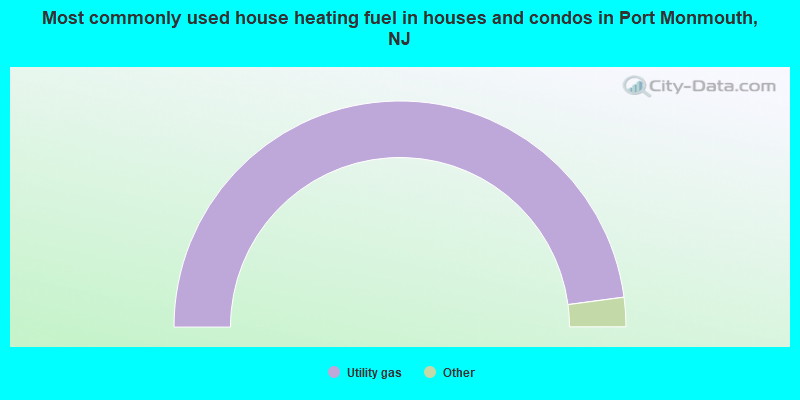
- 95.9%Utility gas
- 3.1%Electricity
- 1.0%Fuel oil, kerosene, etc.
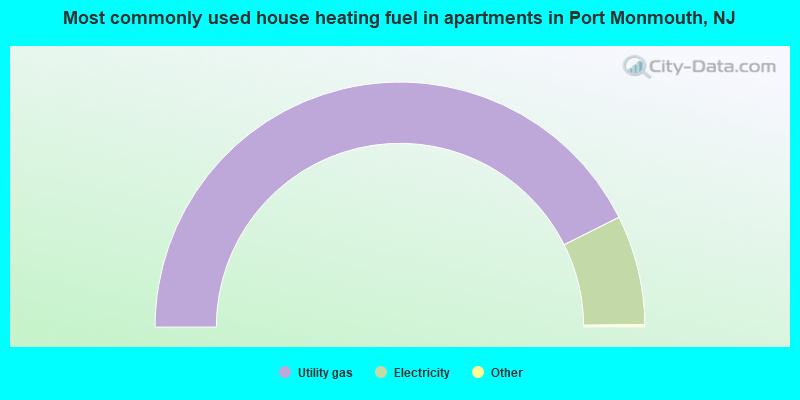
- 85.5%Utility gas
- 14.5%Electricity
Private vs. public school enrollment:
| Here: | 11.9% |
| New Jersey: | 12.3% |
| Here: | 17.7% |
| New Jersey: | 13.1% |
| Here: | 23.5% |
| New Jersey: | 33.2% |


