Port Hueneme, CA (California) Houses and Residents
| Port Hueneme: | $551,574 |
| California: | $715,900 |
Total population: 22,139 (Urban population: 21,846, Rural population: 0)
Houses: 8,255 (7,046 occupied: 3,319 owner occupied, 3,739 renter occupied)
| % of renters here: | 53% |
| State: | 44% |
Housing density: 1,857 houses/condos per square mile
Median price asked for vacant for-sale houses and condos in 2022: $2,137,893.
Median contract rent in 2022: $1,816 (lower quartile is $1,487, upper quartile is over $2,000)
Median rent asked for vacant for-rent units in 2022: $1,369
Median gross rent in Port Hueneme, CA in 2022: $1,895
Housing units in Port Hueneme with a mortgage: 2,409 (110 second mortgage, 4 home equity loan, 93 both second mortgage and home equity loan)
Houses without a mortgage: 0
Median household income for houses/condos with a mortgage: $102,595
Median household income for apartments without a mortgage: $71,000
Median monthly housing costs: $1,947
Compare current foreclosures near Port Hueneme, CA:
| Photo | Address | Area | Beds / Baths | Price | Details |
|---|---|---|---|---|---|

|
#1
Rudder Ave
Port Hueneme, CA 93041
|
806 sq. feet
|
1 baths 2 beds |
show details | |

|
#2
Joyce Dr
Port Hueneme, CA 93041
|
1,065 sq. feet
|
2 baths 3 beds |
show details | |

|
#3
Joyce Dr
Port Hueneme, CA 93041
|
1,858 sq. feet
|
2 baths 3 beds |
show details | |

|
#4
Bolker Dr
Port Hueneme, CA 93041
|
842 sq. feet
|
1 baths 2 beds |
show details | |

|
#5
Anchor Ave
Port Hueneme, CA 93041
|
892 sq. feet
|
1 baths 2 beds |
show details | |

|
#6
N 5th St
Port Hueneme, CA 93041
|
1,290 sq. feet
|
2 baths 4 beds |
show details | |

|
#7
Las Palomas Dr
Port Hueneme, CA 93041
|
1,361 sq. feet
|
2 baths 3 beds |
show details | |

|
#8
N 5th St
Port Hueneme, CA 93041
|
1,046 sq. feet
|
2 baths 3 beds |
show details | |

|
#9
S Ventura Rd Unit 11
Port Hueneme, CA 93041
|
967 sq. feet
|
1 baths 2 beds |
show details | |

|
#10
E Bay Blvd Apt 32
Port Hueneme, CA 93041
|
- sq. feet
|
- baths - beds |
show details |
| Photo | Address | Area | Beds / Baths | Price | Details |
|---|---|---|---|---|---|

|
#11
Yardarm Ave
Port Hueneme, CA 93041
|
- sq. feet
|
- baths - beds |
show details | |

|
#12
Bolker Dr
Port Hueneme, CA 93041
|
- sq. feet
|
- baths - beds |
show details | |

|
#13
Sextant Ave
Port Hueneme, CA 93041
|
- sq. feet
|
- baths - beds |
show details | |

|
#14
Islander Walk
Oxnard, CA 93035
|
1,283 sq. feet
|
2 baths 2 beds |
show details | |

|
#15
Center Ln
Santa Paula, CA 93060
|
1,250 sq. feet
|
2 baths 3 beds |
show details | |

|
#16
Utica Ave
Ventura, CA 93004
|
1,354 sq. feet
|
2 baths 4 beds |
show details | |

|
#17
Callas Dr
Oxnard, CA 93035
|
2,469 sq. feet
|
3 baths 5 beds |
show details | |

|
#18
Lookout Dr
Oxnard, CA 93035
|
1,950 sq. feet
|
2 baths 4 beds |
show details | |

|
#19
Canal St
Oxnard, CA 93035
|
2,504 sq. feet
|
3 baths 3 beds |
show details | |

|
#20
N Hayes Ave
Oxnard, CA 93030
|
1,044 sq. feet
|
1 baths 3 beds |
show details |
| Photo | Address | Area | Beds / Baths | Price | Details |
|---|---|---|---|---|---|

|
#21
Saratoga Ave Unit 1201
Ventura, CA 93003
|
1,250 sq. feet
|
2 baths 4 beds |
show details | |

|
#22
Hughes Dr
Oxnard, CA 93033
|
1,192 sq. feet
|
1 baths 3 beds |
show details | |

|
#23
Green River St
Oxnard, CA 93036
|
1,556 sq. feet
|
2 baths 4 beds |
show details | |

|
#24
Joliet Pl
Oxnard, CA 93030
|
1,268 sq. feet
|
2 baths 3 beds |
show details | |

|
#25
Dove Canyon Dr
Oxnard, CA 93036
|
4,257 sq. feet
|
3 baths 5 beds |
show details | |

|
#26
Sycamore St
Santa Paula, CA 93060
|
720 sq. feet
|
1 baths 2 beds |
show details | |

|
#27
Ribera Dr
Oxnard, CA 93030
|
2,419 sq. feet
|
3 baths 4 beds |
show details | |

|
#28
Kern St
Oxnard, CA 93033
|
1,233 sq. feet
|
2 baths 4 beds |
show details | |

|
#29
Kumquat Pl
Oxnard, CA 93036
|
1,860 sq. feet
|
2 baths 5 beds |
show details | |

|
#30
Salem Ave
Oxnard, CA 93036
|
1,152 sq. feet
|
2 baths 4 beds |
show details |
| Photo | Address | Area | Beds / Baths | Price | Details |
|---|---|---|---|---|---|

|
#31
Pearl St
Ventura, CA 93004
|
2,457 sq. feet
|
3 baths 4 beds |
show details | |

|
#32
Garfield Rondo
Ventura, CA 93003
|
1,223 sq. feet
|
2 baths 3 beds |
show details | |

|
#33
Pyramid Ave
Ventura, CA 93004
|
1,469 sq. feet
|
2 baths 4 beds |
show details | |

|
#34
W Vineyard Ave
Oxnard, CA 93036
|
1,013 sq. feet
|
2 baths 2 beds |
show details | |

|
#35
Camino Toluca
Camarillo, CA 93010
|
1,901 sq. feet
|
2 baths 3 beds |
show details | |

|
#36
Lemon Grove Ave
Ventura, CA 93003
|
1,584 sq. feet
|
2 baths 3 beds |
show details | |

|
#37
Tulare St
Ventura, CA 93004
|
1,634 sq. feet
|
2 baths 4 beds |
show details | |

|
#38
Baker Ave
Ventura, CA 93004
|
2,574 sq. feet
|
3 baths 6 beds |
show details | |

|
#39
Hunter St
Ventura, CA 93003
|
1,386 sq. feet
|
2 baths 4 beds |
show details | |

|
#40
Juneberry Pl
Oxnard, CA 93036
|
1,240 sq. feet
|
2 baths 3 beds |
show details |
| Photo | Address | Area | Beds / Baths | Price | Details |
|---|---|---|---|---|---|

|
#41
Henderson Rd
Ventura, CA 93004
|
1,591 sq. feet
|
1 baths 3 beds |
show details | |

|
#42
Big Horn Ct
Camarillo, CA 93010
|
2,190 sq. feet
|
3 baths 4 beds |
show details | |

|
#43
Sunstone St
Ventura, CA 93004
|
2,323 sq. feet
|
2 baths 4 beds |
show details | |

|
#44
Lobelia Dr
Oxnard, CA 93036
|
1,842 sq. feet
|
2 baths 3 beds |
show details | |

|
#45
Thoreau Ln
Ventura, CA 93003
|
777 sq. feet
|
1 baths 2 beds |
show details | |

|
#46
Cardinal St
Ventura, CA 93003
|
1,338 sq. feet
|
2 baths 4 beds |
show details | |

|
#47
Forest Park Blvd
Oxnard, CA 93036
|
2,385 sq. feet
|
3 baths 4 beds |
show details | |

|
#48
Nyeland Ave
Oxnard, CA 93036
|
960 sq. feet
|
7 baths 3 beds |
show details | |

|
#49
N Ventura Rd
Oxnard, CA 93036
|
1,375 sq. feet
|
2 baths 3 beds |
show details | |

|
Check over 1 million property listings on Foreclosure.com!
|
browse all offers | |||


 | Apartments for Rent - Oxnard/Port Hueneme (1 reply) |
| Apartment rentals in Oxnard (4 replies) |
| Areas to Rent a Condo/Triplex/Guest house in Hueneme/Ventura (15 replies) |
| Are there any reasonably priced Condo/townhomes in Ventura county??? (10 replies) |
| Buy or Rent - Ventura County Edition (17 replies) |
| VC growth stalled, cost of housing to blame (18 replies) |

Median year apartment built: 1976
Household type by relationship:
Households: 21,603- Male householders: 3,477 (789 living alone), Female householders: 3,428 (813 living alone)
2,907 spouses (2,825 opposite-sex spouses), 610 unmarried partners, (600 opposite-sex unmarried partners), 6,397 children (6,100 natural, 105 adopted, 191 stepchildren), 1,041 grandchildren, 705 brothers or sisters, 415 parents, 0 foster children, 922 other relatives, 887 non-relatives
- In group quarters: 809
Size of family households: 2,023 2-persons, 920 3-persons, 763 4-persons, 803 5-persons, 178 6-persons, 210 7-or-more-persons.
Size of nonfamily households: 1,622 1-person, 318 2-persons, 157 3-persons, 13 4-persons.
2,001 married couples with children.
1,813 single-parent households (500 men, 1,313 women).
51.6% of residents of Port Hueneme speak English at home.
43.1% of residents speak Spanish at home (59% speak English very well, 13% speak English well, 16% speak English not well, 12% don't speak English at all).
0.8% of residents speak other Indo-European language at home (71% speak English very well, 13% speak English well, 15% speak English not well).
1.6% of residents speak Asian or Pacific Island language at home (64% speak English very well, 32% speak English well, 3% speak English not well).
1.9% of residents speak other language at home (77% speak English very well, 3% speak English well, 3% speak English not well, 17% don't speak English at all).
Foreign born population: 5,611 (26.0%)
(54.1% of them are naturalized citizens)
| Here: | 5.5 |
| State: | 6.0 |
| Here: | 4.1 |
| State: | 3.9 |

- Bedrooms in owner-occupied houses and condos in Port Hueneme, California
- 7no bedroom
- 661 bedroom
- 8772 bedrooms
- 1,8203 bedrooms
- 4754 bedrooms
- 745+ bedrooms

- Bedrooms in renter-occupied apartments in Port Hueneme, California
- 194no bedroom
- 7121 bedroom
- 1,7012 bedrooms
- 7203 bedrooms
- 3984 bedrooms
- 155+ bedrooms

- Cars and other vehicles available in Port Hueneme in owner-occupied houses/condos
- 73no vehicle
- 8951 vehicle
- 9412 vehicles
- 8973 vehicles
- 3404 vehicles
- 1755+ vehicles

- Cars and other vehicles available in Port Hueneme in renter-occupied apartments
- 394no vehicle
- 1,4181 vehicle
- 1,4952 vehicles
- 3543 vehicles
- 414 vehicles
- 375+ vehicles

- Rooms in owner-occupied houses in Port Hueneme, California
- 01 room
- 72 rooms
- 1653 rooms
- 6354 rooms
- 8525 rooms
- 8766 rooms
- 3697 rooms
- 2448 rooms
- 1729+ rooms

- Rooms in renter-occupied apartments in Port Hueneme, California
- 1761 room
- 1372 rooms
- 7933 rooms
- 1,0064 rooms
- 7365 rooms
- 4856 rooms
- 2247 rooms
- 1418 rooms
- 419+ rooms


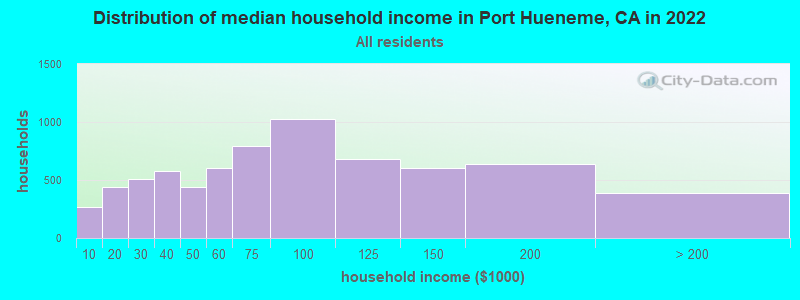
Port Hueneme, CA household income distribution

- 266Less than $10,000
- 443$10,000 to $19,999
- 512$20,000 to $29,999
- 575$30,000 to $39,999
- 439$40,000 to $49,999
- 606$50,000 to $59,999
- 797$60,000 to $74,999
- 1,029$75,000 to $99,999
- 679$100,000 to $124,999
- 600$125,000 to $149,999
- 634$150,000 to $199,999
- 390$200,000 or more
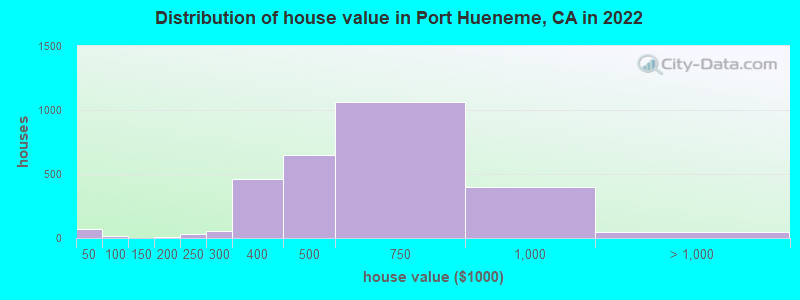
Home value of owner - occupied houses in 2022 in Port Hueneme, CA
-
- 48Less than $10,000
- 7$30,000 to $34,999
- 6$35,000 to $39,999
- 9$40,000 to $49,999
- 6$50,000 to $59,999
- 2$150,000 to $174,999
- 6$175,000 to $199,999
- 28$200,000 to $249,999
- 52$250,000 to $299,999
- 461$300,000 to $399,999
- 651$400,000 to $499,999
- 1,065$500,000 to $749,999
- 402$750,000 to $999,999
- 21$1,000,000 to $1,499,999
- 24$2,000,000 or more
Rent paid by renters in 2022 in Port Hueneme, CA
-
- 103$200 to $249
- 108$250 to $299
- 114$300 to $349
- 18$650 to $699
- 30$750 to $799
- 20$900 to $999
- 316$1,000 to $1,249
- 163$1,250 to $1,499
- 1,362$1,500 to $1,999
- 733$2,000 to $2,499
- 189$2,500 to $2,999
- 166$3,000 to $3,499
- 14$3,500 or more
- 167No cash rent


Percentage of workers working in this county: 95.0%
Number of people working at home: 938 (8.7% of all workers)
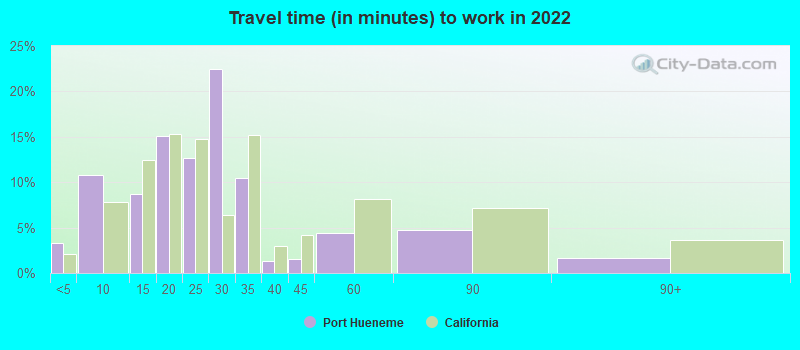
Travel time to work (commute)
- Less than 5 minutes: 441
- 5 to 9 minutes: 1,062
- 10 to 14 minutes: 801
- 15 to 19 minutes: 1,312
- 20 to 24 minutes: 1,262
- 25 to 29 minutes: 2,541
- 30 to 34 minutes: 992
- 35 to 39 minutes: 269
- 40 to 44 minutes: 90
- 45 to 59 minutes: 208
- 60 to 89 minutes: 263
- 90 or more minutes: 190
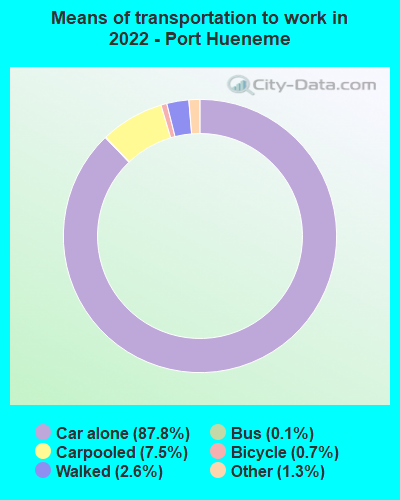
Means of transportation to work:
- Drove a car alone: 9,236 (77.3%)
- Carpooled: 928 (7.8%)
- Bus: 15 (0.1%)
- Taxi: 164 (1.4%)
- Bicycle: 86 (0.7%)
- Walked: 301 (2.5%)
- Worked at home: 938 (7.9%)

- Unemployment by race in 2022
- Unemployment rate for White non-Hispanic residents
- 8.6%Males
- 6.5%Females
- Unemployment rate for American Indian and Alaska Native residents
- 39.2%Females
- Unemployment rate for Asian residents
- 6.4%Females
- Unemployment rate for other race residents
- 5.9%Males
- 8.1%Females
- Unemployment rate for two or more race residents
- 7.0%Males
- 7.3%Females
- Unemployment rate for Hispanic or Latino residents
- 8.3%Males
- 5.5%Females

- Year of entry for the foreign-born population in Port Hueneme, California
- 6992010 or later
- 1,5502000 to 2009
- 1,0341990 to 1999
- 1,4441980 to 1989
- 1,1091970 to 1979
- 663Before 1970

First ancestries reported:
- American: 1,956 (13.5%)
- German: 374 (2.6%)
- English: 188 (1.3%)
- Italian: 111 (0.8%)
- Swedish: 84 (0.6%)
- Irish: 69 (0.5%)
- Russian: 68 (0.5%)
- European: 51 (0.4%)
- African: 47 (0.3%)
- Egyptian: 42 (0.3%)
- Scandinavian: 37 (0.3%)
- Ukrainian: 23 (0.2%)
- Polish: 22 (0.2%)
- Norwegian: 21 (0.1%)
- Ethiopian: 20 (0.1%)
- Dutch: 19 (0.1%)
- Jamaican: 18 (0.1%)
- Scottish: 11 (0.08%)
- Northern European: 10 (0.07%)
- Ghanaian: 9 (0.06%)
- Canadian: 8 (0.06%)
- French: 7 (0.05%)
- Scotch-Irish: 5 (0.03%)
- Portuguese: 3 (0.02%)
Most common places of birth for foreign-born residents (%):
| Port Hueneme: | 79.0% (4,262) |
| California: | 37.2% (3,881,193) |
| Port Hueneme: | 5.3% (288) |
| California: | 7.8% (818,297) |
| Port Hueneme: | 3.0% (163) |
| California: | 0.2% (21,276) |
Place of birth for U.S.-born residents:
- This state: 11,785
- Other state: 3,898
- Northeast: 674
- Midwest: 960
- South: 1,303
- West: 924
87.5% of Port Hueneme residents lived in the same house 1 years ago.
Out of people who lived in different houses, 34.0% lived in this county.
Out of people who lived in different counties, 48.0% lived in California.
| Port Hueneme: | 87.5% |
| State average: | 88.9% |
Education attainment for males 25 years and older:
- No schooling: 194
- Nursery to 4th grade: 108
- 5th and 6th grade: 566
- 7th and 8th grade: 122
- 9th grade: 0
- 10th grade: 54
- 11th grade: 136
- 12th grade, no diploma: 240
- High school graduate (or equivalency): 1,817
- Less than 1 year of college: 258
- Some college more than 1 year, no degree: 1,258
- Associate degree: 589
- Bachelor's degree: 1,433
- Master's degree: 450
- Professional school degree: 47
- Doctorate degree: 10

Education attainment for females 25 years and older:
- No schooling: 326
- Nursery to 4th grade: 338
- 5th and 6th grade: 514
- 7th and 8th grade: 45
- 9th grade: 30
- 10th grade: 218
- 11th grade: 54
- 12th grade, no diploma: 258
- High school graduate (or equivalency): 1,846
- Less than 1 year of college: 485
- Some college more than 1 year, no degree: 1,060
- Associate degree: 600
- Bachelor's degree: 949
- Master's degree: 360
- Professional school degree: 20
- Doctorate degree: 3


Housing units in structures:
- One, detached: 2,836
- One, attached: 2,683
- Two: 52
- 3 or 4: 674
- 5 to 9: 600
- 10 to 19: 369
- 20 to 49: 573
- 50 or more: 466
Housing units lacking complete kitchen facilities in 2022: 2.6%
House/condo owner moved in on average 12 years ago
Renter moved in on average 2 years ago

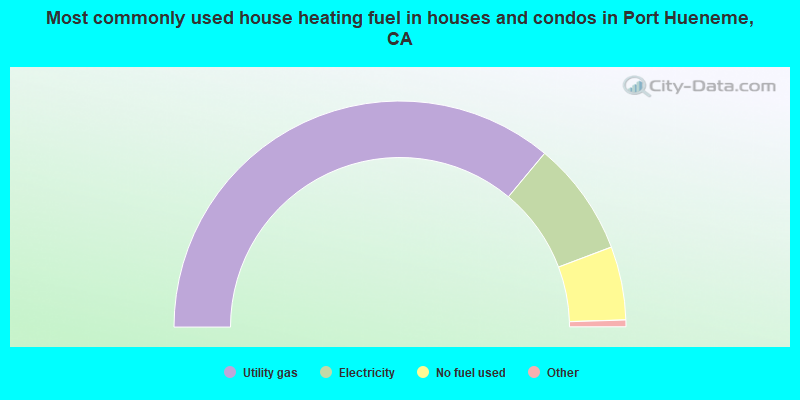
- 72.2%Utility gas
- 16.4%Electricity
- 10.5%No fuel used
- 0.8%Bottled, tank, or LP gas
- 0.2%Solar energy
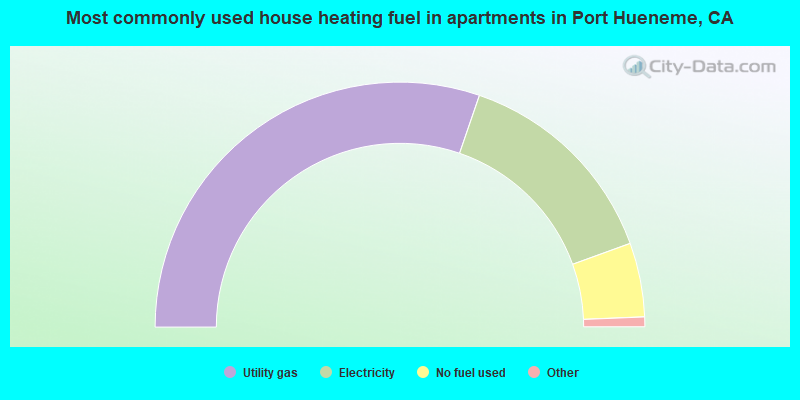
- 60.6%Utility gas
- 28.4%Electricity
- 9.8%No fuel used
- 0.6%Bottled, tank, or LP gas
- 0.6%Wood
Private vs. public school enrollment:
| Here: | 9.2% |
| California: | 10.5% |
| Here: | 5.2% |
| California: | 8.5% |
| Here: | 10.0% |
| California: | 15.9% |


