Housing density: 1,883 houses/condos per square mile
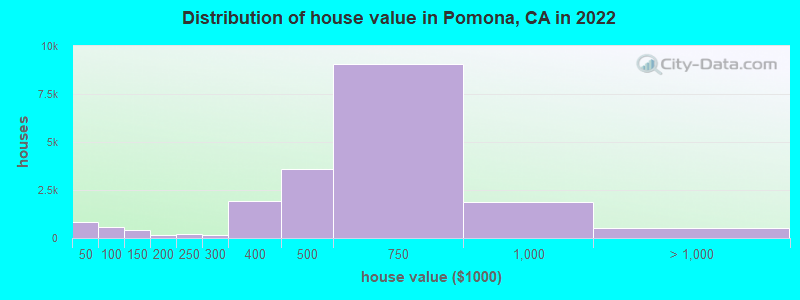
Median price asked for vacant for-sale houses and condos in 2022: $1,115,663.
Median contract rent in 2022: $1,519 (lower quartile is $1,159, upper quartile is $1,899)
Median rent asked for vacant for-rent units in 2022: $4,000
Median gross rent in Pomona, CA in 2022: $1,668
Housing units in Pomona with a mortgage: 15,101 (1,260 second mortgage, 29 home equity loan, 942 both second mortgage and home equity loan) Houses without a mortgage: 365
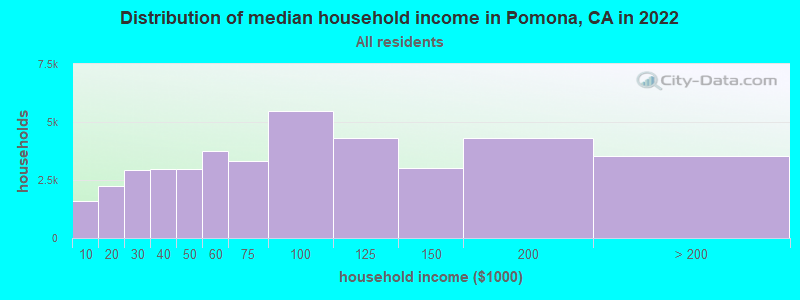
Median household income for houses/condos with a mortgage: $109,992
Median household income for apartments without a mortgage: $73,050
17,395 married couples with children.
9,488 single-parent households (2,663 men, 6,825 women).
35.7% of residents of Pomona speak English at home.
53.1% of residents speak Spanish at home (62% speak English very well, 14% speak English well, 15% speak English not well, 9% don't speak English at all).
1.3% of residents speak other Indo-European language at home (57% speak English very well, 20% speak English well, 19% speak English not well, 4% don't speak English at all).
8.6% of residents speak Asian or Pacific Island language at home (45% speak English very well, 23% speak English well, 22% speak English not well, 10% don't speak English at all).
0.6% of residents speak other language at home (75% speak English very well, 14% speak English well, 3% speak English not well, 8% don't speak English at all).
Foreign born population: 48,636 (33.3%)
(48.8% of them are naturalized citizens)
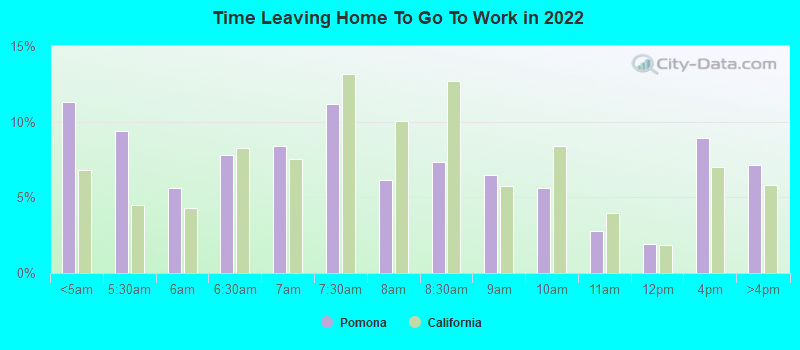
Percentage of workers working in this county: 71.1% Number of people working at home: 6,387 (9.4% of all workers)
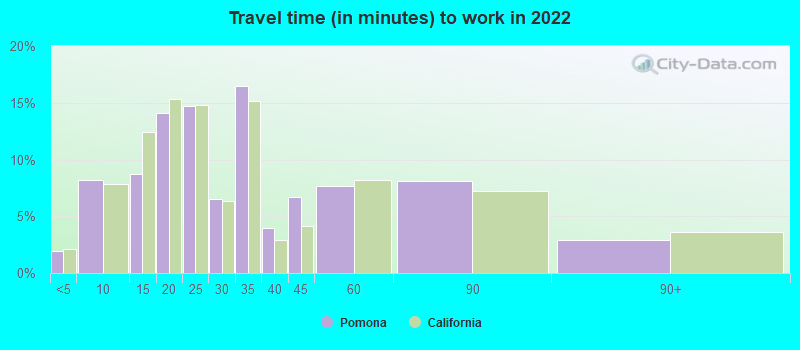
Travel time to work (commute)
Less than 5 minutes: 893
5 to 9 minutes: 4,689
10 to 14 minutes: 6,774
15 to 19 minutes: 6,640
20 to 24 minutes: 9,159
25 to 29 minutes: 3,669
30 to 34 minutes: 10,652
35 to 39 minutes: 1,385
40 to 44 minutes: 3,945
45 to 59 minutes: 4,935
60 to 89 minutes: 5,019
90 or more minutes: 3,485
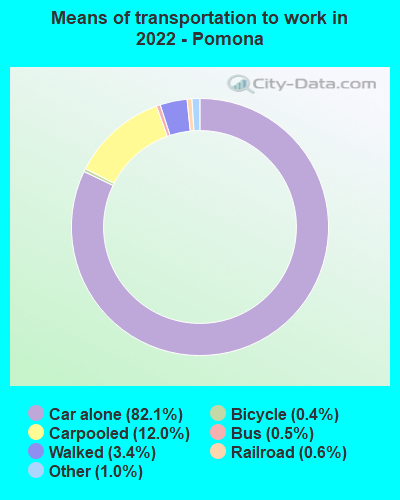
Means of transportation to work:
Drove a car alone: 44,784 (73.5%)
Carpooled: 6,531 (10.7%)
Bus: 290 (0.5%)
Light rail, streetcar or trolley: 349 (0.6%)
Taxi: 520 (0.9%)
Bicycle: 192 (0.3%)
Walked: 1,868 (3.1%)
Worked at home: 6,387 (10.5%)
Unemployment by race in 2022
Unemployment rate for White non-Hispanic residents
1.7%Males
5.2%Females
Unemployment rate for Black residents
8.5%Males
7.6%Females
Unemployment rate for American Indian and Alaska Native residents
6.2%Males
4.7%Females
Unemployment rate for Asian residents
2.8%Males
5.9%Females
Unemployment rate for other race residents
3.1%Males
4.1%Females
Unemployment rate for two or more race residents
9.3%Males
2.7%Females
Unemployment rate for Hispanic or Latino residents
6.0%Males
3.4%Females
Year of entry for the foreign-born population in Pomona, California
7,7132010 or later
9,6232000 to 2009
10,8021990 to 1999
20,2831980 to 1989
11,5971970 to 1979
4,303Before 1970
First ancestries reported:
American: 1,375 (1.4%)
German: 936 (1.0%)
English: 618 (0.6%)
Italian: 502 (0.5%)
European: 443 (0.5%)
Irish: 423 (0.4%)
African: 347 (0.4%)
Dutch: 167 (0.2%)
Norwegian: 158 (0.2%)
Afghan: 118 (0.1%)
Sudanese: 118 (0.1%)
Iranian: 108 (0.1%)
Syrian: 99 (0.1%)
Cajun: 76 (0.08%)
French: 70 (0.07%)
Swedish: 70 (0.07%)
Armenian: 69 (0.07%)
Russian: 68 (0.07%)
Nigerian: 67 (0.07%)
Romanian: 61 (0.06%)
British: 52 (0.05%)
Eastern European: 49 (0.05%)
Jamaican: 48 (0.05%)
Portuguese: 47 (0.05%)
Scotch-Irish: 45 (0.05%)
Northern European: 42 (0.04%)
Lebanese: 40 (0.04%)
Scottish: 39 (0.04%)
Kenyan: 37 (0.04%)
Israeli: 37 (0.04%)
Welsh: 36 (0.04%)
Egyptian: 35 (0.04%)
Polish: 26 (0.03%)
Arab: 26 (0.03%)
French Canadian: 25 (0.03%)
Ghanaian: 25 (0.03%)
Ukrainian: 24 (0.02%)
Barbadian: 23 (0.02%)
Canadian: 21 (0.02%)
Scandinavian: 21 (0.02%)
West Indian: 18 (0.02%)
British West Indian: 15 (0.02%)
Brazilian: 14 (0.01%)
Greek: 14 (0.01%)
Danish: 13 (0.01%)
Palestinian: 13 (0.01%)
Hungarian: 13 (0.01%)
Haitian: 12 (0.01%)
Guyanese: 9 (0.01%)
Lithuanian: 6 (0.01%)
Zimbabwean: 5 (0.01%)
Most common places of birth for foreign-born residents (%):
Mexico
Pomona:
60.4% (28,977)
California:
37.2% (3,881,193)
China, excluding Hong Kong and Taiwan
Pomona:
6.1% (2,901)
California:
6.6% (684,672)
El Salvador
Pomona:
4.8% (2,305)
California:
4.2% (440,287)
Philippines
Pomona:
4.6% (2,188)
California:
7.8% (818,297)
Guatemala
Pomona:
3.9% (1,856)
California:
2.8% (290,436)
Korea
Pomona:
3.2% (1,518)
California:
3.0% (315,248)
Vietnam
Pomona:
2.5% (1,207)
California:
4.9% (512,335)
Taiwan
Pomona:
1.7% (826)
California:
1.7% (176,274)
Place of birth for U.S.-born residents:
This state: 86,506
Other state: 8,200
Northeast: 1,903
Midwest: 1,525
South: 2,742
West: 2,030
90.9% of Pomona residents lived in the same house 1 years ago. Out of people who lived in different houses, 37.8% lived in this county. Out of people who lived in different counties, 76.7% lived in California.
Pomona:
90.9%
State average:
88.9%
Education attainment for males 25 years and older:
No schooling: 3,056
Nursery to 4th grade: 885
5th and 6th grade: 2,926
7th and 8th grade: 925
9th grade: 2,436
10th grade: 1,505
11th grade: 678
12th grade, no diploma: 1,826
High school graduate (or equivalency): 12,204
Less than 1 year of college: 2,598
Some college more than 1 year, no degree: 7,741
Associate degree: 3,102
Bachelor's degree: 6,946
Master's degree: 1,638
Professional school degree: 224
Doctorate degree: 0
Education attainment for females 25 years and older:
No schooling: 2,134
Nursery to 4th grade: 1,373
5th and 6th grade: 2,796
7th and 8th grade: 435
9th grade: 1,672
10th grade: 1,243
11th grade: 569
12th grade, no diploma: 2,262
High school graduate (or equivalency): 11,902
Less than 1 year of college: 2,964
Some college more than 1 year, no degree: 6,463
Associate degree: 3,010
Bachelor's degree: 6,277
Master's degree: 2,596
Professional school degree: 247
Doctorate degree: 590
Housing units in structures:
One, detached: 26,627
One, attached: 3,813
Two: 754
3 or 4: 2,536
5 to 9: 2,507
10 to 19: 1,416
20 to 49: 1,428
50 or more: 2,705
Mobile homes: 1,000
Boats, RVs, vans, etc.: 215
Median worth of mobile homes: $101,100
Housing units lacking complete plumbing facilities in 2022: 2.1%
Housing units lacking complete kitchen facilities in 2022: 1.8%
House/condo owner moved in on average 15 years ago