Pollock Pines, CA (California) Houses and Residents
| Pollock Pines: | $398,791 |
| California: | $715,900 |
Total population: 6,871 (Urban population: 3,771 (all inside urban clusters), Rural population: 842 (all nonfarm))
Houses: 3,436 (2,745 occupied: 1,971 owner occupied, 711 renter occupied)
| % of renters here: | 27% |
| State: | 44% |
Housing density: 590 houses/condos per square mile
Median price asked for vacant for-sale houses and condos in 2022: $1,306,094.
Median contract rent in 2022: $854 (lower quartile is $570, upper quartile is $1,182)
Median rent asked for vacant for-rent units in 2022: $1,519
Median gross rent in Pollock Pines, CA in 2022: $1,043
Housing units in Pollock Pines with a mortgage: 1,226 (156 second mortgage, 26 home equity loan, 104 both second mortgage and home equity loan)
Houses without a mortgage: 23
Median household income for houses/condos with a mortgage: $104,120
Median household income for apartments without a mortgage: $62,827
Median monthly housing costs: $1,323
Compare current foreclosures near Pollock Pines, CA:
| Photo | Address | Area | Beds / Baths | Price | Details |
|---|---|---|---|---|---|

|
#1
Sly Park Rd
Pollock Pines, CA 95726
|
1,252 sq. feet
|
2 baths 4 beds |
show details | |

|
#2
Marilyn Dr
Pollock Pines, CA 95726
|
1,176 sq. feet
|
2 baths 2 beds |
show details | |

|
#3
Pollock Ave
Pollock Pines, CA 95726
|
1,331 sq. feet
|
2 baths 3 beds |
show details | |

|
#4
Stellar Ln
Pollock Pines, CA 95726
|
- sq. feet
|
1 baths 2 beds |
show details | |

|
#5
Fallen Oak Trl
Pollock Pines, CA 95726
|
1,590 sq. feet
|
2 baths 2 beds |
show details | |

|
#6
Marjorie Way
Pollock Pines, CA 95726
|
1,350 sq. feet
|
2 baths 2 beds |
show details | |

|
#7
Longs Creek Trl
Pollock Pines, CA 95726
|
2,102 sq. feet
|
2 baths 3 beds |
show details | |

|
#8
Marjorie Way
Pollock Pines, CA 95726
|
1,826 sq. feet
|
2 baths 3 beds |
show details | |

|
#9
Amaryllis Dr
Pollock Pines, CA 95726
|
960 sq. feet
|
1 baths 1 beds |
show details | |

|
#10
Begonia Dr
Pollock Pines, CA 95726
|
2,170 sq. feet
|
2 baths 4 beds |
show details |
| Photo | Address | Area | Beds / Baths | Price | Details |
|---|---|---|---|---|---|

|
#11
Loch Leven Dr
Pollock Pines, CA 95726
|
1,239 sq. feet
|
2 baths 3 beds |
show details | |

|
#12
Gilmore Rd
Pollock Pines, CA 95726
|
2,419 sq. feet
|
2 baths 3 beds |
show details | |

|
#13
Pine Cone Dr
Pollock Pines, CA 95726
|
1,152 sq. feet
|
2 baths 2 beds |
show details | |

|
#14
Sierra Springs Dr
Pollock Pines, CA 95726
|
1,902 sq. feet
|
2 baths 2 beds |
show details | |

|
#15
Marjorie Way
Pollock Pines, CA 95726
|
621 sq. feet
|
1 baths 2 beds |
show details | |

|
#16
Zinc Dr
Pollock Pines, CA 95726
|
1,997 sq. feet
|
2 baths 3 beds |
show details | |

|
#17
Kamloops Dr
Pollock Pines, CA 95726
|
1,519 sq. feet
|
2 baths 3 beds |
show details | |

|
#18
Lynx Trl
Pollock Pines, CA 95726
|
- sq. feet
|
- baths - beds |
show details | |

|
#19
Elm St
Pollock Pines, CA 95726
|
- sq. feet
|
- baths - beds |
show details | |

|
#20
Pine Ct
Pollock Pines, CA 95726
|
- sq. feet
|
- baths - beds |
show details |
| Photo | Address | Area | Beds / Baths | Price | Details |
|---|---|---|---|---|---|

|
#21
Forebay Rd
Pollock Pines, CA 95726
|
- sq. feet
|
- baths - beds |
show details | |

|
#22
Carson Rd
Camino, CA 95709
|
3,000 sq. feet
|
3 baths 5 beds |
show details | |

|
#23
Bucks Bar Rd
Placerville, CA 95667
|
1,160 sq. feet
|
1 baths 2 beds |
show details | |

|
#24
Dusty Ln
Placerville, CA 95667
|
2,357 sq. feet
|
3 baths 3 beds |
show details | |

|
#25
Meadow Glen Dr
Grizzly Flats, CA 95636
|
1,260 sq. feet
|
2 baths 3 beds |
show details | |

|
#26
Fort Jim Rd
Placerville, CA 95667
|
2,300 sq. feet
|
2 baths 3 beds |
show details | |

|
#27
Westley Rd
Placerville, CA 95667
|
1,540 sq. feet
|
2 baths 3 beds |
show details | |

|
#28
Jeffrey Ln
Placerville, CA 95667
|
1,672 sq. feet
|
3 baths 3 beds |
show details | |

|
#29
Pasture Pl
Garden Valley, CA 95633
|
1,493 sq. feet
|
2 baths 3 beds |
show details | |

|
#30
Hawks Landing Ct
Placerville, CA 95667
|
2,225 sq. feet
|
3 baths 4 beds |
show details |
| Photo | Address | Area | Beds / Baths | Price | Details |
|---|---|---|---|---|---|

|
#31
Mary Ann Ln
Placerville, CA 95667
|
1,824 sq. feet
|
2 baths 3 beds |
show details | |

|
#32
Hollow Oak Ct
Garden Valley, CA 95633
|
1,262 sq. feet
|
2 baths 3 beds |
show details | |

|
#33
Spanish Ravine Rd
Placerville, CA 95667
|
918 sq. feet
|
1 baths 3 beds |
show details | |

|
#34
Marshall Rd
Garden Valley, CA 95633
|
1,574 sq. feet
|
1 baths 3 beds |
show details | |

|
#35
Crawley Ln
Placerville, CA 95667
|
1,488 sq. feet
|
2 baths 3 beds |
show details | |

|
#36
Gun Smoke Rd
Georgetown, CA 95634
|
960 sq. feet
|
2 baths 3 beds |
show details | |

|
#37
Clay St
Placerville, CA 95667
|
1,433 sq. feet
|
2 baths 3 beds |
show details | |

|
#38
Granite Springs Rd
Somerset, CA 95684
|
1,628 sq. feet
|
2 baths 3 beds |
show details | |

|
#39
Incline Way
Somerset, CA 95684
|
1,404 sq. feet
|
2 baths 3 beds |
show details | |

|
#40
Northridge Dr
Placerville, CA 95667
|
1,396 sq. feet
|
2 baths 2 beds |
show details |
| Photo | Address | Area | Beds / Baths | Price | Details |
|---|---|---|---|---|---|

|
#41
Outingdale Rd
Somerset, CA 95684
|
1,533 sq. feet
|
2 baths 2 beds |
show details | |

|
#42
Good Pasture Rd
Placerville, CA 95667
|
2,082 sq. feet
|
3 baths 3 beds |
show details | |

|
#43
Bronzecrest St
Placerville, CA 95667
|
1,955 sq. feet
|
2 baths 3 beds |
show details | |

|
#44
Indian Creek Rd
Placerville, CA 95667
|
1,736 sq. feet
|
2 baths 4 beds |
show details | |

|
#45
State Highway 49
Placerville, CA 95667
|
1,728 sq. feet
|
2 baths 4 beds |
show details | |

|
#46
Odd Fellows
Diamond Springs, CA 95619
|
1,304 sq. feet
|
1 baths 2 beds |
show details | |

|
#47
Twelve Oaks Ln
Placerville, CA 95667
|
1,559 sq. feet
|
2 baths 3 beds |
show details | |

|
#48
Pleasant Valley Rd Spc 18
Diamond Springs, CA 95619
|
720 sq. feet
|
1 baths 1 beds |
show details | |

|
#49
Winter Ct
Placerville, CA 95667
|
900 sq. feet
|
1 baths 2 beds |
show details | |

|
Check over 1 million property listings on Foreclosure.com!
|
browse all offers | |||


Median year apartment built: 1976
Household type by relationship:
Households: 5,945- Male householders: 1,579 (596 living alone), Female householders: 1,145 (458 living alone)
1,256 spouses (1,256 opposite-sex spouses), 172 unmarried partners, (151 opposite-sex unmarried partners), 1,278 children (1,235 natural, 3 adopted, 39 stepchildren), 146 grandchildren, 6 brothers or sisters, 22 parents, 4 foster children, 19 other relatives, 271 non-relatives
- In group quarters: 44
Size of family households: 816 2-persons, 303 3-persons, 283 4-persons, 43 5-persons, 33 6-persons, 19 7-or-more-persons.
Size of nonfamily households: 973 1-person, 107 2-persons, 34 3-persons, 55 5-persons.
601 married couples with children.
372 single-parent households (247 men, 125 women).
94.8% of residents of Pollock Pines speak English at home.
3.6% of residents speak Spanish at home (55% speak English very well, 39% speak English well, 7% speak English not well).
0.8% of residents speak other Indo-European language at home (84% speak English very well, 16% speak English not well).
0.3% of residents speak Asian or Pacific Island language at home (100% speak English well).
Foreign born population: 224 (3.8%)
(20.5% of them are naturalized citizens)
| Here: | 5.6 |
| State: | 6.0 |
| Here: | 2.9 |
| State: | 3.9 |

- Bedrooms in owner-occupied houses and condos in Pollock Pines, California
- 0no bedroom
- 1461 bedroom
- 5122 bedrooms
- 1,0853 bedrooms
- 1764 bedrooms
- 515+ bedrooms

- Bedrooms in renter-occupied apartments in Pollock Pines, California
- 193no bedroom
- 2441 bedroom
- 1482 bedrooms
- 1263 bedrooms
- 04 bedrooms
- 05+ bedrooms

- Cars and other vehicles available in Pollock Pines in owner-occupied houses/condos
- 143no vehicle
- 4531 vehicle
- 7462 vehicles
- 3393 vehicles
- 1944 vehicles
- 965+ vehicles

- Cars and other vehicles available in Pollock Pines in renter-occupied apartments
- 77no vehicle
- 4641 vehicle
- 462 vehicles
- 953 vehicles
- 304 vehicles
- 05+ vehicles

- Rooms in owner-occupied houses in Pollock Pines, California
- 01 room
- 622 rooms
- 1133 rooms
- 3114 rooms
- 4635 rooms
- 5516 rooms
- 2337 rooms
- 1258 rooms
- 1149+ rooms

- Rooms in renter-occupied apartments in Pollock Pines, California
- 1931 room
- 852 rooms
- 2073 rooms
- 1154 rooms
- 835 rooms
- 06 rooms
- 07 rooms
- 188 rooms
- 119+ rooms


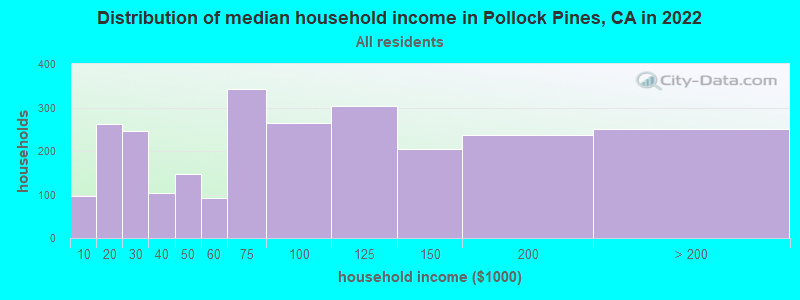
Pollock Pines, CA household income distribution

- 96Less than $10,000
- 263$10,000 to $19,999
- 245$20,000 to $29,999
- 103$30,000 to $39,999
- 147$40,000 to $49,999
- 93$50,000 to $59,999
- 342$60,000 to $74,999
- 264$75,000 to $99,999
- 304$100,000 to $124,999
- 204$125,000 to $149,999
- 236$150,000 to $199,999
- 250$200,000 or more
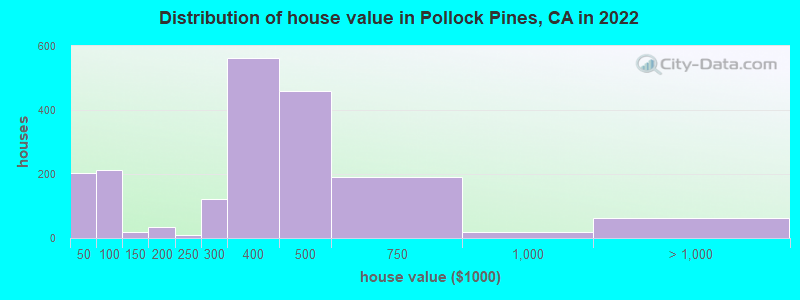
Home value of owner - occupied houses in 2022 in Pollock Pines, CA
-
- 21Less than $10,000
- 31$10,000 to $14,999
- 69$25,000 to $29,999
- 21$35,000 to $39,999
- 60$40,000 to $49,999
- 58$50,000 to $59,999
- 94$60,000 to $69,999
- 18$100,000 to $124,999
- 20$150,000 to $174,999
- 12$175,000 to $199,999
- 8$200,000 to $249,999
- 121$250,000 to $299,999
- 562$300,000 to $399,999
- 460$400,000 to $499,999
- 191$500,000 to $749,999
- 19$750,000 to $999,999
- 35$1,000,000 to $1,499,999
- 27$2,000,000 or more
Rent paid by renters in 2022 in Pollock Pines, CA
-
- 43$450 to $499
- 23$500 to $549
- 192$550 to $599
- 64$600 to $649
- 21$700 to $749
- 99$800 to $899
- 22$900 to $999
- 76$1,000 to $1,249
- 71$1,250 to $1,499
- 21$1,500 to $1,999
- 134No cash rent


Percentage of workers working in this county: 68.7%
Number of people working at home: 372 (14.5% of all workers)
Travel time to work (commute)
- Less than 5 minutes: 45
- 5 to 9 minutes: 145
- 10 to 14 minutes: 70
- 15 to 19 minutes: 215
- 20 to 24 minutes: 385
- 25 to 29 minutes: 217
- 30 to 34 minutes: 424
- 35 to 39 minutes: 60
- 40 to 44 minutes: 74
- 45 to 59 minutes: 219
- 60 to 89 minutes: 171
- 90 or more minutes: 182

Means of transportation to work:
- Drove a car alone: 552 (63.0%)
- Carpooled: 158 (18.0%)
- Bus: 4 (0.5%)
- Walked: 17 (1.9%)
- Worked at home: 246 (28.1%)

- Unemployment by race in 2022
- Unemployment rate for White non-Hispanic residents
- 2.9%Males
- 2.7%Females
- Unemployment rate for other race residents
- 32.9%Males
- Unemployment rate for Hispanic or Latino residents
- 7.1%Males

- Year of entry for the foreign-born population in Pollock Pines, California
- 382010 or later
- 182000 to 2009
- 951990 to 1999
- 341980 to 1989
- 01970 to 1979
- 94Before 1970

First ancestries reported:
- American: 272 (11.5%)
- English: 257 (10.9%)
- European: 190 (8.1%)
- German: 161 (6.8%)
- Italian: 137 (5.8%)
- Scottish: 132 (5.6%)
- Irish: 51 (2.2%)
- Portuguese: 37 (1.6%)
- Polish: 29 (1.2%)
- Welsh: 28 (1.2%)
- Dutch: 27 (1.1%)
- Norwegian: 24 (1.0%)
- Swedish: 24 (1.0%)
- Scotch-Irish: 23 (1.0%)
- Czechoslovakian: 20 (0.8%)
- British: 19 (0.8%)
- Canadian: 16 (0.7%)
- Finnish: 12 (0.5%)
- Danish: 8 (0.3%)
- Scandinavian: 5 (0.2%)
- Swiss: 4 (0.2%)
Most common places of birth for foreign-born residents (%):
| Pollock Pines: | 55.0% (104) |
| California: | 37.2% (3,881,193) |
| Pollock Pines: | 10.1% (19) |
| California: | 0.7% (73,304) |
| Pollock Pines: | 10.1% (19) |
| California: | 0.2% (21,276) |
| Pollock Pines: | 9.5% (18) |
| California: | 7.8% (818,297) |
| Pollock Pines: | 9.0% (17) |
| California: | 0.6% (57,953) |
| Pollock Pines: | 5.8% (11) |
| California: | 4.9% (512,335) |
Place of birth for U.S.-born residents:
- This state: 4,289
- Other state: 1,346
- Northeast: 241
- Midwest: 411
- South: 262
- West: 429
84.1% of Pollock Pines residents lived in the same house 1 years ago.
Out of people who lived in different houses, 43.8% lived in this county.
Out of people who lived in different counties, 72.9% lived in California.
| Pollock Pines: | 84.1% |
| State average: | 88.9% |
Education attainment for males 25 years and older:
- No schooling: 52
- Nursery to 4th grade: 0
- 5th and 6th grade: 0
- 7th and 8th grade: 0
- 9th grade: 32
- 10th grade: 31
- 11th grade: 23
- 12th grade, no diploma: 68
- High school graduate (or equivalency): 714
- Less than 1 year of college: 116
- Some college more than 1 year, no degree: 660
- Associate degree: 221
- Bachelor's degree: 293
- Master's degree: 83
- Professional school degree: 78
- Doctorate degree: 31

Education attainment for females 25 years and older:
- No schooling: 31
- Nursery to 4th grade: 0
- 5th and 6th grade: 0
- 7th and 8th grade: 0
- 9th grade: 16
- 10th grade: 0
- 11th grade: 12
- 12th grade, no diploma: 46
- High school graduate (or equivalency): 574
- Less than 1 year of college: 183
- Some college more than 1 year, no degree: 451
- Associate degree: 256
- Bachelor's degree: 318
- Master's degree: 168
- Professional school degree: 37
- Doctorate degree: 33


Housing units in structures:
- One, detached: 2,563
- One, attached: 18
- Two: 262
- 5 to 9: 20
- 10 to 19: 34
- Mobile homes: 486
- Boats, RVs, vans, etc.: 51
Median worth of mobile homes: $78,453
Housing units lacking complete kitchen facilities in 2022: 1.4%
House/condo owner moved in on average 8 years ago
Renter moved in on average 2 years ago

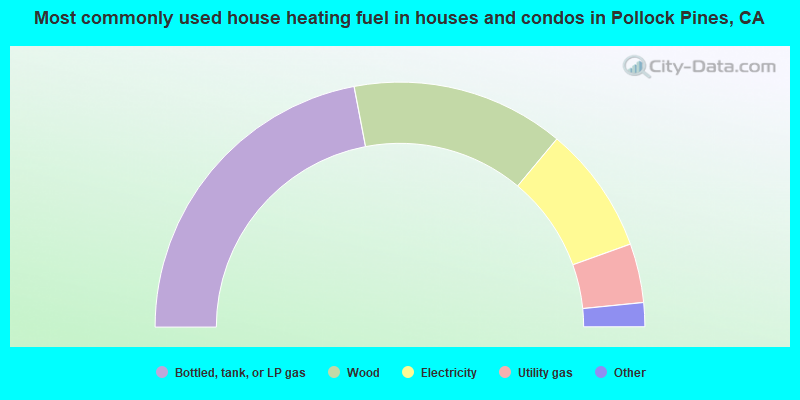
- 44.1%Bottled, tank, or LP gas
- 28.2%Wood
- 16.9%Electricity
- 7.8%Utility gas
- 2.3%Other fuel
- 0.8%No fuel used
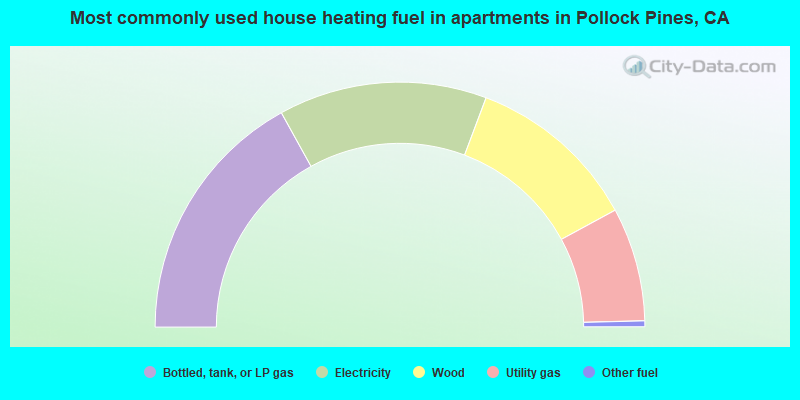
- 33.9%Bottled, tank, or LP gas
- 27.5%Electricity
- 22.7%Wood
- 15.0%Utility gas
- 0.8%Other fuel
Private vs. public school enrollment:
| Here: | 3.2% |
| California: | 10.5% |
| Here: | 20.1% |
| California: | 8.5% |
| Here: | 4.1% |
| California: | 15.9% |


