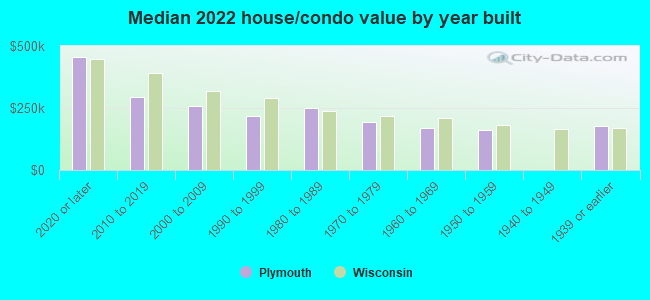
Plymouth, WI (Wisconsin) Houses and Residents
| Plymouth: | $192,929 |
| Wisconsin: | $252,800 |
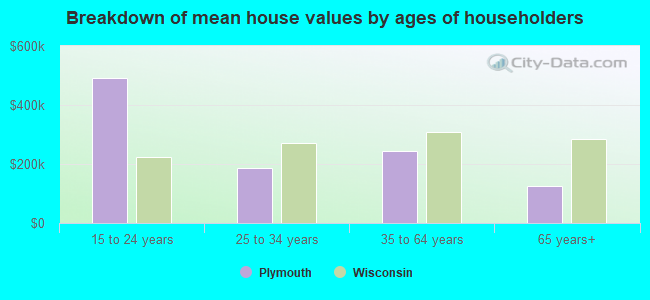
Mean price in 2022:
Detached houses: $221,687
Here: $221,687 State: $308,468 Townhouses or other attached units: $235,718
Here: $235,718 State: $265,873 In 2-unit structures: $158,681
Here: $158,681 State: $203,667 In 5-or-more-unit structures: $144,205
Here: $144,205 State: $280,537 Mobile homes: $19,021
Here: $19,021 State: $79,042
Total population: 8,433 (Urban population: 7,819 (all inside urban clusters), Rural population: 8 (all nonfarm))
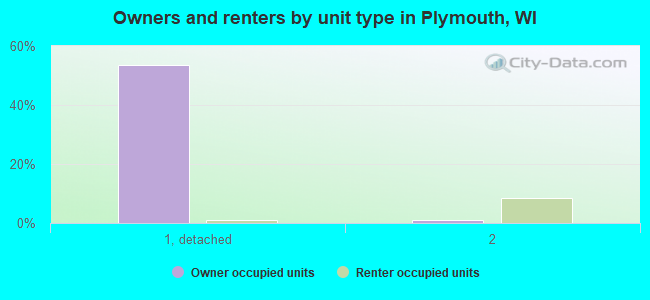
Houses: 4,203 (4,043 occupied: 2,737 owner occupied, 1,396 renter occupied)
| % of renters here: | 34% |
| State: | 32% |
Housing density: 1,024 houses/condos per square mile
Median price asked for vacant for-sale houses and condos in 2022 in this county: $153,924.
Median contract rent in 2022: $702 (lower quartile is $614, upper quartile is $885)
Median rent asked for vacant for-rent units in 2022: $386
Median gross rent in Plymouth, WI in 2022: $866
Housing units in Plymouth with a mortgage: 1,400 (120 second mortgage, 0 home equity loan, 105 both second mortgage and home equity loan)
Houses without a mortgage: 19
Median household income for houses/condos with a mortgage: $102,462
Median household income for apartments without a mortgage: $51,166
Median monthly housing costs: $857
Compare current foreclosures near Plymouth, WI:
| Photo | Address | Area | Beds / Baths | Price | Details |
|---|---|---|---|---|---|

|
#1
1/2 W Main St
Plymouth, WI 53073
|
- sq. feet
|
- baths - beds |
show details | |

|
#2
Appleton St Apt 212
Plymouth, WI 53073
|
- sq. feet
|
- baths - beds |
show details | |

|
#3
County Road Oj
Plymouth, WI 53073
|
- sq. feet
|
- baths - beds |
show details | |

|
#4
Reed St
Plymouth, WI 53073
|
- sq. feet
|
- baths - beds |
show details | |

|
#5
Hillwind Rd
Plymouth, WI 53073
|
- sq. feet
|
- baths - beds |
show details | |

|
#6
Reed St Apt B
Plymouth, WI 53073
|
- sq. feet
|
- baths - beds |
show details | |

|
#7
Zephyr Rd
Plymouth, WI 53073
|
- sq. feet
|
- baths - beds |
show details | |

|
#8
North St
Plymouth, WI 53073
|
- sq. feet
|
- baths - beds |
show details | |

|
#9
Middle St
Plymouth, WI 53073
|
- sq. feet
|
- baths - beds |
show details | |

|
#10
Park St
Plymouth, WI 53073
|
- sq. feet
|
- baths - beds |
show details |
| Photo | Address | Area | Beds / Baths | Price | Details |
|---|---|---|---|---|---|

|
#11
Kensington Ave
Plymouth, WI 53073
|
- sq. feet
|
- baths - beds |
show details | |

|
#12
Mockingbird Ln
Plymouth, WI 53073
|
- sq. feet
|
- baths - beds |
show details | |

|
#13
S Milwaukee St
Plymouth, WI 53073
|
- sq. feet
|
- baths - beds |
show details | |

|
#14
Eastern Ave
Plymouth, WI 53073
|
- sq. feet
|
- baths - beds |
show details | |

|
#15
Mccolm St
Plymouth, WI 53073
|
- sq. feet
|
- baths - beds |
show details | |

|
#16
Leavens Ave
Sheboygan Falls, WI 53085
|
1,568 sq. feet
|
2 baths 4 beds |
show details | |

|
#17
N 15th St
Sheboygan, WI 53081
|
980 sq. feet
|
1 baths 3 beds |
show details | |

|
#18
Macarthur Ave
Sheboygan, WI 53083
|
1,500 sq. feet
|
1 baths 4 beds |
show details | |

|
#19
N 24th St
Sheboygan, WI 53083
|
1,050 sq. feet
|
1 baths 3 beds |
show details | |

|
#20
S 22nd St
Sheboygan, WI 53081
|
1,470 sq. feet
|
1 baths 4 beds |
show details |
| Photo | Address | Area | Beds / Baths | Price | Details |
|---|---|---|---|---|---|

|
#21
Georgia Ave
Sheboygan, WI 53081
|
1,248 sq. feet
|
1 baths 3 beds |
show details | |

|
#22
S 22nd St
Sheboygan, WI 53081
|
1,542 sq. feet
|
2 baths 4 beds |
show details | |

|
#23
Broadway Ave
Sheboygan, WI 53081
|
1,194 sq. feet
|
2 baths 2 beds |
show details | |

|
#24
S 21st St
Sheboygan, WI 53081
|
1,170 sq. feet
|
1 baths 3 beds |
show details | |

|
#25
N 21st St
Sheboygan, WI 53083
|
2,189 sq. feet
|
2 baths 4 beds |
show details | |

|
#26
S 19th St
Sheboygan, WI 53081
|
1,311 sq. feet
|
1 baths 3 beds |
show details | |

|
#27
S 19th St
Sheboygan, WI 53081
|
1,032 sq. feet
|
1 baths 3 beds |
show details | |

|
#28
S 19th St
Sheboygan, WI 53081
|
1,104 sq. feet
|
1 baths 3 beds |
show details | |

|
#29
Heller Ave
Sheboygan, WI 53081
|
2,408 sq. feet
|
2 baths 6 beds |
show details | |

|
#30
North Ave
Sheboygan, WI 53083
|
1,252 sq. feet
|
1 baths 4 beds |
show details |
| Photo | Address | Area | Beds / Baths | Price | Details |
|---|---|---|---|---|---|

|
#31
S 15th St
Sheboygan, WI 53081
|
1,189 sq. feet
|
1 baths 3 beds |
show details | |

|
#32
Leon Ct
Sheboygan, WI 53081
|
1,176 sq. feet
|
1 baths 3 beds |
show details | |

|
#33
S 11th St
Sheboygan, WI 53081
|
1,355 sq. feet
|
1 baths 3 beds |
show details | |

|
#34
S 14th St
Sheboygan, WI 53081
|
1,741 sq. feet
|
1 baths 6 beds |
show details | |

|
#35
Z Ct
Sheboygan, WI 53083
|
1,540 sq. feet
|
1 baths 3 beds |
show details | |

|
#36
N 4th St
Sheboygan, WI 53081
|
1,376 sq. feet
|
1 baths 3 beds |
show details | |

|
#37
Niagara Ave
Sheboygan, WI 53081
|
2,356 sq. feet
|
2 baths 4 beds |
show details | |

|
#38
Superior Ave
Sheboygan, WI 53081
|
1,495 sq. feet
|
1 baths 3 beds |
show details | |

|
#39
Whitcomb Ave
Sheboygan, WI 53081
|
1,331 sq. feet
|
1 baths 2 beds |
show details | |

|
#40
N 8th St
Sheboygan, WI 53081
|
1,428 sq. feet
|
1 baths 3 beds |
show details |
| Photo | Address | Area | Beds / Baths | Price | Details |
|---|---|---|---|---|---|

|
#41
N 9th St
Sheboygan, WI 53083
|
1,356 sq. feet
|
1 baths 3 beds |
show details | |

|
#42
Washington Ave
Sheboygan, WI 53081
|
864 sq. feet
|
1 baths 2 beds |
show details | |

|
#43
S 13th St
Sheboygan, WI 53081
|
1,361 sq. feet
|
1 baths 3 beds |
show details | |

|
#44
N 9th St
Sheboygan, WI 53081
|
2,186 sq. feet
|
2 baths 4 beds |
show details | |

|
#45
Georgia Ave
Sheboygan, WI 53081
|
1,130 sq. feet
|
1 baths 3 beds |
show details | |

|
#46
N 30th St
Sheboygan, WI 53081
|
1,272 sq. feet
|
2 baths 3 beds |
show details | |

|
#47
Pershing Ave
Sheboygan, WI 53083
|
1,008 sq. feet
|
1 baths 3 beds |
show details | |

|
#48
Oakland Ave
Sheboygan, WI 53081
|
1,233 sq. feet
|
1 baths 3 beds |
show details | |

|
#49
Erie Ave
Sheboygan, WI 53081
|
1,230 sq. feet
|
1 baths 3 beds |
show details | |

|
Check over 1 million property listings on Foreclosure.com!
|
browse all offers | |||

Latest news about housing in Plymouth, WI collected exclusively by city-data.com from local newspapers, TV, and radio stations

 | Tell me about (surrounding) Milwaukee area - potential relocation (32 replies) |
| Sheboygan vs Manitowoc/Two Rivers (7 replies) |
| Is Milwaukee really that dangerous? (130 replies) |
| Why does Milwaukee STILL have a cruising problem? (23 replies) |
| moving to Wisconsin from the UK (13 replies) |
| Moving to Sheboygan wi (27 replies) |
Median year apartment built: 1972
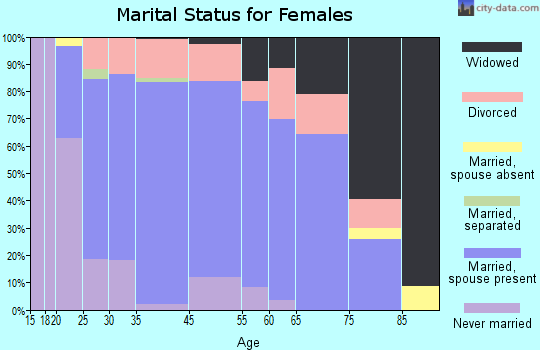
Household type by relationship:
Households: 8,914- Male householders: 1,905 (546 living alone), Female householders: 2,108 (984 living alone)
1,721 spouses (1,694 opposite-sex spouses), 357 unmarried partners, (319 opposite-sex unmarried partners), 2,406 children (2,347 natural, 0 adopted, 58 stepchildren), 153 grandchildren, 1 brothers or sisters, 0 parents, 0 foster children, 29 other relatives, 133 non-relatives
- In group quarters: 99
Size of family households: 1,320 2-persons, 349 3-persons, 363 4-persons, 165 5-persons, 83 6-persons, 10 7-or-more-persons.
Size of nonfamily households: 1,526 1-person, 301 2-persons, 6 4-persons.
1,079 married couples with children.
642 single-parent households (22 men, 620 women).
98.4% of residents of Plymouth speak English at home.
0.6% of residents speak Spanish at home (72% speak English very well, 22% speak English well, 6% speak English not well).
0.6% of residents speak other Indo-European language at home (67% speak English very well, 33% speak English well).
0.6% of residents speak Asian or Pacific Island language at home (56% speak English very well, 44% speak English well).
Foreign born population: 120 (1.3%)
(58.3% of them are naturalized citizens)
| Here: | 6.6 |
| State: | 6.5 |
| Here: | 4.1 |
| State: | 4.1 |
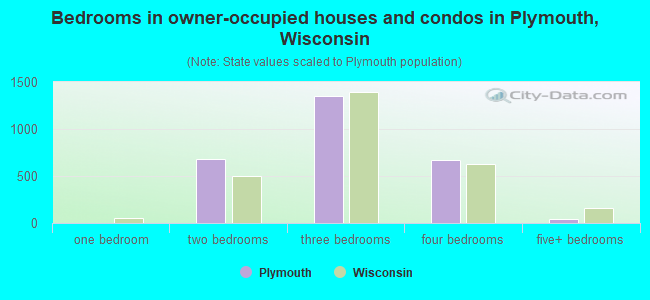
- Bedrooms in owner-occupied houses and condos in Plymouth, Wisconsin
- 0no bedroom
- 01 bedroom
- 6832 bedrooms
- 1,3473 bedrooms
- 6654 bedrooms
- 425+ bedrooms
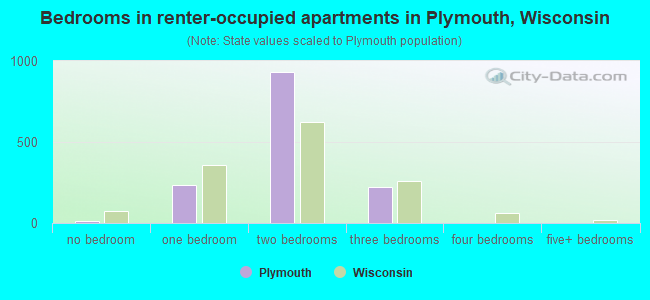
- Bedrooms in renter-occupied apartments in Plymouth, Wisconsin
- 10no bedroom
- 2321 bedroom
- 9312 bedrooms
- 2243 bedrooms
- 04 bedrooms
- 05+ bedrooms
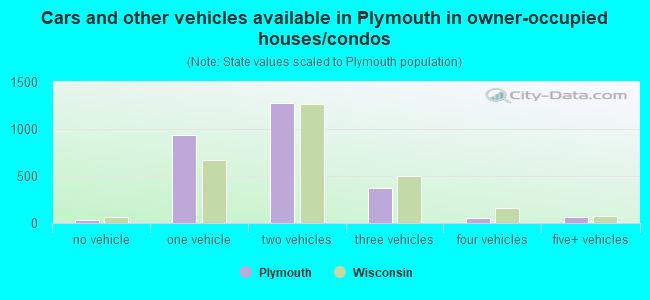
- Cars and other vehicles available in Plymouth in owner-occupied houses/condos
- 32no vehicle
- 9411 vehicle
- 1,2782 vehicles
- 3713 vehicles
- 554 vehicles
- 615+ vehicles
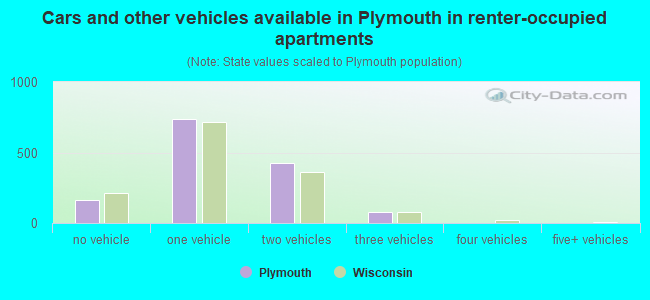
- Cars and other vehicles available in Plymouth in renter-occupied apartments
- 161no vehicle
- 7351 vehicle
- 4262 vehicles
- 753 vehicles
- 04 vehicles
- 05+ vehicles
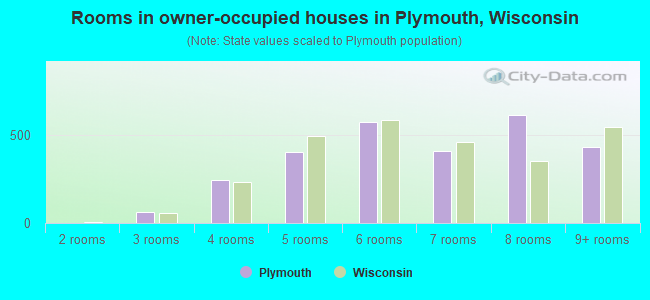
- Rooms in owner-occupied houses in Plymouth, Wisconsin
- 01 room
- 02 rooms
- 633 rooms
- 2454 rooms
- 4025 rooms
- 5736 rooms
- 4077 rooms
- 6138 rooms
- 4349+ rooms
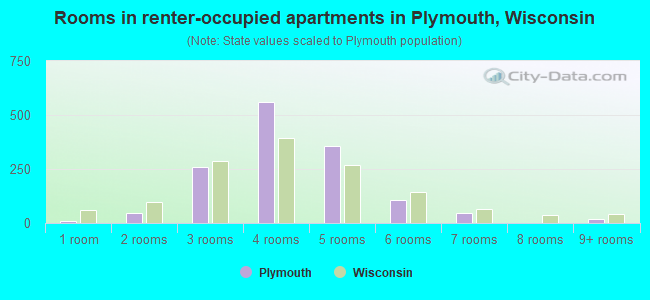
- Rooms in renter-occupied apartments in Plymouth, Wisconsin
- 101 room
- 462 rooms
- 2573 rooms
- 5584 rooms
- 3565 rooms
- 1086 rooms
- 447 rooms
- 08 rooms
- 189+ rooms
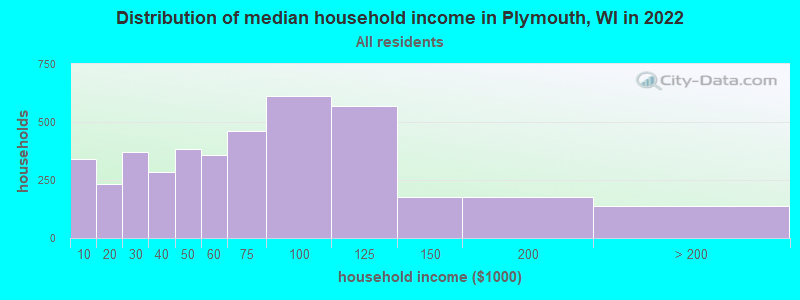
Plymouth, WI household income distribution

- 342Less than $10,000
- 234$10,000 to $19,999
- 369$20,000 to $29,999
- 284$30,000 to $39,999
- 383$40,000 to $49,999
- 357$50,000 to $59,999
- 460$60,000 to $74,999
- 614$75,000 to $99,999
- 567$100,000 to $124,999
- 175$125,000 to $149,999
- 177$150,000 to $199,999
- 140$200,000 or more
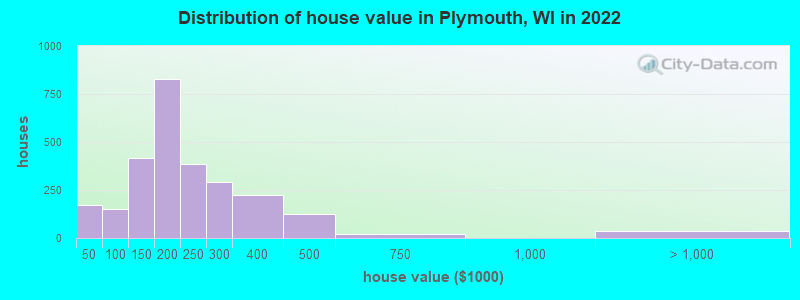
Home value of owner - occupied houses in 2022 in Plymouth, WI
-
- 46Less than $10,000
- 42$10,000 to $14,999
- 38$15,000 to $19,999
- 27$20,000 to $24,999
- 7$25,000 to $29,999
- 8$30,000 to $34,999
- 8$50,000 to $59,999
- 6$60,000 to $69,999
- 20$70,000 to $79,999
- 23$80,000 to $89,999
- 92$90,000 to $99,999
- 247$100,000 to $124,999
- 171$125,000 to $149,999
- 476$150,000 to $174,999
- 349$175,000 to $199,999
- 383$200,000 to $249,999
- 289$250,000 to $299,999
- 224$300,000 to $399,999
- 123$400,000 to $499,999
- 22$500,000 to $749,999
- 36$1,000,000 to $1,499,999
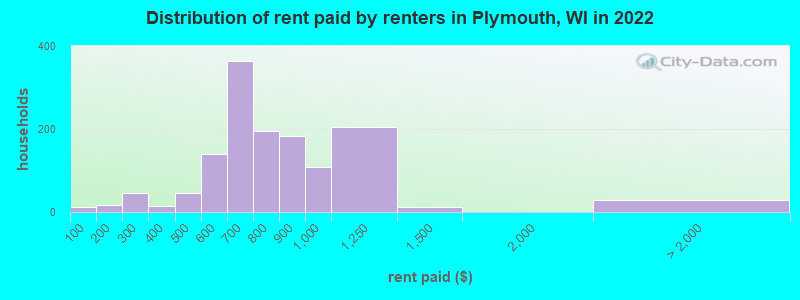
Rent paid by renters in 2022 in Plymouth, WI
-
- 12Less than $100
- 17$100 to $149
- 13$200 to $249
- 32$250 to $299
- 9$300 to $349
- 5$350 to $399
- 46$400 to $449
- 119$500 to $549
- 20$550 to $599
- 242$600 to $649
- 122$650 to $699
- 61$700 to $749
- 135$750 to $799
- 181$800 to $899
- 107$900 to $999
- 206$1,000 to $1,249
- 10$1,250 to $1,499
- 3$3,500 or more
- 27No cash rent
Percentage of workers working in this county: 88.0%
Number of people working at home: 376 (8.7% of all workers)
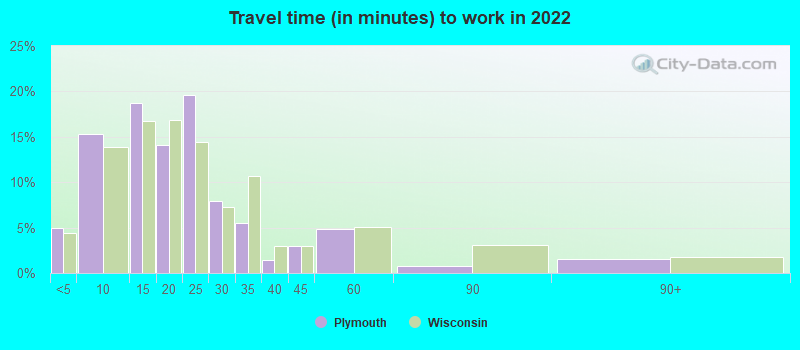
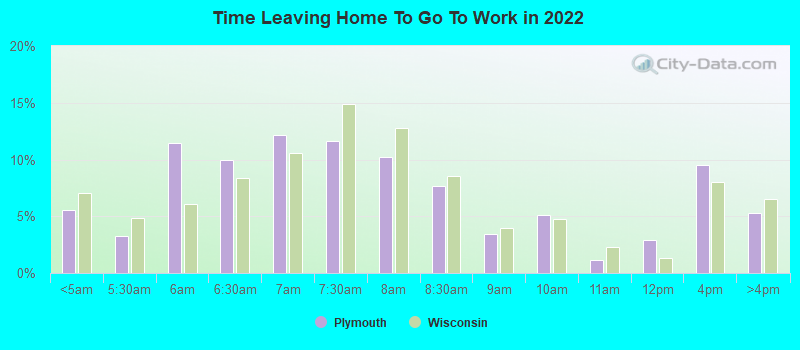
Travel time to work (commute)
- Less than 5 minutes: 271
- 5 to 9 minutes: 894
- 10 to 14 minutes: 589
- 15 to 19 minutes: 605
- 20 to 24 minutes: 810
- 25 to 29 minutes: 180
- 30 to 34 minutes: 148
- 35 to 39 minutes: 88
- 40 to 44 minutes: 104
- 45 to 59 minutes: 38
- 60 to 89 minutes: 90
- 90 or more minutes: 26
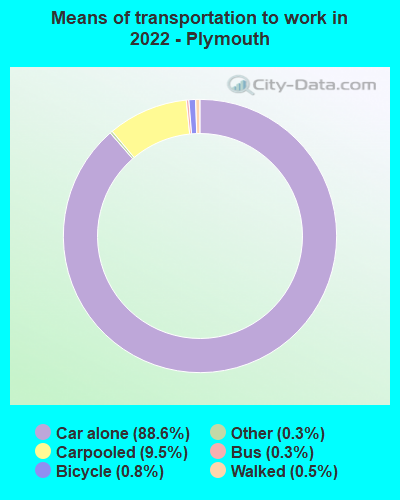
Means of transportation to work:
- Drove a car alone: 4,211 (80.2%)
- Carpooled: 497 (9.5%)
- Bus: 13 (0.2%)
- Taxi: 16 (0.3%)
- Bicycle: 37 (0.7%)
- Walked: 25 (0.5%)
- Worked at home: 376 (7.2%)
- Unemployment by race in 2022
- Unemployment rate for White non-Hispanic residents
- 5.9%Males
- Unemployment rate for Black residents
- 100.0%Females
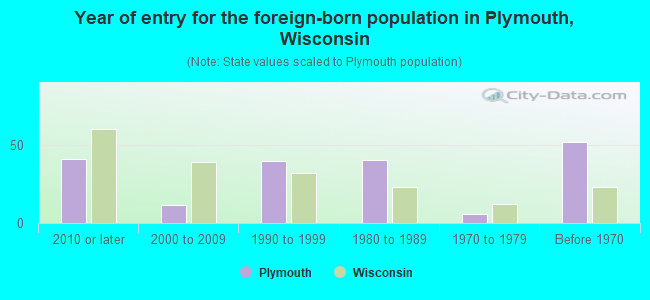
- Year of entry for the foreign-born population in Plymouth, Wisconsin
- 412010 or later
- 122000 to 2009
- 391990 to 1999
- 401980 to 1989
- 61970 to 1979
- 52Before 1970
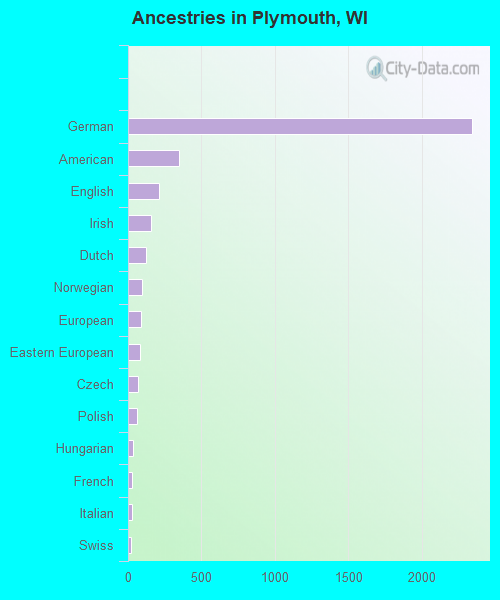
First ancestries reported:
- German: 2,339 (56.3%)
- American: 344 (8.3%)
- English: 210 (5.1%)
- Irish: 154 (3.7%)
- Dutch: 121 (2.9%)
- Norwegian: 95 (2.3%)
- European: 89 (2.1%)
- Eastern European: 83 (2.0%)
- Czech: 65 (1.6%)
- Polish: 64 (1.5%)
- Hungarian: 36 (0.9%)
- French: 29 (0.7%)
- Italian: 26 (0.6%)
- Swiss: 22 (0.5%)
- Finnish: 14 (0.3%)
- Luxembourger: 14 (0.3%)
- Slovak: 11 (0.3%)
- Swedish: 10 (0.2%)
- Austrian: 9 (0.2%)
- Scottish: 7 (0.2%)
Most common places of birth for foreign-born residents (%):
| Plymouth: | 34.6% (46) |
| Wisconsin: | 0.8% (2,478) |
| Plymouth: | 29.3% (39) |
| Wisconsin: | 0.2% (571) |
| Plymouth: | 13.5% (18) |
| Wisconsin: | 0.1% (354) |
| Plymouth: | 6.0% (8) |
| Wisconsin: | 2.3% (6,747) |
| Plymouth: | 5.3% (7) |
| Wisconsin: | 0.3% (953) |
| Plymouth: | 5.3% (7) |
| Wisconsin: | 3.0% (8,773) |
Place of birth for U.S.-born residents:
- This state: 7,618
- Other state: 1,162
- Northeast: 295
- Midwest: 713
- South: 142
- West: 69
86.8% of Plymouth residents lived in the same house 1 years ago.
Out of people who lived in different houses, 37.8% lived in this county.
Out of people who lived in different counties, 86.0% lived in Wisconsin.
| Plymouth: | 86.8% |
| State average: | 87.7% |
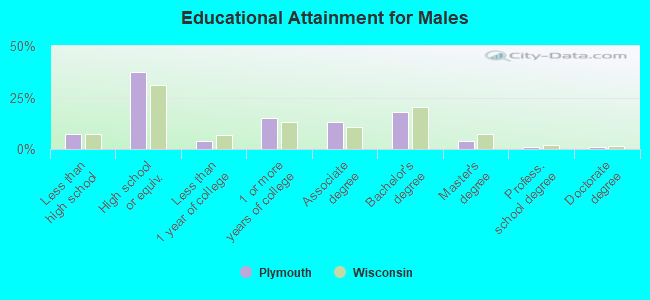
Education attainment for males 25 years and older:
- No schooling: 14
- Nursery to 4th grade: 0
- 5th and 6th grade: 0
- 7th and 8th grade: 0
- 9th grade: 0
- 10th grade: 25
- 11th grade: 113
- 12th grade, no diploma: 62
- High school graduate (or equivalency): 1,099
- Less than 1 year of college: 109
- Some college more than 1 year, no degree: 437
- Associate degree: 382
- Bachelor's degree: 531
- Master's degree: 119
- Professional school degree: 27
- Doctorate degree: 25
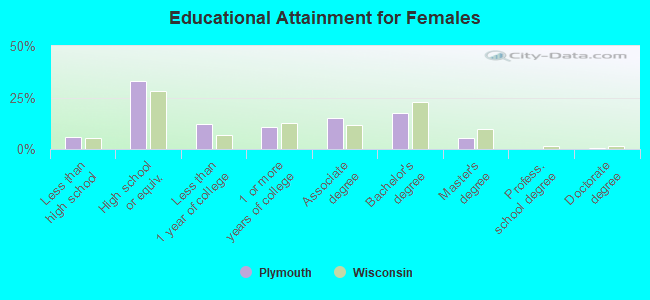
Education attainment for females 25 years and older:
- No schooling: 0
- Nursery to 4th grade: 0
- 5th and 6th grade: 0
- 7th and 8th grade: 9
- 9th grade: 0
- 10th grade: 9
- 11th grade: 75
- 12th grade, no diploma: 102
- High school graduate (or equivalency): 1,136
- Less than 1 year of college: 424
- Some college more than 1 year, no degree: 370
- Associate degree: 517
- Bachelor's degree: 600
- Master's degree: 186
- Professional school degree: 0
- Doctorate degree: 18
Housing units in structures:
- One, detached: 2,191
- One, attached: 346
- Two: 475
- 3 or 4: 220
- 5 to 9: 286
- 10 to 19: 302
- 20 to 49: 194
- 50 or more: 80
- Mobile homes: 104
Median worth of mobile homes: $20,155
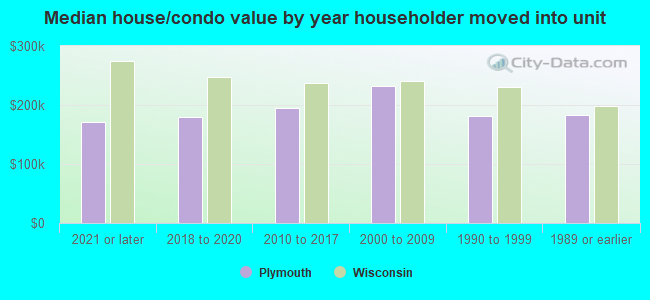
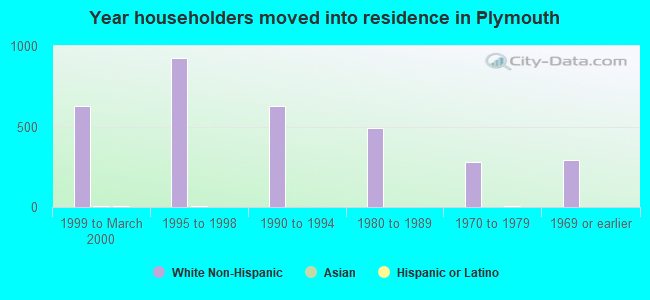
House/condo owner moved in on average 14 years ago
Renter moved in on average 2 years ago
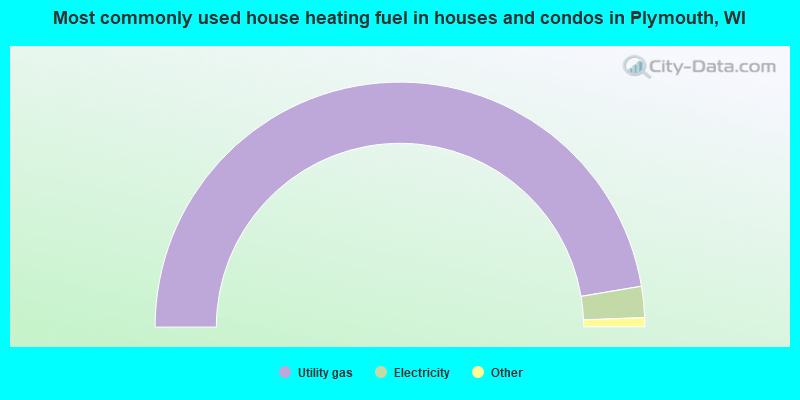
- 94.7%Utility gas
- 4.1%Electricity
- 0.5%Wood
- 0.4%Fuel oil, kerosene, etc.
- 0.3%Bottled, tank, or LP gas
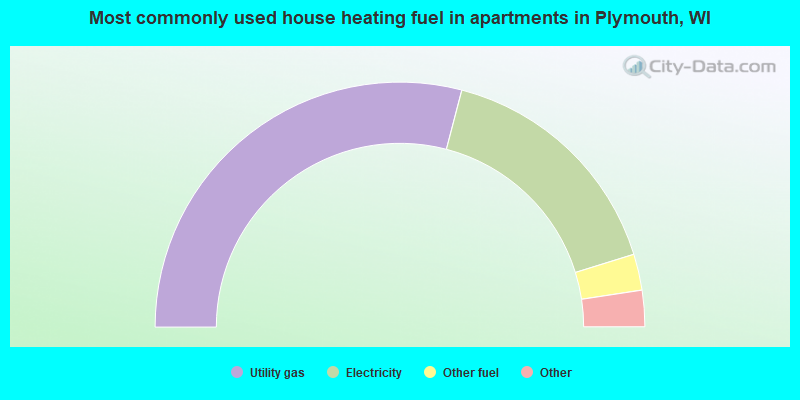
- 58.2%Utility gas
- 32.3%Electricity
- 4.8%Other fuel
- 3.4%No fuel used
- 1.3%Bottled, tank, or LP gas
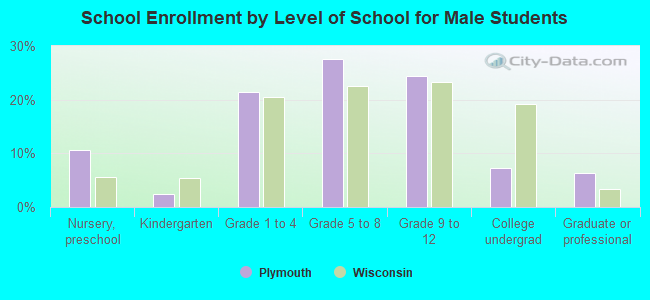
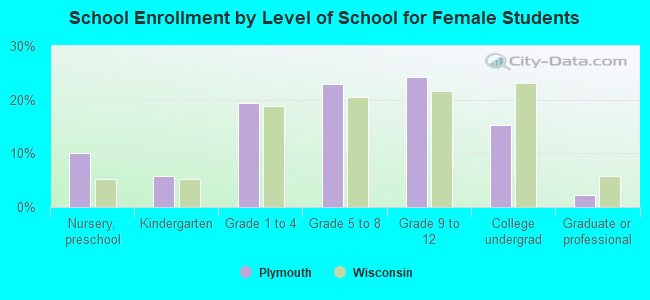
Private vs. public school enrollment:
| Here: | 11.9% |
| Wisconsin: | 16.7% |
| Here: | 15.6% |
| Wisconsin: | 12.5% |
| Here: | 52.2% |
| Wisconsin: | 17.5% |