Plymouth, MN (Minnesota) Houses and Residents
Estimated median house or condo value in 2022: $457,600 (it was $191,100 in 2000 )
Plymouth:
$457,600Minnesota:
$314,600
Lower value quartile - upper value quartile: $330,100 - $647,600Mean price in 2022: Detached houses: $573,803 Here:
$573,803State:
$374,552
Townhouses or other attached units: $382,465 Here:
$382,465State:
$312,049
In 2-unit structures: $327,336 Here:
$327,336State:
$323,045
In 3-to-4-unit structures: $445,734 Here:
$445,734State:
$238,971
In 5-or-more-unit structures: $210,491 Here:
$210,491State:
$258,516
Mobile homes: $71,264 Here:
$71,264State:
$94,605
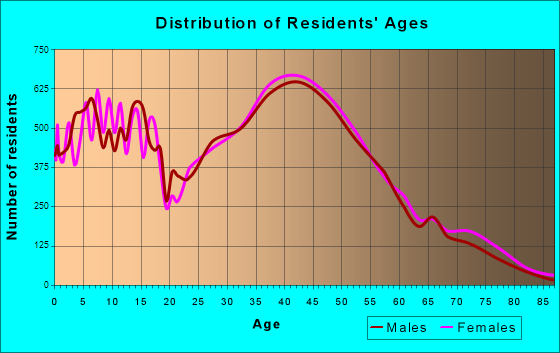
Total population: 75,057 (Urban population: 64,815, Rural population: 1,088 (all nonfarm) )
Houses: 35,503 (35,006 occupied: 26,407 owner occupied, 8,599 renter occupied )
% of renters here:
25%State:
28%
Housing density: 1,079 houses/condos per square mile
Median price asked for vacant for-sale houses and condos in 2022: $189,139.
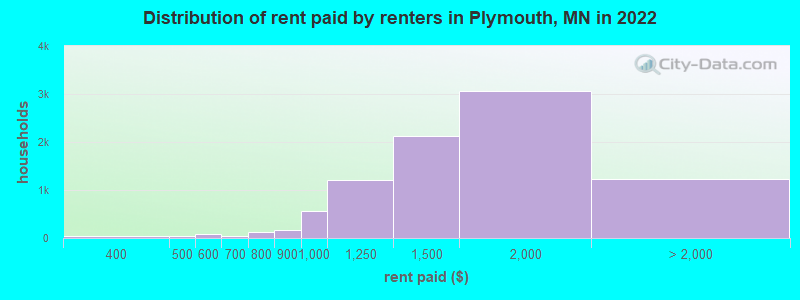
Median contract rent in 2022: $1,489 (lower quartile is $1,293, upper quartile is $1,817)
Median rent asked for vacant for-rent units in 2022: $2,263
Median gross rent in Plymouth, MN in 2022: $1,691
Housing units in Plymouth with a mortgage: 17,188 (2,518 second mortgage, 0 home equity loan, 2,114 both second mortgage and home equity loan )Houses without a mortgage: 219
Median household income for houses/condos with a mortgage: $158,482
Median household income for apartments without a mortgage: $97,642
Median monthly housing costs: $1,684
Data:
Median house or condo value ($)
Median house or condo value ($ change since 2000)
Median house or condo value ($) - White
Median house or condo value ($) - Black or African American
Median house or condo value ($) - Asian
Median house or condo value ($) - Hispanic or Latino
Median house or condo value ($) - American Indian and Alaska Native
Median house or condo value ($) - Multirace
Median house or condo value ($) - Other Race
Median price asked for mobile homes ($)
Household density (households per square mile)
Mean house or condo value by units in structure - 1, detached ($)
Mean house or condo value by units in structure - 1, attached ($)
Mean house or condo value by units in structure - 2 ($)
Mean house or condo value by units in structure by units in structure - 3 or 4 ($)
Mean house or condo value by units in structure - 5 or more ($)
Mean house or condo value by units in structure - Boat, RV, van, etc. ($)
Mean house or condo value by units in structure - Mobile home ($)
Median contract rent ($)
Median contract rent - Lower quartile ($)
Median contract rent - Upper quartile ($)
Median gross rent ($)
Urban houses (%)
Rural houses (%)
Houses occupied (%)
Houses occupied (% change since 2000)
Houses owner occupied (%)
Houses owner occupied (% change since 2000)
Houses renter occupied (%)
Houses renter occupied (% change since 2000)
Vacant housing units - For rent (%)
Vacant housing units - For rent (% change since 2000)
Vacant housing units - For sale only (%)
Vacant housing units - For sale only (% change since 2000)
Vacant housing units - Rented or sold, not occupied (%)
Vacant housing units - Rented or sold, not occupied (% change since 2000)
Vacant housing units - For seasonal, recreational, or occasional use (%)
Vacant housing units - For seasonal, recreational, or occasional use (% change since 2000)
Vacant housing units - For migrant workers (%)
Vacant housing units - For migrant workers (% change since 2000)
Vacant housing units - Other vacant (%)
Vacant housing units - Other vacant (% change since 2000)
Median monthly housing costs ($)
Median household income for houses/condos with a mortgage ($)
Median household income for houses/condos without a mortgage ($)
Median household income ($)
Median household income ($) - White
Median household income ($) - Black or African American
Median household income ($) - Asian
Median household income ($) - Hispanic or Latino
Median household income ($) - American Indian and Alaska Native
Median household income ($) - Multirace
Median household income ($) - Other Race
Mortgage status - with mortgage (%)
Mortgage status - with second mortgage (%)
Mortgage status - with home equity loan (%)
Mortgage status - with both second mortgage and home equity loan (%)
Mortgage status - without a mortgage (%)
Median year house/condo built
Median year apartment built
Household type by relationship - Male householder living alone (%)
Household type by relationship - Male householder not living alone (%)
Household type by relationship - Female householder living alone (%)
Household type by relationship - Female householder not living alone (%)
Household type by relationship - Opposite-Sex spouse (%)
Household type by relationship - Same-Sex spouse (%)
Household type by relationship - Opposite-Sex unmarried partner (%)
Household type by relationship - Same-Sex unmarried partner (%)
Household type by relationship - In group quarters (%)
Size of family households - 2-person household (%)
Size of family households - 3-person household (%)
Size of family households - 4-person household (%)
Size of family households - 5-person household (%)
Size of family households - 6-person household (%)
Size of family households - 7-or-more-person household (%)
Size of nonfamily households - 1-person household (%)
Size of nonfamily households - 2-person household (%)
Size of nonfamily households - 3-person household (%)
Size of nonfamily households - 4-person household (%)
Size of nonfamily households - 5-person household (%)
Size of nonfamily households - 6-person household (%)
Size of nonfamily households - 7-or-moreperson household (%)
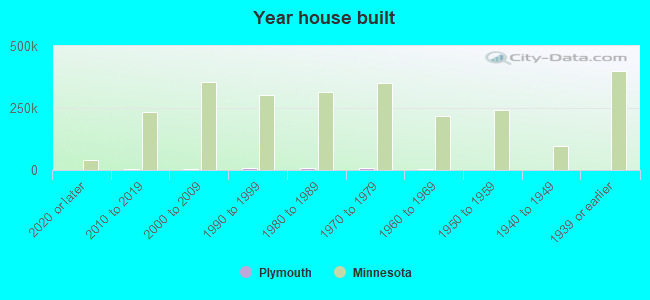
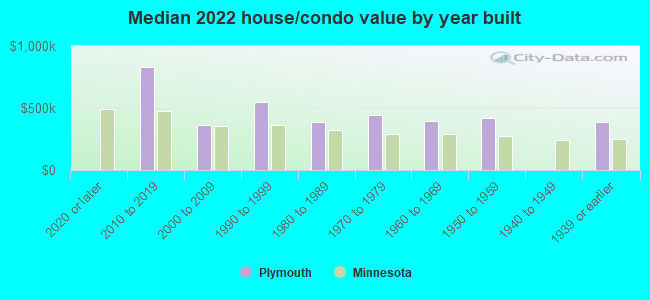
Year house built - Built 2010 or later (%)
Year house built - Built 2000 to 2009 (%)
Year house built - Built 1990 to 1999 (%)
Year house built - Built 1980 to 1989 (%)
Year house built - Built 1970 to 1979 (%)
Year house built - Built 1960 to 1969 (%)
Year house built - Built 1950 to 1959 (%)
Year house built - Built 1940 to 1949 (%)
Year house built - Built 1939 or earlier (%)
Median number of rooms in houses and condos
Median number of rooms in apartments
Median number of bedrooms in owner occupied houses
Mean number of bedrooms in owner occupied houses
Median number of bedrooms in renter occupied houses
Mean number of bedrooms in renter occupied houses
Median number of vehichles in owner occupied houses
Mean number of vehichles in owner occupied houses
Median number of vehichles in renter occupied houses
Mean number of vehichles in renter occupied houses
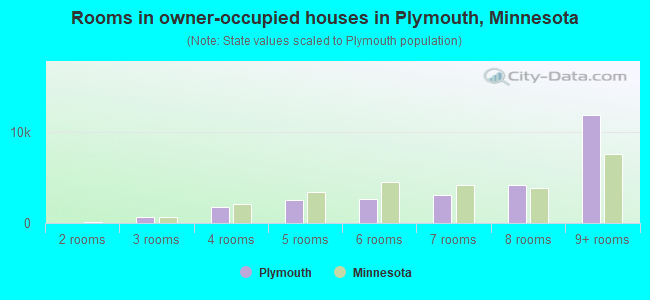
Rooms in owner-occupied houses - 1 room (%)
Rooms in owner-occupied houses - 2 rooms (%)
Rooms in owner-occupied houses - 3 rooms (%)
Rooms in owner-occupied houses - 4 rooms (%)
Rooms in owner-occupied houses - 5 rooms (%)
Rooms in owner-occupied houses - 6 rooms (%)
Rooms in owner-occupied houses - 7 rooms (%)
Rooms in owner-occupied houses - 8 rooms (%)
Rooms in owner-occupied houses - 9+ rooms (%)
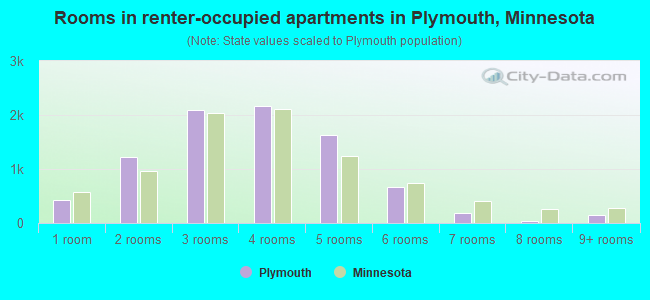
Rooms in renter-occupied houses - 1 room (%)
Rooms in renter-occupied houses - 2 rooms (%)
Rooms in renter-occupied houses - 3 rooms (%)
Rooms in renter-occupied houses - 4 rooms (%)
Rooms in renter-occupied houses - 5 rooms (%)
Rooms in renter-occupied houses - 6 rooms (%)
Rooms in renter-occupied houses - 7 rooms (%)
Rooms in renter-occupied houses - 8 rooms (%)
Rooms in renter-occupied houses - 9+ rooms (%)
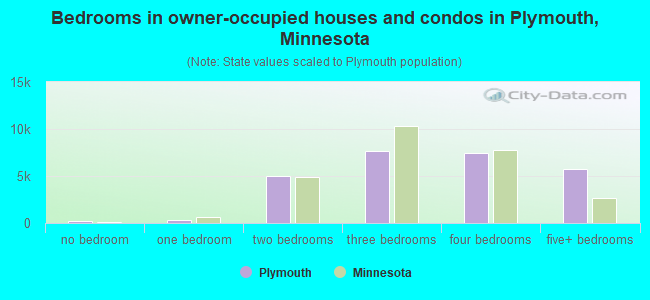
Bedrooms in owner-occupied houses - no bedrooms (%)
Bedrooms in owner-occupied houses - 1 bedroom (%)
Bedrooms in owner-occupied houses - 2 bedrooms (%)
Bedrooms in owner-occupied houses - 3 bedrooms (%)
Bedrooms in owner-occupied houses - 4 bedrooms (%)
Bedrooms in owner-occupied houses - 5+ bedrooms (%)
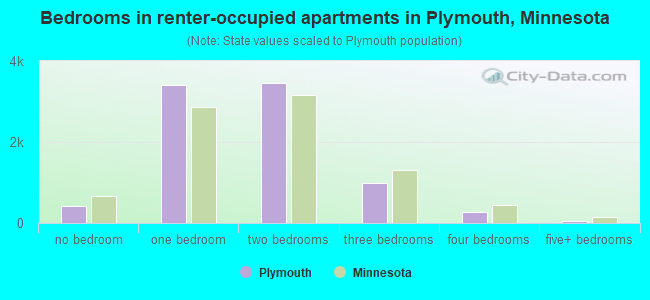
Bedrooms in renter-occupied houses - no bedrooms (%)
Bedrooms in renter-occupied houses - 1 bedroom (%)
Bedrooms in renter-occupied houses - 2 bedrooms (%)
Bedrooms in renter-occupied houses - 3 bedrooms (%)
Bedrooms in renter-occupied houses - 4 bedrooms (%)
Bedrooms in renter-occupied houses - 5+ bedrooms (%)
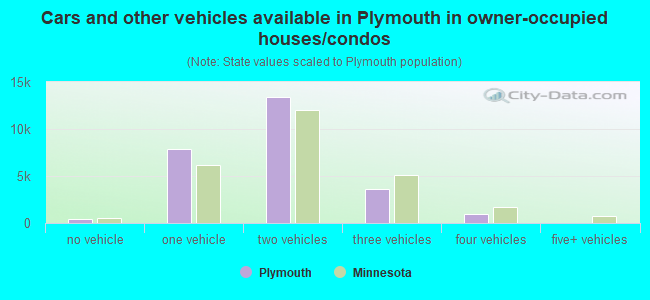
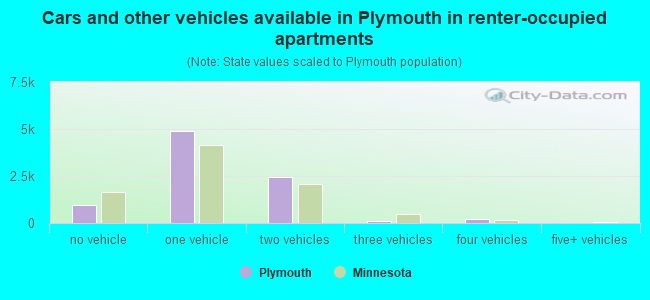
Vehicles available in owner-occupied houses - no vehicle available (%)
Vehicles available in owner-occupied houses - 1 vehicle available(%)
Vehicles available in owner-occupied houses - 2 Vehicles available (%)
Vehicles available in owner-occupied houses - 3 Vehicles available (%)
Vehicles available in owner-occupied houses - 4 Vehicles available (%)
Vehicles available in owner-occupied houses - 5+ Vehicles available (%)
Vehicles available in renter-occupied houses - no vehicle available (%)
Vehicles available in renter-occupied houses - 1 vehicle available (%)
Vehicles available in renter-occupied houses - 2 Vehicles available (%)
Vehicles available in renter-occupied houses - 3 Vehicles available (%)
Vehicles available in renter-occupied houses - 4 Vehicles available (%)
Vehicles available in renter-occupied houses - 5+ Vehicles available (%)
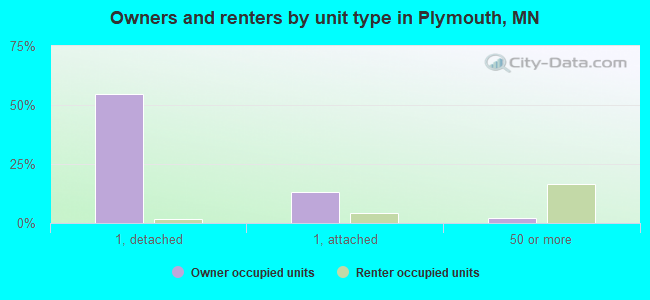
Housing units in structures - 1, detached (%)
Housing units in structures - 1, attached (%)
Housing units in structures - 2 (%)
Housing units in structures - 3 or 4 (%)
Housing units in structures - 5 to 9 (%)
Housing units in structures - 10 to 19 (%)
Housing units in structures - 20 to 49 (%)
Housing units in structures - 50 or more (%)
Housing units in structures - Mobile home (%)
Housing units in structures - Boat, RV, van, etc. (%)
Housing units in structures - Owners - 1, detached (%)
Housing units in structures - Owners - 1, attached (%)
Housing units in structures - Owners - 2 (%)
Housing units in structures - Owners - 3 or 4 (%)
Housing units in structures - Owners - 5 to 9 (%)
Housing units in structures - Owners - 10 to 19 (%)
Housing units in structures - Owners - 20 to 49 (%)
Housing units in structures - Owners - 50 or more (%)
Housing units in structures - Owners - Mobile home (%)
Housing units in structures - Owners - Boat, RV, van, etc. (%)
Housing units in structures - Renters - 1, detached (%)
Housing units in structures - Renters - 1, attached (%)
Housing units in structures - Renters - 2 (%)
Housing units in structures - Renters - 3 or 4 (%)
Housing units in structures - Renters - 5 to 9 (%)
Housing units in structures - Renters - 10 to 19 (%)
Housing units in structures - Renters - 20 to 49 (%)
Housing units in structures - Renters - 50 or more (%)
Housing units in structures - Renters - Mobile home (%)
Housing units in structures - Renters - Boat, RV, van, etc. (%)
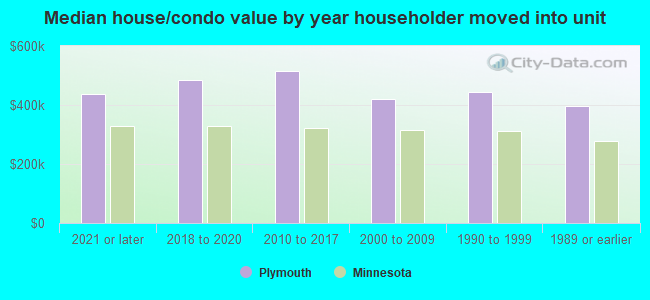
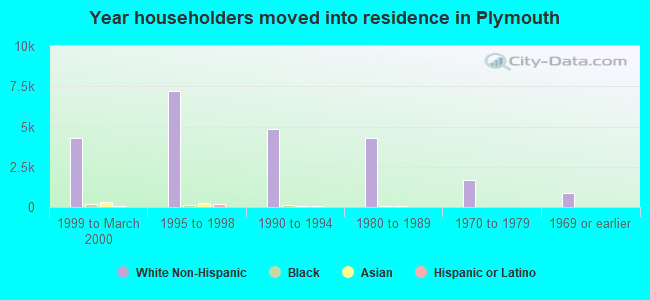
House/condo owner moved in on average (years ago)
Renter moved in on average (years ago)
Year householder moved into unit - Moved in 1999 to March 2000 (%)
Year householder moved into unit - Moved in 1999 to March 2000 (%) - White
Year householder moved into unit - Moved in 1999 to March 2000 (%) - Black or African American
Year householder moved into unit - Moved in 1999 to March 2000 (%) - Asian
Year householder moved into unit - Moved in 1999 to March 2000 (%) - Hispanic or Latino
Year householder moved into unit - Moved in 1999 to March 2000 (%) - American Indian and Alaska Native
Year householder moved into unit - Moved in 1999 to March 2000 (%) - Multirace
Year householder moved into unit - Moved in 1999 to March 2000 (%) - Other Race
Year householder moved into unit - Moved in 1995 to 1998 (%)
Year householder moved into unit - Moved in 1995 to 1998 (%) - White
Year householder moved into unit - Moved in 1995 to 1998 (%) - Black or African American
Year householder moved into unit - Moved in 1995 to 1998 (%) - Asian
Year householder moved into unit - Moved in 1995 to 1998 (%) - Hispanic or Latino
Year householder moved into unit - Moved in 1995 to 1998 (%) - American Indian and Alaska Native
Year householder moved into unit - Moved in 1995 to 1998 (%) - Multirace
Year householder moved into unit - Moved in 1995 to 1998 (%) - Other Race
Year householder moved into unit - Moved in 1990 to 1994 (%)
Year householder moved into unit - Moved in 1990 to 1994 (%) - White
Year householder moved into unit - Moved in 1990 to 1994 (%) - Black or African American
Year householder moved into unit - Moved in 1990 to 1994 (%) - Asian
Year householder moved into unit - Moved in 1990 to 1994 (%) - Hispanic or Latino
Year householder moved into unit - Moved in 1990 to 1994 (%) - American Indian and Alaska Native
Year householder moved into unit - Moved in 1990 to 1994 (%) - Multirace
Year householder moved into unit - Moved in 1990 to 1994 (%) - Other Race
Year householder moved into unit - Moved in 1980 to 1989 (%)
Year householder moved into unit - Moved in 1980 to 1989 (%) - White
Year householder moved into unit - Moved in 1980 to 1989 (%) - Black or African American
Year householder moved into unit - Moved in 1980 to 1989 (%) - Asian
Year householder moved into unit - Moved in 1980 to 1989 (%) - Hispanic or Latino
Year householder moved into unit - Moved in 1980 to 1989 (%) - American Indian and Alaska Native
Year householder moved into unit - Moved in 1980 to 1989 (%) - Multirace
Year householder moved into unit - Moved in 1980 to 1989 (%) - Other Race
Year householder moved into unit - Moved in 1970 to 1979 (%)
Year householder moved into unit - Moved in 1970 to 1979 (%) - White
Year householder moved into unit - Moved in 1970 to 1979 (%) - Black or African American
Year householder moved into unit - Moved in 1970 to 1979 (%) - Asian
Year householder moved into unit - Moved in 1970 to 1979 (%) - Hispanic or Latino
Year householder moved into unit - Moved in 1970 to 1979 (%) - American Indian and Alaska Native
Year householder moved into unit - Moved in 1970 to 1979 (%) - Multirace
Year householder moved into unit - Moved in 1970 to 1979 (%) - Other Race
Year householder moved into unit - Moved in 1969 or earlier (%)
Year householder moved into unit - Moved in 1969 or earlier (%) - White
Year householder moved into unit - Moved in 1969 or earlier (%) - Black or African American
Year householder moved into unit - Moved in 1969 or earlier (%) - Asian
Year householder moved into unit - Moved in 1969 or earlier (%) - Hispanic or Latino
Year householder moved into unit - Moved in 1969 or earlier (%) - American Indian and Alaska Native
Year householder moved into unit - Moved in 1969 or earlier (%) - Multirace
Year householder moved into unit - Moved in 1969 or earlier (%) - Other Race
Housing units lacking complete plumbing facilities (%)
Housing units lacking complete kitchen facilities (%)
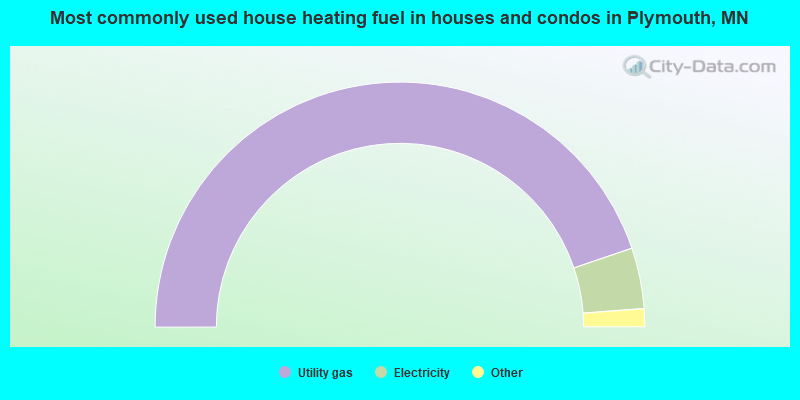
House heating fuel used in houses and condos - Utility gas (%)
House heating fuel used in houses and condos - Bottled, tank, or LP gas (%)
House heating fuel used in houses and condos - Electricity (%)
House heating fuel used in houses and condos - Fuel oil, kerosene, etc. (%)
House heating fuel used in houses and condos - Coal or coke (%)
House heating fuel used in houses and condos - Wood (%)
House heating fuel used in houses and condos - Solar energy (%)
House heating fuel used in houses and condos - Other fuel (%)
House heating fuel used in houses and condos - No fuel used (%)
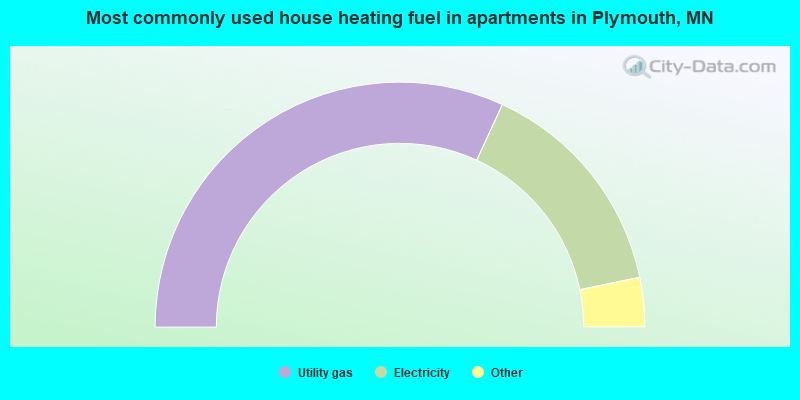
House heating fuel used in apartments - Utility gas (%)
House heating fuel used in apartments - Bottled, tank, or LP gas (%)
House heating fuel used in apartments - Electricity (%)
House heating fuel used in apartments - Fuel oil, kerosene, etc. (%)
House heating fuel used in apartments - Coal or coke (%)
House heating fuel used in apartments - Wood (%)
House heating fuel used in apartments - Solar energy (%)
House heating fuel used in apartments - Other fuel (%)
House heating fuel used in apartments - No fuel used (%)
Latest news about housing in Plymouth, MN collected exclusively by city-data.com from local newspapers, TV, and radio stations
Median year house/condo built: 1988Median year apartment built: 1988Household type by relationship:
Households: 78,669
Male householders: 16,355 (3,900 living alone ), Female householders: 18,651 (7,257 living alone )17,139 spouses (17,013 opposite-sex spouses ), 2,709 unmarried partners , (2,306 opposite-sex unmarried partners ), 19,930 children (19,329 natural , 224 adopted , 377 stepchildren ), 350 grandchildren , 101 brothers or sisters , 702 parents , 0 foster children , 591 other relatives , 1,296 non-relatives In group quarters: 845
Size of family households: 9,964 2-persons , 5,002 3-persons , 4,263 4-persons , 1,582 5-persons , 270 6-persons .
Size of nonfamily households: 11,157 1-person , 2,493 2-persons , 59 3-persons , 216 4-persons .
15,242 married couples with children. single-parent households (458 men , 2,047 women ).
84.1% of residents of Plymouth speak English at home. of residents speak Spanish at home (83% speak English very well , 11% speak English well , 4% speak English not well , 2% don't speak English at all ).of residents speak other Indo-European language at home (79% speak English very well , 16% speak English well , 4% speak English not well ).of residents speak Asian or Pacific Island language at home (82% speak English very well , 15% speak English well , 3% speak English not well ).of residents speak other language at home (76% speak English very well , 23% speak English well , 1% don't speak English at all ).
Foreign born population: 9,555 (12.1%)of them are naturalized citizens )
Median number of rooms in houses and condos:
Median number of rooms in apartments
Owner-occupied Renter-occupied
Rooms in owner-occupied houses in Plymouth, Minnesota
0 1 room 0 2 rooms 618 3 rooms 1,698 4 rooms 2,495 5 rooms 2,576 6 rooms 3,065 7 rooms 4,124 8 rooms 11,831 9+ rooms
Rooms in renter-occupied apartments in Plymouth, Minnesota
426 1 room 1,230 2 rooms 2,088 3 rooms 2,173 4 rooms 1,631 5 rooms 675 6 rooms 185 7 rooms 43 8 rooms 148 9+ rooms
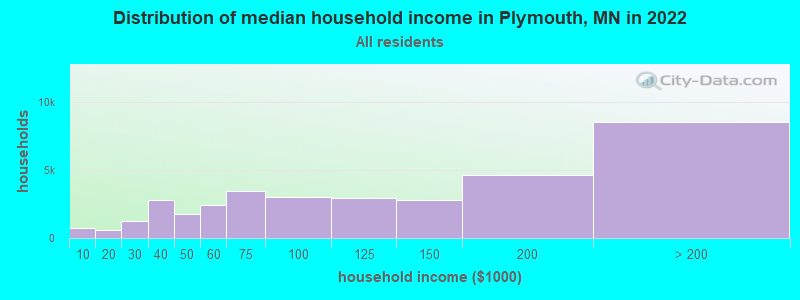
Plymouth, MN household income distribution 771 Less than $10,000611 $10,000 to $19,9991,261 $20,000 to $29,9992,786 $30,000 to $39,9991,761 $40,000 to $49,9992,452 $50,000 to $59,9993,462 $60,000 to $74,9992,998 $75,000 to $99,9992,938 $100,000 to $124,9992,784 $125,000 to $149,9994,660 $150,000 to $199,9998,522 $200,000 or more
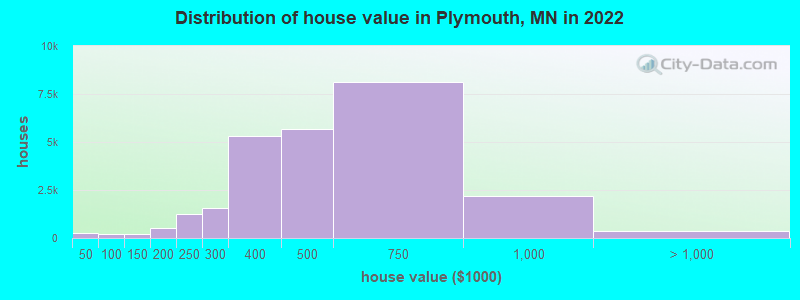
Home value of owner - occupied houses in 2022 in Plymouth, MN 224 Less than $10,0004 $15,000 to $19,99912 $20,000 to $24,99912 $40,000 to $49,99931 $50,000 to $59,99927 $60,000 to $69,99981 $70,000 to $79,99941 $80,000 to $89,99919 $90,000 to $99,99977 $100,000 to $124,999144 $125,000 to $149,999245 $150,000 to $174,999291 $175,000 to $199,9991,260 $200,000 to $249,9991,564 $250,000 to $299,9995,314 $300,000 to $399,9995,683 $400,000 to $499,9998,143 $500,000 to $749,9992,185 $750,000 to $999,999273 $1,000,000 to $1,499,99948 $1,500,000 to $1,999,99954 $2,000,000 or moreRent paid by renters in 2022 in Plymouth, MN 24 $150 to $19915 $200 to $2495 $250 to $29948 $350 to $39919 $400 to $44912 $450 to $49934 $500 to $54949 $550 to $59911 $600 to $64925 $650 to $69984 $700 to $74937 $750 to $799162 $800 to $899569 $900 to $9991,214 $1,000 to $1,2492,124 $1,250 to $1,4993,057 $1,500 to $1,999597 $2,000 to $2,499233 $2,500 to $2,999257 $3,000 to $3,49960 $3,500 or more72 No cash rent
Percentage of workers working in this county: 87.9%Number of people working at home: 12,977 (29.9% of all workers )
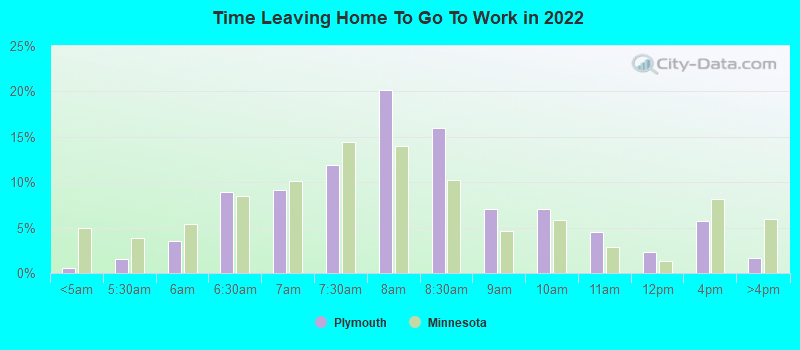
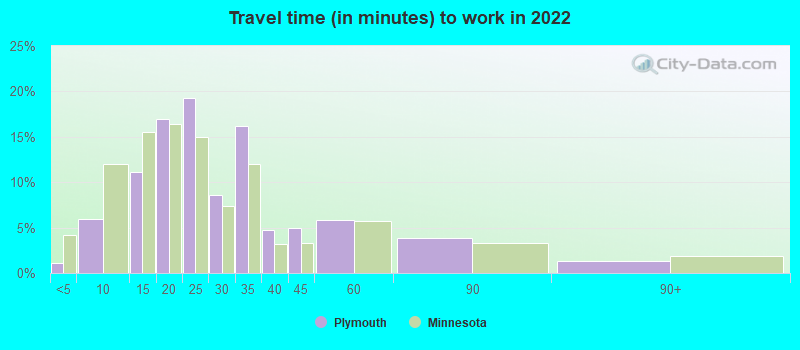
Travel time to work (commute)
Less than 5 minutes: 4555 to 9 minutes: 2,60410 to 14 minutes: 5,15415 to 19 minutes: 5,17620 to 24 minutes: 4,57425 to 29 minutes: 3,27630 to 34 minutes: 4,18835 to 39 minutes: 1,29040 to 44 minutes: 96745 to 59 minutes: 1,08660 to 89 minutes: 48290 or more minutes: 78
Means of transportation to work:
Drove a car alone: 40,461 (69.4%)Carpooled: 4,214 (7.2%)Bus : 249 (0.4%)Subway or elevated rail : 31 (0.1%)Light rail, streetcar or trolley : 86 (0.1%)Taxi: 1,039 (1.8%)Bicycle: 129 (0.2%)Walked: 464 (0.8%)Worked at home: 12,977 (22.3%)
Unemployment by race in 2022
Unemployment rate for White non-Hispanic residents 4.0% Males0.5% FemalesUnemployment rate for Black residents 1.0% Males4.9% FemalesUnemployment rate for Asian residents 0.7% Males1.3% FemalesUnemployment rate for other race residents 4.1% Males3.5% FemalesUnemployment rate for two or more race residents 3.4% Males2.0% FemalesUnemployment rate for Hispanic or Latino residents 2.8% Males
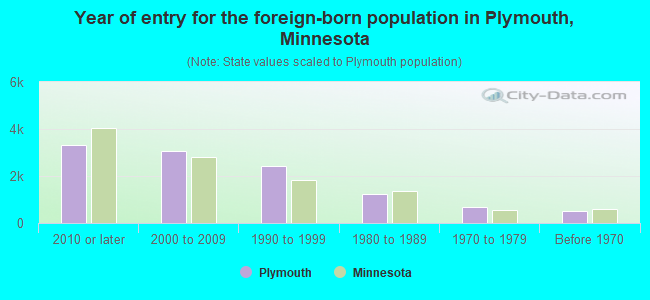
Year of entry for the foreign-born population in Plymouth, Minnesota
3,324 2010 or later 3,052 2000 to 2009 2,422 1990 to 1999 1,214 1980 to 1989 678 1970 to 1979 509 Before 1970
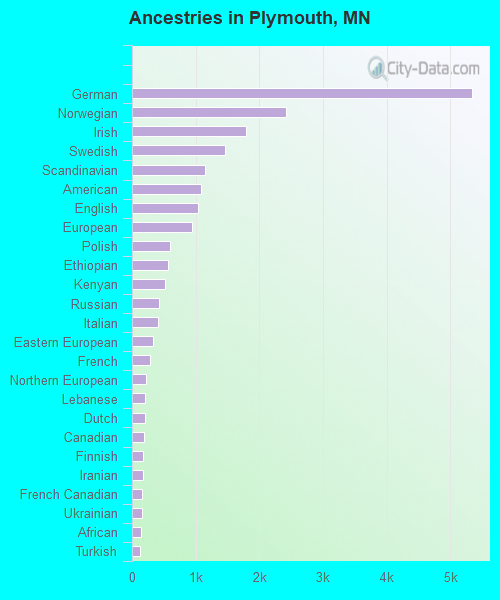
First ancestries reported:
German: 5,342 (16.3%)
Norwegian: 2,425 (7.4%)
Irish: 1,791 (5.5%)
Swedish: 1,466 (4.5%)
Scandinavian: 1,148 (3.5%)
American: 1,089 (3.3%)
English: 1,032 (3.2%)
European: 943 (2.9%)
Polish: 591 (1.8%)
Ethiopian: 564 (1.7%)
Kenyan: 514 (1.6%)
Russian: 432 (1.3%)
Italian: 412 (1.3%)
Eastern European: 336 (1.0%)
French: 288 (0.9%)
Northern European: 226 (0.7%)
Lebanese: 209 (0.6%)
Dutch: 200 (0.6%)
Canadian: 182 (0.6%)
Finnish: 180 (0.5%)
Iranian: 170 (0.5%)
French Canadian: 160 (0.5%)
Ukrainian: 155 (0.5%)
African: 139 (0.4%)
Turkish: 133 (0.4%)
Liberian: 128 (0.4%)
Jamaican: 124 (0.4%)
Scotch-Irish: 109 (0.3%)
Scottish: 105 (0.3%)
Israeli: 102 (0.3%)
Belgian: 101 (0.3%)
Afghan: 91 (0.3%)
Greek: 83 (0.3%)
Nigerian: 80 (0.2%)
Danish: 72 (0.2%)
Slovak: 71 (0.2%)
Luxembourger: 68 (0.2%)
Bulgarian: 60 (0.2%)
Hungarian: 55 (0.2%)
Romanian: 54 (0.2%)
Croatian: 54 (0.2%)
Senegalese: 41 (0.1%)
Brazilian: 38 (0.1%)
Czech: 36 (0.1%)
Swiss: 34 (0.1%)
Egyptian: 28 (0.09%)
Lithuanian: 27 (0.08%)
British: 26 (0.08%)
Latvian: 25 (0.08%)
Welsh: 24 (0.07%)
West Indian: 24 (0.07%)
Ugandan: 21 (0.06%)
Yugoslavian: 19 (0.06%)
Haitian: 16 (0.05%)
Armenian: 13 (0.04%)
Czechoslovakian: 12 (0.04%)
Slavic: 11 (0.03%)
Austrian: 8 (0.02%)
Pennsylvania German: 2 (0.01%)
Most common places of birth for foreign-born residents (%): India Plymouth:
30.6% (3,479)Minnesota:
6.7% (32,141)
Vietnam Plymouth:
4.8% (545)Minnesota:
3.8% (18,442)
Kenya Plymouth:
4.7% (533)Minnesota:
3.3% (15,701)
China, excluding Hong Kong and Taiwan Plymouth:
3.4% (383)Minnesota:
3.6% (17,119)
Canada Plymouth:
3.3% (375)Minnesota:
2.5% (11,939)
Mexico Plymouth:
3.0% (344)Minnesota:
12.1% (58,312)
Russia Plymouth:
3.0% (343)Minnesota:
1.3% (6,329)
Philippines Plymouth:
2.8% (315)Minnesota:
2.0% (9,850)
Ukraine Plymouth:
2.7% (313)Minnesota:
1.0% (4,646)
Ethiopia Plymouth:
2.5% (287)Minnesota:
5.1% (24,630)
Belarus Plymouth:
2.4% (274)Minnesota:
0.3% (1,358)
Liberia Plymouth:
2.1% (239)Minnesota:
2.8% (13,695)
Iran Plymouth:
1.9% (219)Minnesota:
0.4% (2,035)
Korea Plymouth:
1.6% (186)Minnesota:
2.4% (11,675)
Ecuador Plymouth:
1.5% (174)Minnesota:
1.8% (8,438)
Place of birth for U.S.-born residents:
This state: 47,719Other state: 20,925Northeast: 1,914Midwest: 13,773South: 2,633West: 2,605 87.8% of Plymouth residents lived in the same house 1 years ago.
Out of people who lived in different houses, 37.3% lived in this county.
Out of people who lived in different counties, 50.2% lived in Minnesota.
Plymouth:
87.8%State average:
87.4%
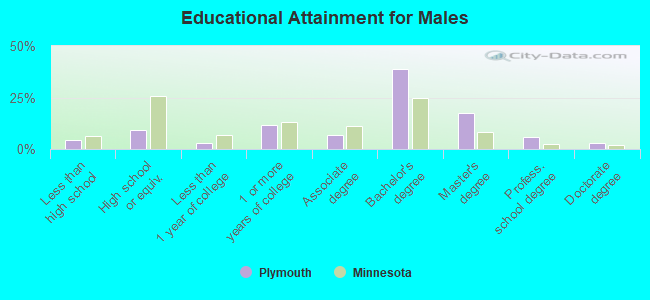
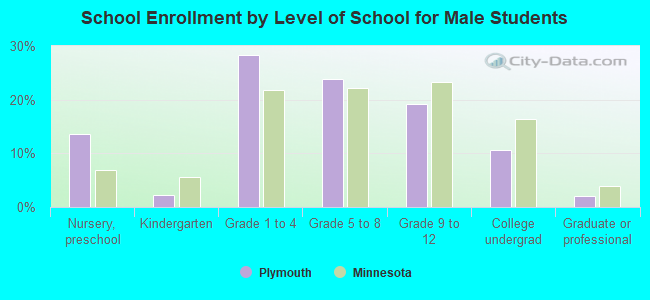
Education attainment for males 25 years and older:
No schooling: 451Nursery to 4th grade: 05th and 6th grade: 07th and 8th grade: 1329th grade: 010th grade: 22611th grade: 9812th grade, no diploma: 269High school graduate (or equivalency): 2,456Less than 1 year of college: 794Some college more than 1 year, no degree: 3,093Associate degree: 1,820Bachelor's degree: 10,413Master's degree: 4,676Professional school degree: 1,533Doctorate degree: 774
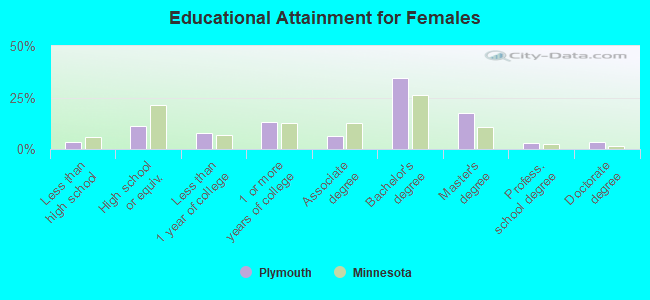
Education attainment for females 25 years and older:
No schooling: 444Nursery to 4th grade: 05th and 6th grade: 07th and 8th grade: 1409th grade: 010th grade: 13311th grade: 13212th grade, no diploma: 140High school graduate (or equivalency): 3,510Less than 1 year of college: 2,386Some college more than 1 year, no degree: 4,085Associate degree: 1,942Bachelor's degree: 10,777Master's degree: 5,523Professional school degree: 979Doctorate degree: 1,067
Housing units in structures:
One, detached: 20,604One, attached: 6,261Two: 2503 or 4: 6255 to 9: 49910 to 19: 16620 to 49: 1,52050 or more: 5,578Housing units lacking complete plumbing facilities in 2022: 0.7%Housing units lacking complete kitchen facilities in 2022: 0.7%House/condo owner moved in on average 10 years ago
Renter moved in on average 2 years ago
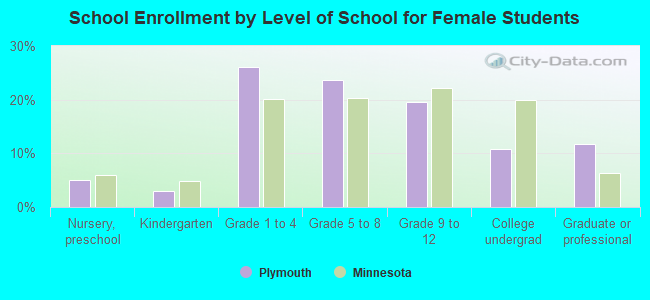
Private vs. public school enrollment:
Students in private schools in grades 1 to 8 (elementary and middle school): 773 Students in private schools in grades 9 to 12 (high school): 203 Students in private undergraduate colleges: 498 Here:
26.0%Minnesota:
26.2%