Plymouth, CT (Connecticut) Houses and Residents
| Plymouth: | $264,832 |
| Connecticut: | $347,200 |
Total population: 12,243 (Urban population: 9,134, Rural population: 2,500 (75 farm, 2,425 nonfarm))
Houses: 4,646 (4,453 occupied: 3,498 owner occupied, 955 renter occupied)
| % of renters here: | 21% |
| State: | 34% |
Housing density: 214 houses/condos per square mile
Median price asked for vacant for-sale houses and condos in 2022 in this county: $399,480.
Median contract rent in 2022: $1,008 (lower quartile is $718, upper quartile is $1,287)
Median rent asked for vacant for-rent units in 2022: $768
Median gross rent in Plymouth, CT in 2022: $1,218
Housing units in Plymouth with a mortgage: 2,274 (238 second mortgage, 344 home equity loan, 10 both second mortgage and home equity loan)
Houses without a mortgage: 700
Compare current foreclosures near Plymouth, CT:
| Photo | Address | Area | Beds / Baths | Price | Details |
|---|---|---|---|---|---|

|
#1
North St
Plymouth, CT 06782
|
1,758 sq. feet
|
2 baths 3 beds |
show details | |

|
#2
Hillside Ave
Plymouth, CT 06782
|
1,336 sq. feet
|
1 baths 2 beds |
show details | |

|
#3
Watch Tower Rd
Plymouth, CT 06782
|
2,036 sq. feet
|
3 baths 3 beds |
show details | |

|
#4
Birchwood Dr
Hamden, CT 06518
|
2,604 sq. feet
|
2 baths 3 beds |
$614,900
|
show details |

|
#5
Janwood Rd
Waterbury, CT 06708
|
1,200 sq. feet
|
2 baths 3 beds |
$275,000
|
show details |

|
#6
Allen St
Bristol, CT 06010
|
1,092 sq. feet
|
1 baths 3 beds |
$215,000
|
show details |

|
#7
Chestnut St
Naugatuck, CT 06770
|
1,012 sq. feet
|
1 baths 2 beds |
$279,900
|
show details |

|
#8
Willis Ave
Meriden, CT 06450
|
1,008 sq. feet
|
1 baths 2 beds |
$299,900
|
show details |

|
#9
Peck St
Berlin, CT 06037
|
608 sq. feet
|
1 baths 1 beds |
$144,900
|
show details |

|
#10
Woodbine St
Torrington, CT 06790
|
2,756 sq. feet
|
3 baths 6 beds |
$419,900
|
show details |
| Photo | Address | Area | Beds / Baths | Price | Details |
|---|---|---|---|---|---|

|
#11
Dowd Ave
Canton, CT 06019
|
1,190 sq. feet
|
1 baths 2 beds |
$239,900
|
show details |

|
#12
Clinton Hill Rd
Wolcott, CT 06716
|
1,828 sq. feet
|
1 baths 3 beds |
$240,000
|
show details |

|
#13
Roosevelt St
New Britain, CT 06051
|
1,536 sq. feet
|
2 baths 3 beds |
$299,900
|
show details |

|
#14
Richard St Apt 2
Newington, CT 06111
|
710 sq. feet
|
1 baths 1 beds |
show details | |

|
#15
21 Webster St
New Britain, CT 06051
|
3 sq. feet
|
2 baths 6 beds |
show details | |

|
#16
Flanders Rd
Woodbury, CT 06798
|
2,424 sq. feet
|
2 baths 4 beds |
show details | |

|
#17
Orient St
Meriden, CT 06450
|
1,780 sq. feet
|
3 baths 3 beds |
show details | |

|
#18
Sylvan Ave
Waterbury, CT 06706
|
1,350 sq. feet
|
1 baths 4 beds |
show details | |

|
#19
Clairmont Ave
Waterbury, CT 06708
|
1,564 sq. feet
|
2 baths 4 beds |
show details | |

|
#20
Lydale Pl
Meriden, CT 06450
|
1,716 sq. feet
|
2 baths 3 beds |
show details |
| Photo | Address | Area | Beds / Baths | Price | Details |
|---|---|---|---|---|---|

|
#21
Pond St
New Britain, CT 06051
|
2,400 sq. feet
|
2 baths 6 beds |
show details | |

|
#22
Main St
Newington, CT 06111
|
1,880 sq. feet
|
1 baths 3 beds |
show details | |

|
#23
Amity St
Meriden, CT 06450
|
1,568 sq. feet
|
2 baths 3 beds |
show details | |

|
#24
Robbins Ave
Newington, CT 06111
|
1,346 sq. feet
|
2 baths 3 beds |
show details | |

|
#25
New Haven Rd Apt 6-E
Naugatuck, CT 06770
|
1,008 sq. feet
|
1 baths 2 beds |
show details | |

|
#26
Litchfield Rd
Harwinton, CT 06791
|
2,216 sq. feet
|
1 baths 3 beds |
show details | |

|
#27
White Pine Rd
Torrington, CT 06790
|
1,536 sq. feet
|
2 baths 3 beds |
show details | |

|
#28
Hidden Valley Dr
Meriden, CT 06451
|
2,264 sq. feet
|
2 baths 4 beds |
show details | |

|
#29
City Ave
New Britain, CT 06051
|
1,932 sq. feet
|
1 baths 3 beds |
show details | |

|
#30
Barbara Dr
Waterbury, CT 06705
|
1,248 sq. feet
|
2 baths 3 beds |
show details |
| Photo | Address | Area | Beds / Baths | Price | Details |
|---|---|---|---|---|---|

|
#31
Farmington Chase Cre
Farmington, CT 06032
|
1,317 sq. feet
|
1 baths 2 beds |
show details | |

|
#32
Doran St
Waterbury, CT 06704
|
1,036 sq. feet
|
1 baths 3 beds |
show details | |

|
#33
Pratt St
Meriden, CT 06450
|
1,040 sq. feet
|
2 baths 3 beds |
show details | |

|
#34
Calumet St
Waterbury, CT 06710
|
2,175 sq. feet
|
2 baths 4 beds |
show details | |

|
#35
Maple Hill Rd
Naugatuck, CT 06770
|
1,600 sq. feet
|
2 baths 3 beds |
show details | |

|
#36
Evansville Ave
Meriden, CT 06451
|
624 sq. feet
|
1 baths 3 beds |
show details | |

|
#37
Fawn Meadow Dr
Naugatuck, CT 06770
|
3,052 sq. feet
|
3 baths 4 beds |
show details | |

|
#38
Horne Cir
Southington, CT 06489
|
1,902 sq. feet
|
2 baths 4 beds |
show details | |

|
#39
Spring St
Meriden, CT 06451
|
660 sq. feet
|
1 baths 3 beds |
show details | |

|
#40
Old Fairwood Rd
Bethany, CT 06524
|
2,464 sq. feet
|
3 baths 4 beds |
show details |
| Photo | Address | Area | Beds / Baths | Price | Details |
|---|---|---|---|---|---|

|
#41
Fairfield Ave
Waterbury, CT 06708
|
1,538 sq. feet
|
1 baths 2 beds |
show details | |

|
#42
Surrey Dr
Bristol, CT 06010
|
1,079 sq. feet
|
1 baths 3 beds |
show details | |

|
#43
W Main St
New Britain, CT 06053
|
1,584 sq. feet
|
2 baths 4 beds |
show details | |

|
#44
Melinda Ln
Bristol, CT 06010
|
- sq. feet
|
2 baths 4 beds |
show details | |

|
#45
Broadview Ter
Hartford, CT 06106
|
1,821 sq. feet
|
2 baths 7 beds |
show details | |

|
#46
Marcia Dr
Torrington, CT 06790
|
1,496 sq. feet
|
2 baths 4 beds |
show details | |

|
#47
Tom Swamp Rd
Hamden, CT 06518
|
2,008 sq. feet
|
2 baths 3 beds |
show details | |

|
#48
Spring St
Naugatuck, CT 06770
|
1,216 sq. feet
|
1 baths 3 beds |
show details | |

|
#49
Leonard Rd
Middlebury, CT 06762
|
1,072 sq. feet
|
1 baths 2 beds |
show details | |

|
Check over 1 million property listings on Foreclosure.com!
|
browse all offers | |||
Latest news about housing in Plymouth, CT collected exclusively by city-data.com from local newspapers, TV, and radio stations


Household type by relationship:
Households: 187,123- In family households: 156,490 (36,561 male householders, 14,969 female householders)
41,185 spouses, 52,814 children (49,404 natural, 1,325 adopted, 2,085 stepchildren), 2,365 grandchildren, 1,073 brothers or sisters, 1,650 parents, foster children, 1,216 other relatives, 3,500 non-relatives
- In nonfamily households: 30,633 (11,692 male householders (9,019 living alone)), 13,418 female householders (11,384 living alone)), 5,523 nonrelatives
- In group quarters: 2,804 (1,566 institutionalized population)
34,479 married couples with children.
7,472 single-parent households (1,895 men, 5,577 women).
92.3% of residents of Plymouth speak English at home.
1.0% of residents speak Spanish at home (52% speak English very well, 40% speak English well, 8% speak English not well).
6.7% of residents speak other Indo-European language at home (67% speak English very well, 27% speak English well, 6% speak English not well).
Foreign born population: 616 (4.9%)
(68.3% of them are naturalized citizens)
| Here: | 5.5 |
| State: | 6.5 |
| Here: | 4.1 |
| State: | 4.0 |

- Bedrooms in owner-occupied houses and condos in Plymouth, Connecticut
- 0no bedroom
- 901 bedroom
- 9292 bedrooms
- 2,0073 bedrooms
- 4184 bedrooms
- 545+ bedrooms

- Bedrooms in renter-occupied apartments in Plymouth, Connecticut
- 16no bedroom
- 2931 bedroom
- 4482 bedrooms
- 1723 bedrooms
- 184 bedrooms
- 85+ bedrooms

- Cars and other vehicles available in Plymouth in owner-occupied houses/condos
- 48no vehicle
- 8041 vehicle
- 1,7512 vehicles
- 6373 vehicles
- 2104 vehicles
- 485+ vehicles

- Cars and other vehicles available in Plymouth in renter-occupied apartments
- 123no vehicle
- 3951 vehicle
- 3922 vehicles
- 453 vehicles
- 04 vehicles
- 05+ vehicles

- Rooms in owner-occupied houses in Plymouth, Connecticut
- 01 room
- 132 rooms
- 393 rooms
- 4104 rooms
- 9385 rooms
- 9686 rooms
- 6817 rooms
- 2828 rooms
- 1679+ rooms

- Rooms in renter-occupied apartments in Plymouth, Connecticut
- 81 room
- 742 rooms
- 1833 rooms
- 3124 rooms
- 2535 rooms
- 876 rooms
- 237 rooms
- 78 rooms
- 89+ rooms


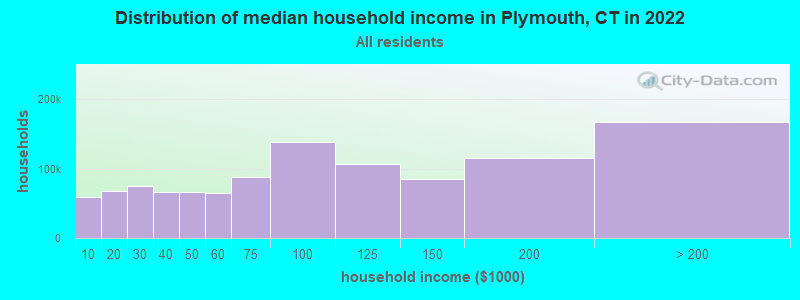
Plymouth, CT household income distribution

- 56,682Less than $10,000
- 64,682$10,000 to $19,999
- 72,365$20,000 to $29,999
- 63,738$30,000 to $39,999
- 64,058$40,000 to $49,999
- 62,072$50,000 to $59,999
- 84,895$60,000 to $74,999
- 133,467$75,000 to $99,999
- 101,998$100,000 to $124,999
- 81,378$125,000 to $149,999
- 110,720$150,000 to $199,999
- 161,261$200,000 or more
Percentage of workers working in this county: 27.6%
Number of people working at home: 1,073 (16.1% of all workers)
Travel time to work (commute)
- Less than 5 minutes: 148
- 5 to 9 minutes: 435
- 10 to 14 minutes: 792
- 15 to 19 minutes: 930
- 20 to 24 minutes: 898
- 25 to 29 minutes: 531
- 30 to 34 minutes: 746
- 35 to 39 minutes: 220
- 40 to 44 minutes: 267
- 45 to 59 minutes: 514
- 60 to 89 minutes: 314
- 90 or more minutes: 78
Means of transportation to work:
- Drove a car alone: 5,295 (88.9%)
- Carpooled: 447 (7.5%)
- Bus or trolley bus: 18 (0.3%)
- Motorcycle: 14 (0.2%)
- Walked: 92 (1.5%)
- Other means: 7 (0.1%)
- Worked at home: 82 (1.4%)


- Year of entry for the foreign-born population in Plymouth, Connecticut
- 211995 to March 2000
- 71990 to 1994
- 181985 to 1989
- 221980 to 1984
- 181975 to 1979
- 351970 to 1974
- 811965 to 1969
- 194Before 1965
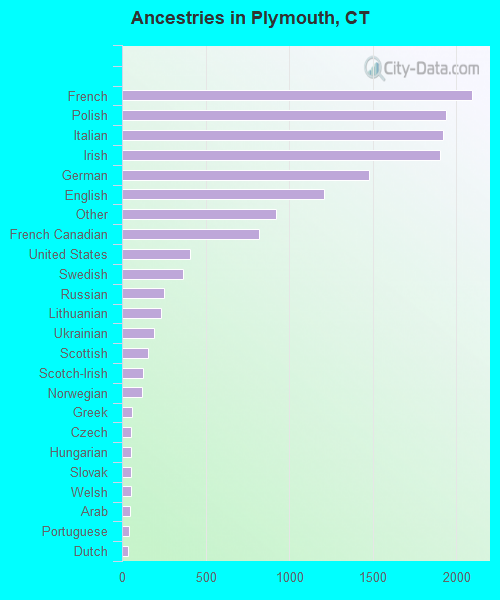
First ancestries reported:
- French: 2,092 (14.4%)
- Polish: 1,942 (13.3%)
- Italian: 1,921 (13.2%)
- Irish: 1,906 (13.1%)
- German: 1,477 (10.1%)
- English: 1,207 (8.3%)
- Other: 919 (6.3%)
- French Canadian: 817 (5.6%)
- United States: 408 (2.8%)
- Swedish: 363 (2.5%)
- Russian: 253 (1.7%)
- Lithuanian: 236 (1.6%)
- Ukrainian: 189 (1.3%)
- Scottish: 156 (1.1%)
- Scotch-Irish: 125 (0.9%)
- Norwegian: 118 (0.8%)
- Greek: 57 (0.4%)
- Czech: 55 (0.4%)
- Hungarian: 55 (0.4%)
- Slovak: 52 (0.4%)
- Welsh: 52 (0.4%)
- Arab: 45 (0.3%)
- Portuguese: 41 (0.3%)
- Dutch: 34 (0.2%)
- Swiss: 19 (0.1%)
- Subsaharan African: 15 (0.1%)
- Danish: 9 (0.06%)
- West Indian: 7 (0.05%)
Most common places of birth for foreign-born residents (%):
| Plymouth: | 45.5% (180) |
| Connecticut: | 5.2% (19,083) |
| Plymouth: | 21.2% (84) |
| Connecticut: | 6.9% (25,507) |
| Plymouth: | 10.1% (40) |
| Connecticut: | 7.0% (26,023) |
| Plymouth: | 3.5% (14) |
| Connecticut: | 3.1% (11,432) |
| Plymouth: | 3.5% (14) |
| Connecticut: | 0.4% (1,513) |
| Plymouth: | 3.3% (13) |
| Connecticut: | 1.4% (5,021) |
| Plymouth: | 2.5% (10) |
| Connecticut: | 3.2% (12,009) |
| Plymouth: | 2.3% (9) |
| Connecticut: | 0.7% (2,742) |
| Plymouth: | 2.3% (9) |
| Connecticut: | 1.7% (6,181) |
| Plymouth: | 1.8% (7) |
| Connecticut: | 0.5% (2,025) |
| Plymouth: | 1.5% (6) |
| Connecticut: | 0.5% (1,693) |
Place of birth for U.S.-born residents:
- This state: 9,283
- Other state: 1,799
- Northeast: 1,386
- Midwest: 125
- South: 192
- West: 96
67% of Plymouth residents lived in the same house 5 years ago.
Out of people who lived in different houses, 40% lived in this county.
Out of people who lived in different counties, 87% lived in Connecticut.
Education attainment for males 25 years and older:
- No schooling: 24
- Nursery to 4th grade: 0
- 5th and 6th grade: 26
- 7th and 8th grade: 260
- 9th grade: 71
- 10th grade: 164
- 11th grade: 97
- 12th grade, no diploma: 155
- High school graduate (or equivalency): 1,601
- Less than 1 year of college: 228
- Some college more than 1 year, no degree: 390
- Associate degree: 310
- Bachelor's degree: 350
- Master's degree: 148
- Professional school degree: 9
- Doctorate degree: 12

Education attainment for females 25 years and older:
- No schooling: 17
- Nursery to 4th grade: 0
- 5th and 6th grade: 29
- 7th and 8th grade: 197
- 9th grade: 100
- 10th grade: 93
- 11th grade: 130
- 12th grade, no diploma: 107
- High school graduate (or equivalency): 1,631
- Less than 1 year of college: 340
- Some college more than 1 year, no degree: 470
- Associate degree: 347
- Bachelor's degree: 351
- Master's degree: 188
- Professional school degree: 34
- Doctorate degree: 7


Housing units in structures:
- One, detached: 3,410
- One, attached: 55
- Two: 376
- 3 or 4: 350
- 5 to 9: 216
- 10 to 19: 54
- 20 to 49: 63
- 50 or more: 48
- Mobile homes: 74
Median worth of mobile homes: $114,381
Housing units lacking complete kitchen facilities: 0.6%

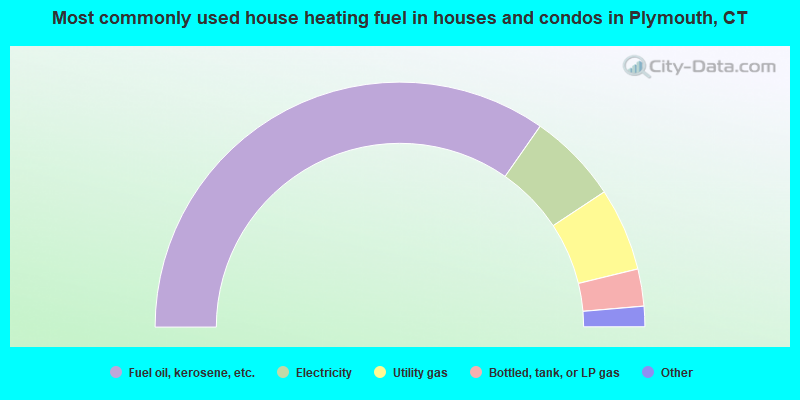
- 69.4%Fuel oil, kerosene, etc.
- 12.0%Electricity
- 11.0%Utility gas
- 4.9%Bottled, tank, or LP gas
- 2.4%Wood
- 0.3%Other fuel
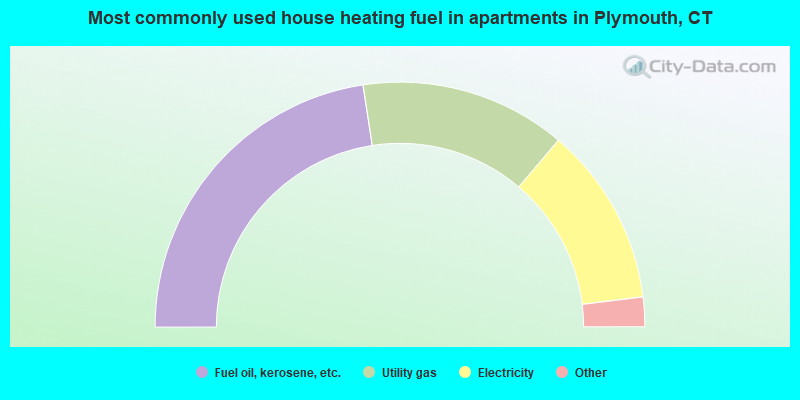
- 45.2%Fuel oil, kerosene, etc.
- 27.2%Utility gas
- 23.7%Electricity
- 1.5%No fuel used
- 1.4%Bottled, tank, or LP gas
- 0.5%Wood
- 0.5%Other fuel
Private vs. public school enrollment:
| Here: | 7.4% |
| Connecticut: | 9.9% |
| Here: | 4.5% |
| Connecticut: | 11.0% |
| Here: | 27.3% |
| Connecticut: | 33.4% |


